Engineer
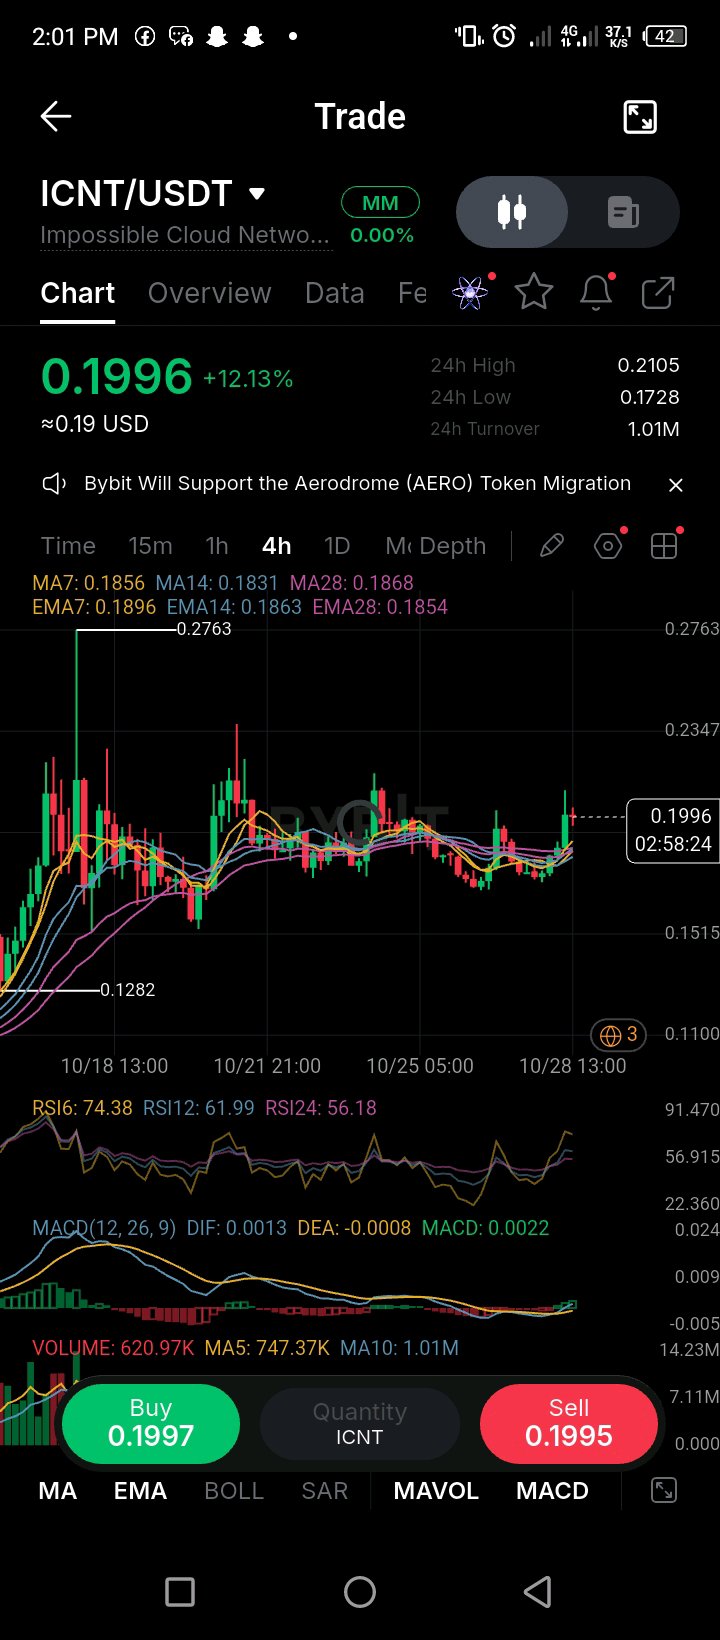
ICNT Is Picking Up Momentum Again 👀
$ICNTUSDT is making a move on the 4H chart, trading at 0.1996 and up 12.13%. After spending several candles moving sideways, the price is starting to push higher again. Now I’m watching to see if buyers can keep this momentum going. The moving averages are looking better, with MA7 at 0.1856 sitting above MA14 at 0.1831 and MA28 at 0.1868. The price is also trading above these averages, which is a positive sign for the bulls. MACD has turned positive, with DIF at 0.0013 and the histogram at 0.0022. RSI6 is at 74.38, so the price is already getting a bit hot in the short term. A pullback wouldn’t be surprising after this kind of move. Here are the levels I’m watching: Resistance: 0.2105, the 24-hour high. If $ICNT breaks above this level and holds, buyers could push for another move higher. Support: Around 0.1850–0.1870, where several moving averages are sitting. If the price pulls back, this is the area I’d watch first. My take? $ICNT looks bullish for now, but after a 12% move, I wouldn’t rush to chase the price. A clean break above 0.2105 would be a stronger sign that buyers are ready to take it higher. Risk Disclosure: Always DYOR. #WSOT2026 #AnthropicS1Filing #IMPACTbyTrade #MyByXTake #MidtermsMarketWatch
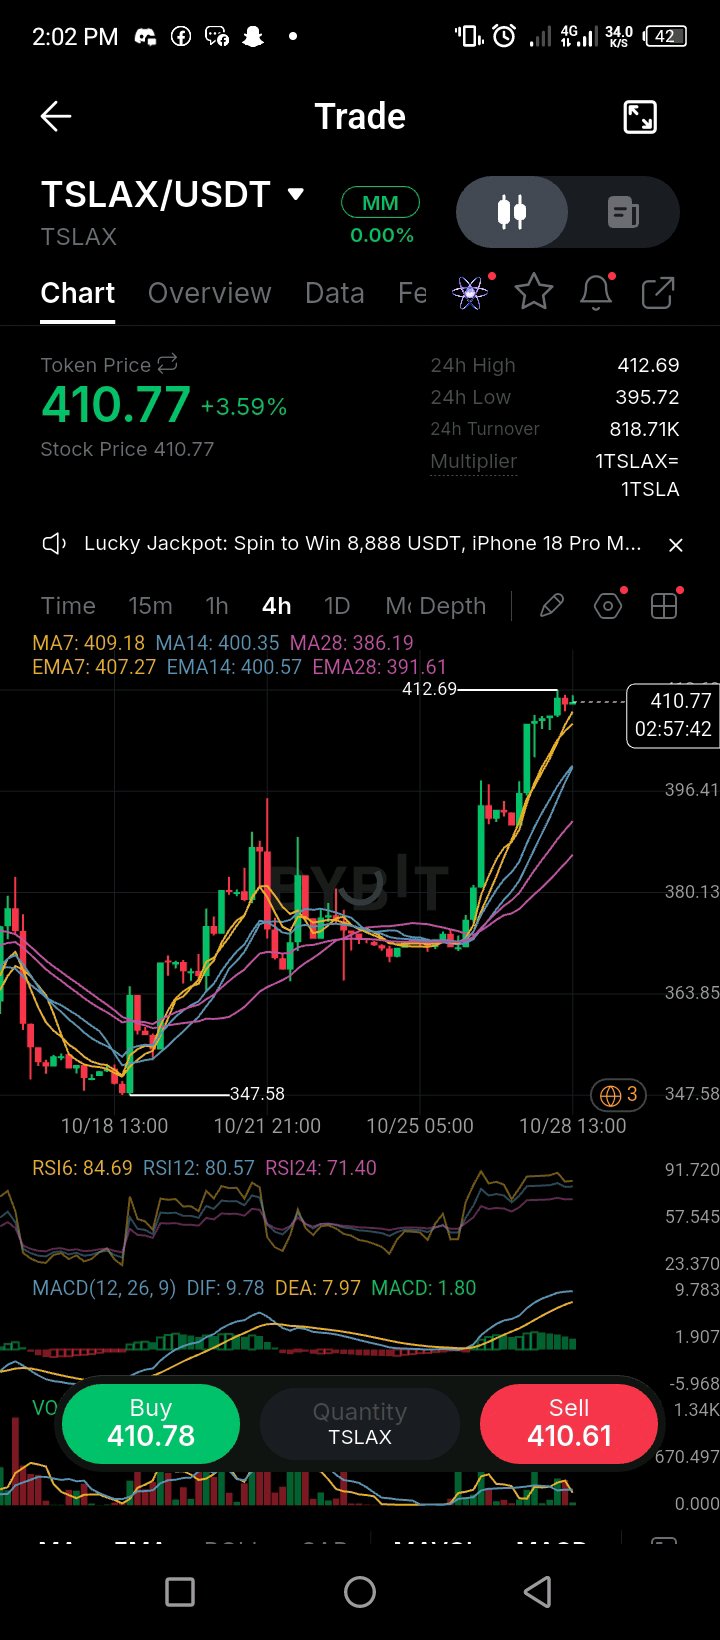
TSLAX Is Getting Close to a Key Level 🚀
$TSLAXUSDT is having a strong run on the 4H chart, currently trading at 410.77, up 3.59%. Buyers have pushed the price close to 412.69, the recent high. The big question now is whether they can break above it. The moving averages are looking good for the bulls, with the shorter-term averages sitting above the longer-term ones. MACD is also positive, which shows that buying momentum is still there. But there’s one thing I’m watching closely: RSI. The readings are quite high, especially RSI6 at 84.69. That tells me the price has been moving up fast, so a pullback wouldn’t be surprising. For now, 412.69 is the level to watch. If buyers break above it and hold, we could see another move up. If the price gets rejected, I’ll be watching the 407–409 area for support, followed by 400–401. Personally, I’m leaning bullish, but I wouldn’t rush into a trade here. Let the price show its next move first. Risk Disclosure: Always DYOR. #WSOT2026 #AnthropicS1Filing #IMPACTbyTrade #MyByXTake #MidtermsMarketWatch
Let's Watch XRP and Look for an Entry 👀
$XRPUSDT is trading around $1.3329 on the 4H chart, up 2.59%. Price has started pushing up again after bouncing from the $1.2546 low, and buyers are slowly gaining ground. Right now, price is trading above the moving averages. MA7 is at $1.3255, MA14 at $1.3110, and MA28 at $1.3019. The EMAs are also sitting below the current price, which is a good sign for the short-term structure. The next level I'm watching is around $1.3442, the recent 24-hour high. Price is getting closer to that area, so I want to see how it reacts when it gets there. If buyers push through resistance, we could get further upside. But if price gets rejected, a pullback could give us a better opportunity to enter. I'm not looking to jump in blindly at the current price. I'd rather drop to a lower timeframe and watch for a clean setup. If price pulls back into a support area and gives us confirmation that buyers are stepping in, then we can consider an entry. If it breaks resistance first, I'll wait to see whether it holds on a retest. RSI6 is at 69.67, RSI12 at 62.85, and RSI24 at 55.21. Momentum is leaning bullish, but the shorter RSI is getting close to overbought territory. MACD is also positive, with DIF at 0.0067 above DEA at 0.0019. That supports the current recovery. Volume is currently 717.89K, below the MA5 at 2.47M and MA10 at 2.78M. So although price is moving up, I'd like to see stronger volume if XRP makes a serious attempt at resistance. For now, the plan is simple: keep an eye on $1.3442, drop to a lower timeframe, and wait for price to show us an entry. No need to force a trade. We need confirmation, a clear invalidation level, and a setup that makes sense. Risk Disclosure: Always DYOR. #WSOT2026 #AnthropicS1Filing #IMPACTbyTrade #MyByXTake #MidtermsMarketWatch

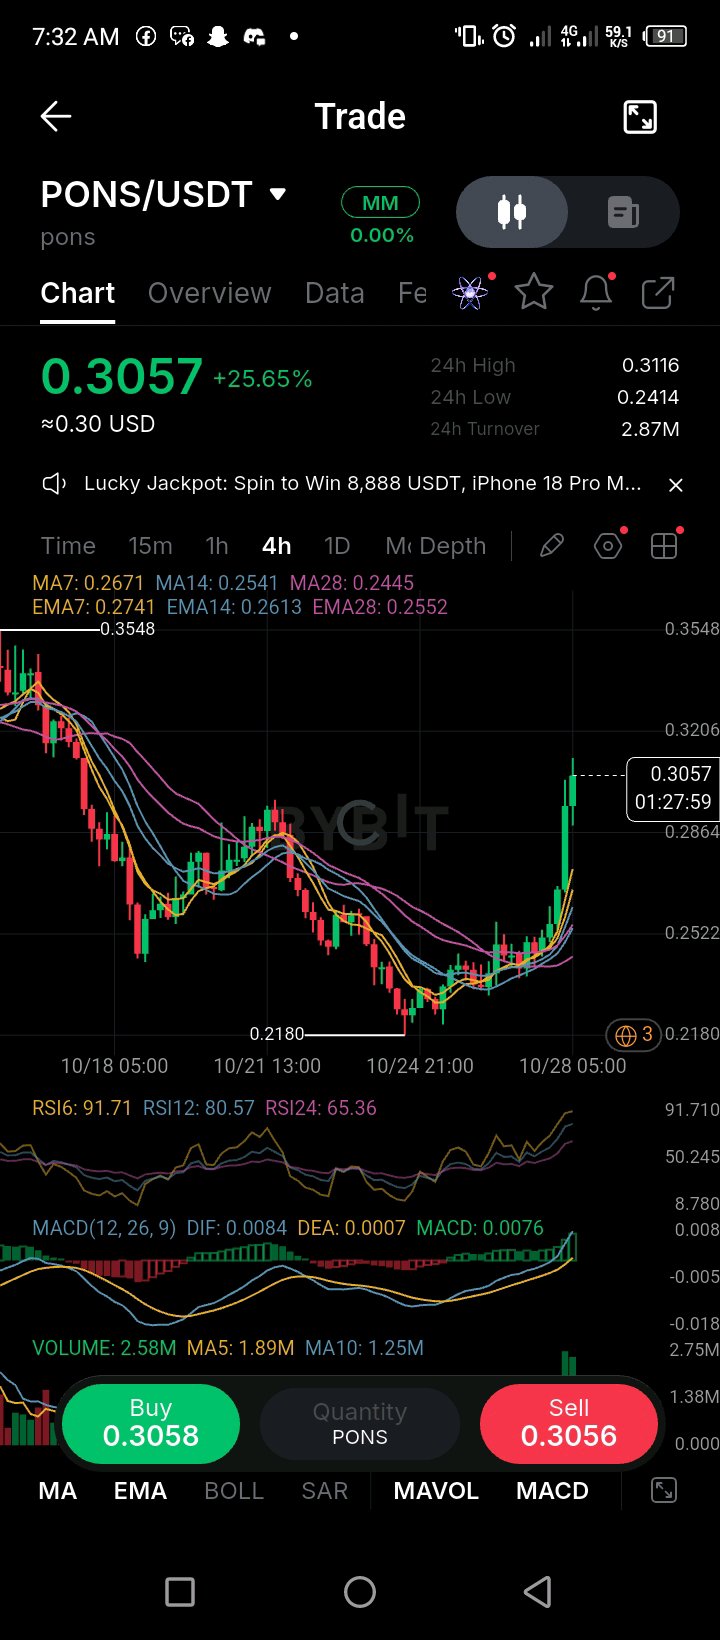
PONS Is Moving Fast, But I'm Not Chasing This Candle 👀 $PONSUSDT is up 25.65%, trading around $0.3057 on the 4H chart. After dropping from the $0.35 area to a low of $0.2180, price spent some time trying to find a bottom. Now buyers have stepped in hard, pushing it back above $0.30. The change in momentum is clear. Price has broken out of the recent consolidation around $0.24–$0.25, and the moving averages are now turning upward. MA7 is at $0.2671, MA14 at $0.2541, and MA28 at $0.2445. Price is trading well above all three. The EMAs are also aligned below the current price, with EMA7 at $0.2741, EMA14 at $0.2613, and EMA28 at $0.2552. That's a strong shift in the short-term structure after the previous downtrend. But here's the thing: $PONS has already made a sharp move, so entering at the current price carries risk. RSI6 is at 91.71 and RSI12 is at 80.57, while RSI24 sits at 65.36. Short-term momentum is extremely stretched. That doesn't mean the price has to dump, but a pullback or some sideways movement would not surprise me. MACD is firmly positive. DIF is at 0.0084, above DEA at 0.0007, with the histogram at 0.0076. Buyers currently have the momentum, and the histogram is expanding alongside the latest push. Volume is also picking up: 2.58M compared with the MA5 at 1.89M and MA10 at 1.25M. That gives the breakout more weight than a move happening on very quiet volume. Now I'm watching how price handles the $0.3116 area, the visible 24-hour high. If buyers can push through it and hold above, the next area on the chart to watch is around $0.3206. A stronger continuation could bring the previous high region near $0.3548 back into focus. If price gets rejected, I'd rather see how it behaves around $0.286–$0.274 first. The EMA7 is sitting near $0.2741, making that a useful short-term reference. Below that, the $0.267–$0.254 area is another zone to watch if the pullback deepens. For me, the trend has clearly improved, but I wouldn't rush to buy after a 25% move with RSI this high. I'd rather wait for a pullback, see whether buyers defend support, and then look for confirmation before considering an entry. $PONS has momentum right now. The question is whether buyers can sustain it after this big push. Risk Disclosure: Always DYOR. #WSOT2026 #AnthropicS1Filing #IMPACTbyTrade #MyByXTake #MidtermsMarketWatch
GMX Is Showing Signs of a Trend Reversal 👀
$GMXUSDT is up 10.76%, trading around $8.933 on the 4H chart. After the steady decline from previous highs, price has bounced strongly from $7.536 and pushed back above the moving averages. That's a change worth paying attention to. What matters now is whether this move can develop into a proper reversal. The MA7 is at $8.459, MA14 at $8.254, and MA28 at $8.306. Price is trading above all three, while the EMAs are also sitting below the current price. Short-term momentum has shifted in favour of buyers, but I still want to see how price behaves around resistance before calling a confirmed trend change. The first level I'm watching is $9.00, followed by the recent high around $9.134. A clean break above that high, followed by a hold, would give buyers a stronger case for continuation. If price gets rejected there, the $8.55–$8.30 region is worth watching for support. A pullback that holds above this area could offer a healthier setup than chasing the current move. RSI6 is at 87.83, RSI12 at 74.04, and RSI24 at 63.00. Momentum is strong, but the short-term market is stretched. That doesn't mean price must fall, but it does increase the chance of a pause or retracement before another move higher. MACD has turned positive, with DIF at 0.109 above DEA at 0.023 and a positive histogram of 0.086. This supports the current bullish momentum. Volume is 5.64K, close to the MA5 of 5.73K and slightly above the MA10 of 5.35K. I'd like to see volume expand if price makes another serious attempt at resistance. For now, I'm keeping $GMX on the watchlist. The structure is improving, but the next test is whether buyers can break $9.134 and hold it. If price pulls back first, I'll be watching the moving-average zone to see whether it acts as support. No need to rush into an extended candle; let price show its hand. Risk Disclosure: Always DYOR. #WSOT2026 #AnthropicS1Filing #IMPACTbyTrade #MyByXTake #MidtermsMarketWatch

AVA is bouncing, but can it hold this level? 👀
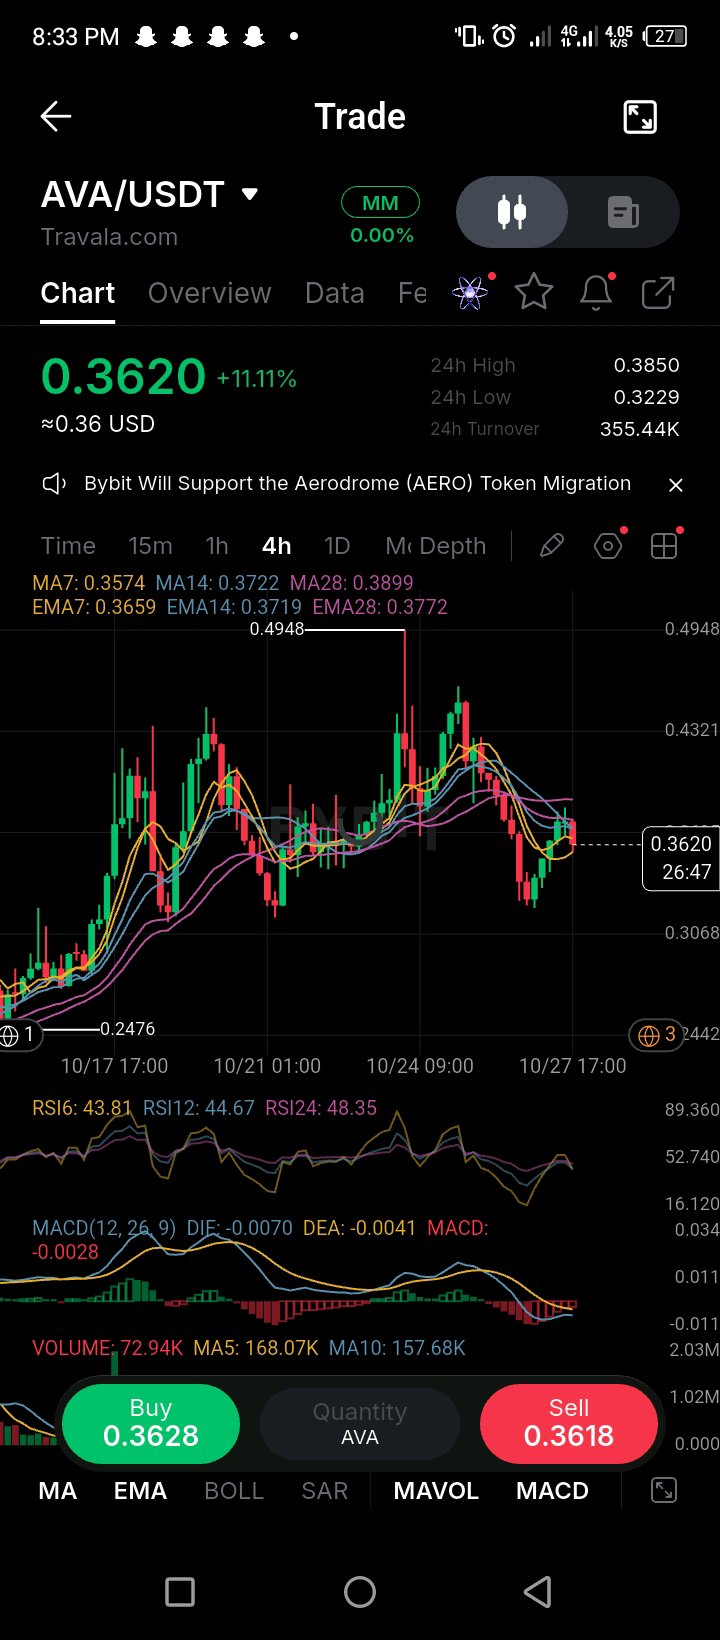
$AVAUSDT is up 11.11%, trading around $0.3620 on the 4H chart. Price has recovered from the recent drop toward $0.32, but looking at the chart, I'm not convinced the buyers are back in full control yet. We had a strong run earlier, with price reaching $0.4948 before pulling back. Since then, AVA has struggled to make another clean move higher. The latest bounce is a good start, but now it needs to prove it can hold up. Here's what I'm watching. Price is sitting around $0.3620, with the short-term moving averages close by. MA7 is at $0.3574, MA14 at $0.3722, and MA28 at $0.3899. So we're above the MA7, but still below the MA14 and MA28. The EMAs tell a similar story, with EMA7 at $0.3659, EMA14 at $0.3719, and EMA28 at $0.3772. That means AVA still has some work to do. I'd like to see price get back above the $0.3720–$0.3780 area and hold it. If buyers manage that, the next area I'd watch is around $0.39. A move toward $0.43 would be a bigger step, but price would need to show real strength first. On the other hand, if this bounce starts fading, I'm watching $0.35 as a nearby level. Below that, the recent low around $0.3229 becomes important. Losing that area would put the recovery under more pressure. The RSI readings aren't showing much strength yet. RSI6 is at 43.81, RSI12 at 44.67, and RSI24 at 48.35. All three are below 50, so despite today's green move, momentum hasn't fully shifted in the bulls' favour. MACD is still negative too. DIF is at -0.0070, DEA at -0.0041, and the histogram is at -0.0028. The selling momentum may be easing, but there's no clear bullish confirmation here yet. Volume is another thing I'm keeping an eye on. The current reading is 72.94K, below the displayed MA5 of 168.07K and MA10 of 157.68K. Price is bouncing, but volume hasn't picked up enough to convince me that buyers are fully committed. Personally, I wouldn't rush into AVA just because it's up 11%. I'd rather see it reclaim the $0.3720–$0.3780 area with stronger volume. If it does, the setup starts looking better. If it gets rejected there, we could see another move back toward support. Let's see how the next few candles play out before making a decision. Risk Disclosure: Always DYOR. #WSOT2026 #AnthropicS1Filing #IMPACTbyTrade #MyByXTake #MidtermsMarketWatch
BILL is starting to move 👀
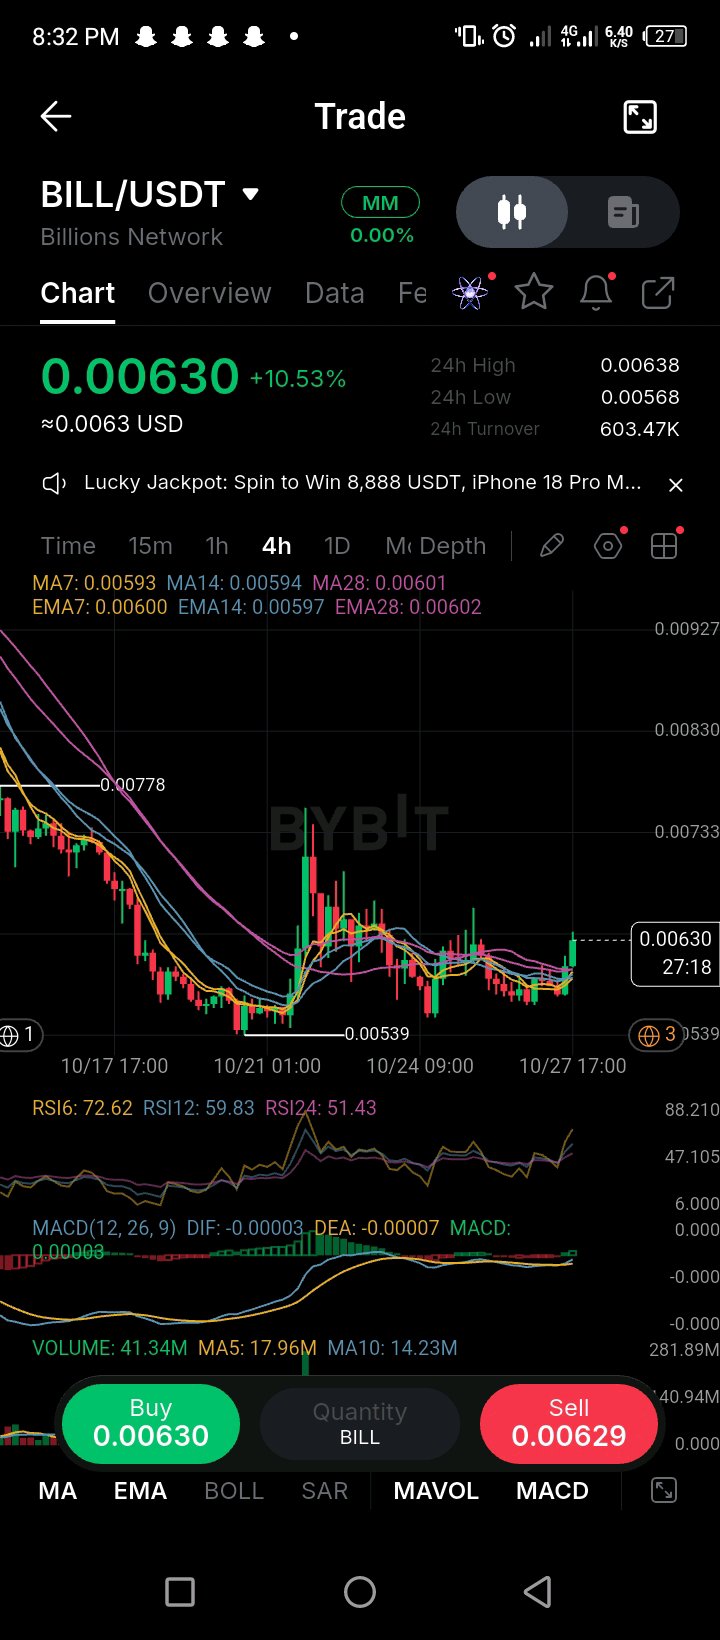
$BILLUSDT is up 10.53% and trading around $0.00630 on the 4H chart. I've been looking at how this one has been moving, and the interesting part is that price has been stuck in a small range for a few days. Now buyers are finally trying to push it out. Price fell from around $0.00778 and dropped all the way to $0.00539. Since then, it has mostly been moving sideways, struggling to get anywhere. This latest push has taken price above the moving averages, so I'm paying attention to see what happens next. Right now, those moving averages are sitting close together around $0.0060. MA7 is at $0.00593, MA14 at $0.00594, and MA28 at $0.00601. The EMAs are in the same area too. That's the level I'd be watching if price pulls back. I don't want to see $BILL pump for a few candles and then give everything back. If it comes down to test the $0.0060 area and buyers step in again, that would be a much better sign. But if price falls back below the moving averages, then this move might not go very far. Volume has picked up as well. It's showing 41.34M, while the MA5 is 17.96M and MA10 is 14.23M. So there's more activity behind this move than we've seen during the recent sideways action. Now we need to see if buyers can keep that going. One thing to be careful about is the RSI. RSI6 is already at 72.62, while RSI12 is 59.83 and RSI24 is 51.43. The short-term reading is getting high, so I wouldn't be surprised if price takes a breather before making another move. MACD is starting to turn up too. DIF is at -0.00003, DEA at -0.00007, with the histogram slightly positive at 0.00003. It's not a massive signal yet, but momentum is beginning to improve. As for the levels, I'm watching $0.0060 first. If buyers hold it, $0.0065–$0.0067 could be the next area price tries to reach. A stronger move could bring $0.0070–$0.0073 into play. If $0.0060 doesn't hold, I'll be watching how price reacts around $0.0058. Below that, the recovery starts looking weaker, especially if we head back toward the $0.00539 low. I'm not saying $BILL is ready to fly just yet. It's showing some life, and that's worth watching, but I want to see what happens after this first push. No point chasing it when we can wait and see whether buyers can actually hold their ground. Risk Disclosure: Always DYOR. #WSOT2026 #AnthropicS1Filing #IMPACTbyTrade #MyByXTake #MidtermsMarketWatch
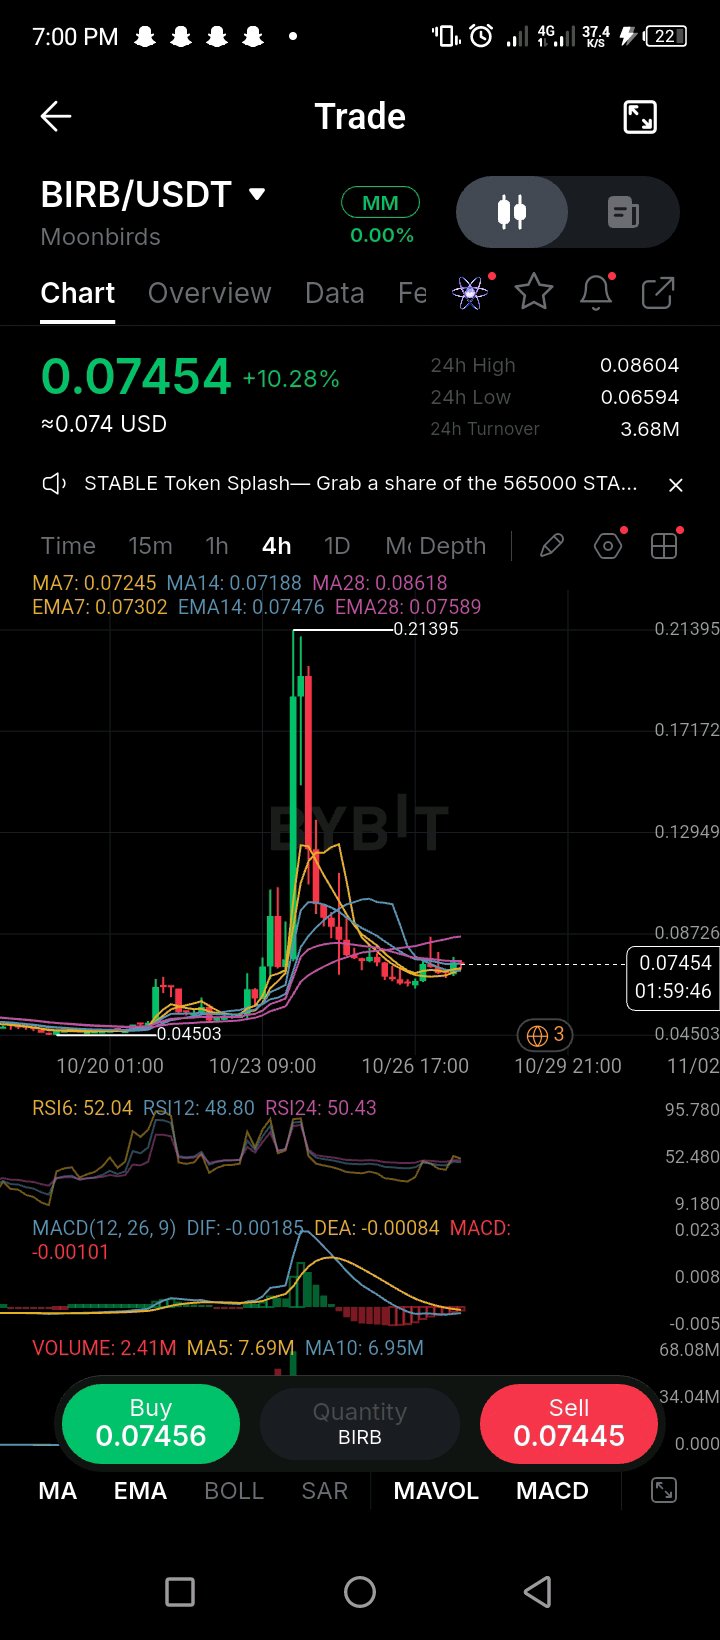
$BIRB is up 10.28%, trading around $0.07454 on the 4H chart. We're seeing a bounce, but there's still a lot to prove before I get too excited about this move. Looking back at the chart, $BIRBUSDT shot up to $0.21395 before the sellers took over. Since that peak, price has dropped heavily and spent the last few sessions moving sideways around the $0.07–$0.08 region. Buyers are trying to push it back up now, but let's see if they can actually hold the move. Price is back above MA7 at $0.07245 and MA14 at $0.07188, which is a positive sign. However, MA28 is sitting at $0.08618, while the EMAs are around $0.07302, $0.07476 and $0.07589. There are still levels overhead that price needs to reclaim before the recovery starts looking stronger. The RSI readings are pretty neutral: RSI6 at 52.04, RSI12 at 48.80 and RSI24 at 50.43. There's no strong momentum signal here yet. Buyers have started pushing, but they haven't taken clear control. MACD is still below zero, with DIF at -0.00185 and DEA at -0.00084. The histogram is at -0.00101. The selling pressure looks like it may be easing, but I'd like to see the MACD turn more convincingly before reading too much into this bounce. Volume is another thing I'm watching. The earlier pump came with a huge spike, but current volume is only 2.41M, below MA5 at 7.69M and MA10 at 6.95M. The interest behind this recovery isn't as strong as it was during the big move. On the upside, I'll be watching the $0.075–$0.076 area first, then $0.086. A break above these levels with better volume would give the bulls something to work with. If price drops again, the $0.070–$0.072 area is worth watching for support. Losing that area could put more pressure on price. For now, I'm keeping BIRB on the watchlist rather than jumping in. The bounce is there, but I want to see buyers reclaim resistance and show some strength before treating this as a proper reversal. Let's see if the bulls can follow through. Risk Disclosure: Always DYOR. #WSOT2026 #IMPACTbyTrade #AnthropicS1Filing #MyByXTake
BREV is up 17%, but can it break $0.09638? 👀
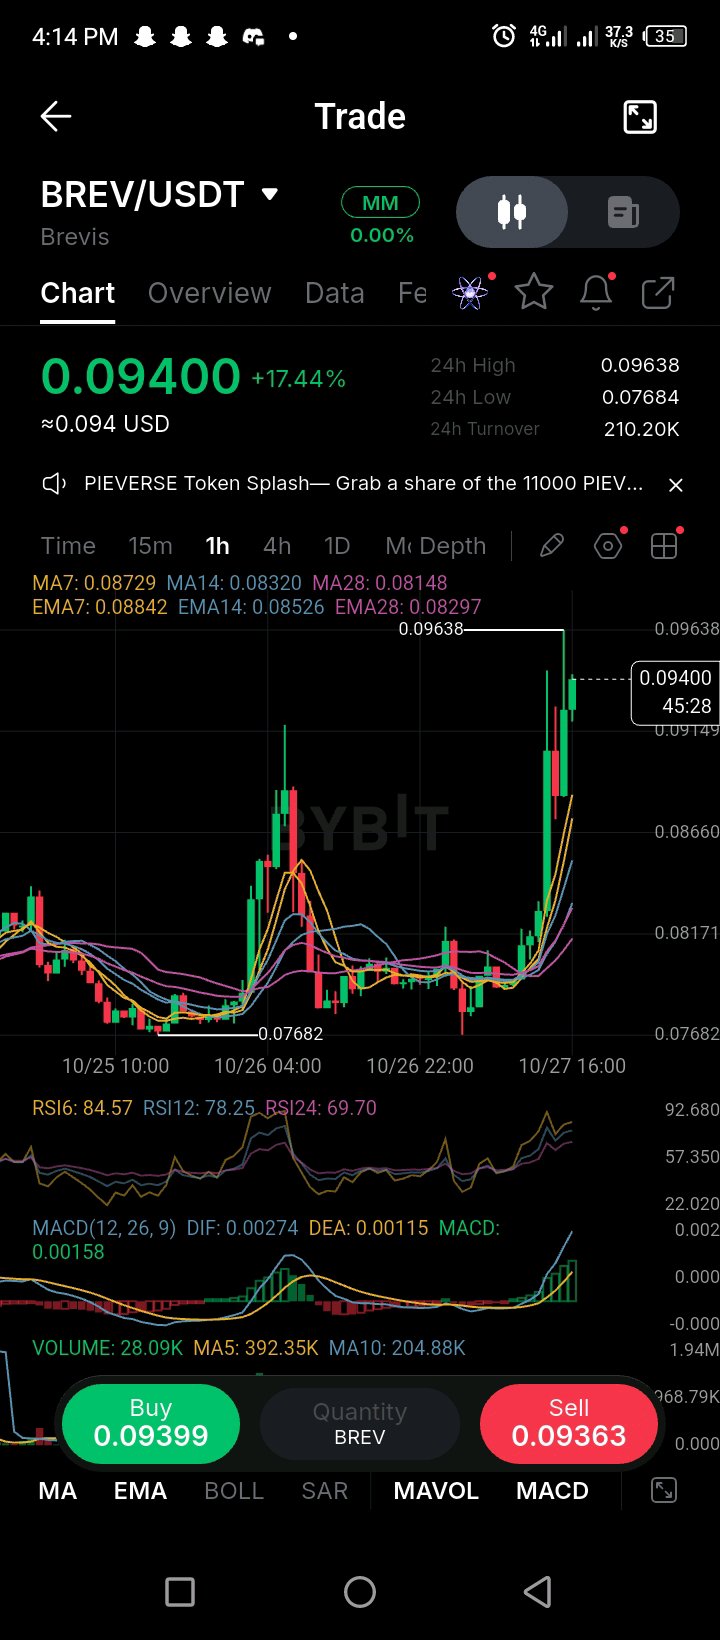
$BREVUSDT has made a strong move on the 1H chart, climbing from the $0.080 area to around $0.094. Buyers have clearly stepped in, and price is now getting close to the $0.09638 high. What caught my attention is how long BREV stayed around $0.080 before this breakout. Price was moving sideways, then buyers came in with strong candles and pushed it higher. Now we need to see whether they can keep that pressure up or if sellers will take some profit. The moving averages are looking good. MA7 is at $0.08729, MA14 at $0.08320, and MA28 at $0.08148. Price is trading above all three, while the EMAs are also sitting below the current price. That supports the bullish move we're seeing. MACD is positive too. DIF is at 0.00274, DEA at 0.00115, and the histogram is at 0.00158. Momentum is on the buyers' side right now. But there's something I wouldn't ignore: RSI6 is at 84.57, RSI12 at 78.25, and RSI24 at 69.70. That's pretty high. BREV can still push higher from here, but a pullback wouldn't surprise me after such a sharp rally. Here's what I'm watching: $0.09638 is the immediate resistance. If buyers break it and hold above it, we could see another leg up. If price gets rejected, I'll be watching $0.0915 first, followed by the $0.087–$0.083 area around the moving averages. A pullback into these levels could give a better opportunity to see how strong the buyers really are. Personally, I wouldn't rush into BREV at this price. The move has already happened, and I'd rather wait for a clean breakout or a decent retest than buy just because the candles are green. Let's see what happens around $0.09638. That's the level to watch now. Risk Disclosure: Always DYOR. #WSOT2026 #IMPACTbyTrade #AnthropicS1Filing #MyByXTake #MidtermsMarketWatch
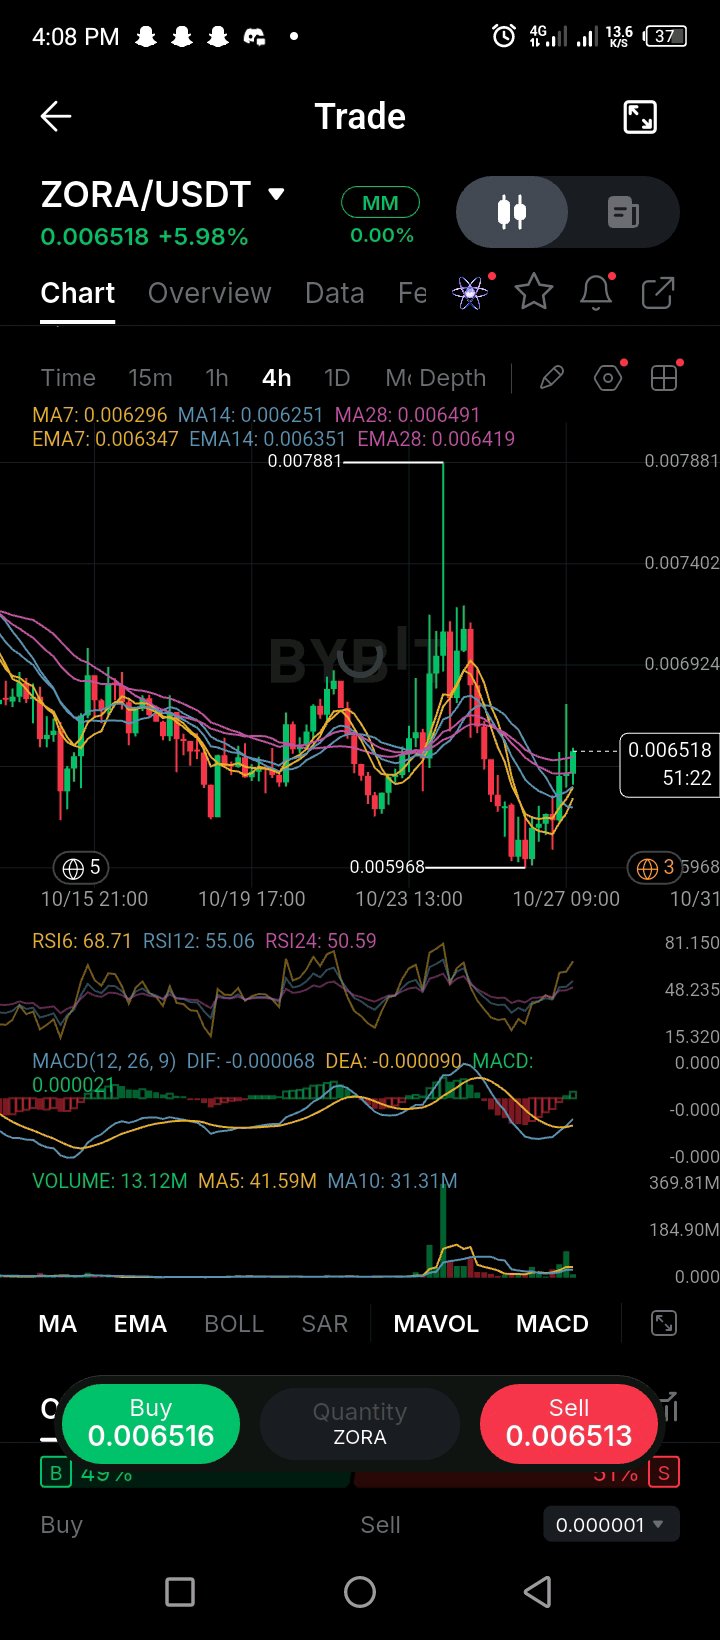
$ZORAUSDT is up almost 6% and trading around $0.006518 on the 4H chart. Looking at the chart, price dropped to $0.005968 before buyers started pushing it back up. We saw a big rally earlier that took ZORA to $0.007881, but sellers wiped out most of that move. Now price is trying to recover, and I'm watching to see if this time buyers can hold their ground. Price is back above the short-term moving averages. MA7 is at $0.006296, MA14 at $0.006251, and MA28 at $0.006491. That's a decent start, but I still want to see what happens around $0.0069 because price struggled around that area before. RSI6 is at 68.71, RSI12 at 55.06, and RSI24 at 50.59. Short-term momentum is picking up, and MACD is starting to turn as well. The histogram has moved into positive territory, which is another encouraging sign. One thing I'm watching, though, is volume. The previous pump came with a much bigger volume spike. This recovery hasn't seen the same level of activity yet, so I'd like to see buyers put in more effort if they're serious about pushing higher. For now, $0.0069 is the first level I'm watching, followed by $0.0074. If buyers manage to clear those areas, the previous high at $0.007881 comes back into focus. If price turns down again, I'll be watching $0.0063 for support. The $0.005968 low is still important too. ZORA is looking better than it did near the lows, but I'm not calling a full reversal yet. Let's see if buyers can keep this going instead of giving the move back. Risk Disclosure: Always DYOR. #WSOT2026 #AnthropicS1Filing #IMPACTbyTrade #MyByXTake #MidtermsMarketWatch
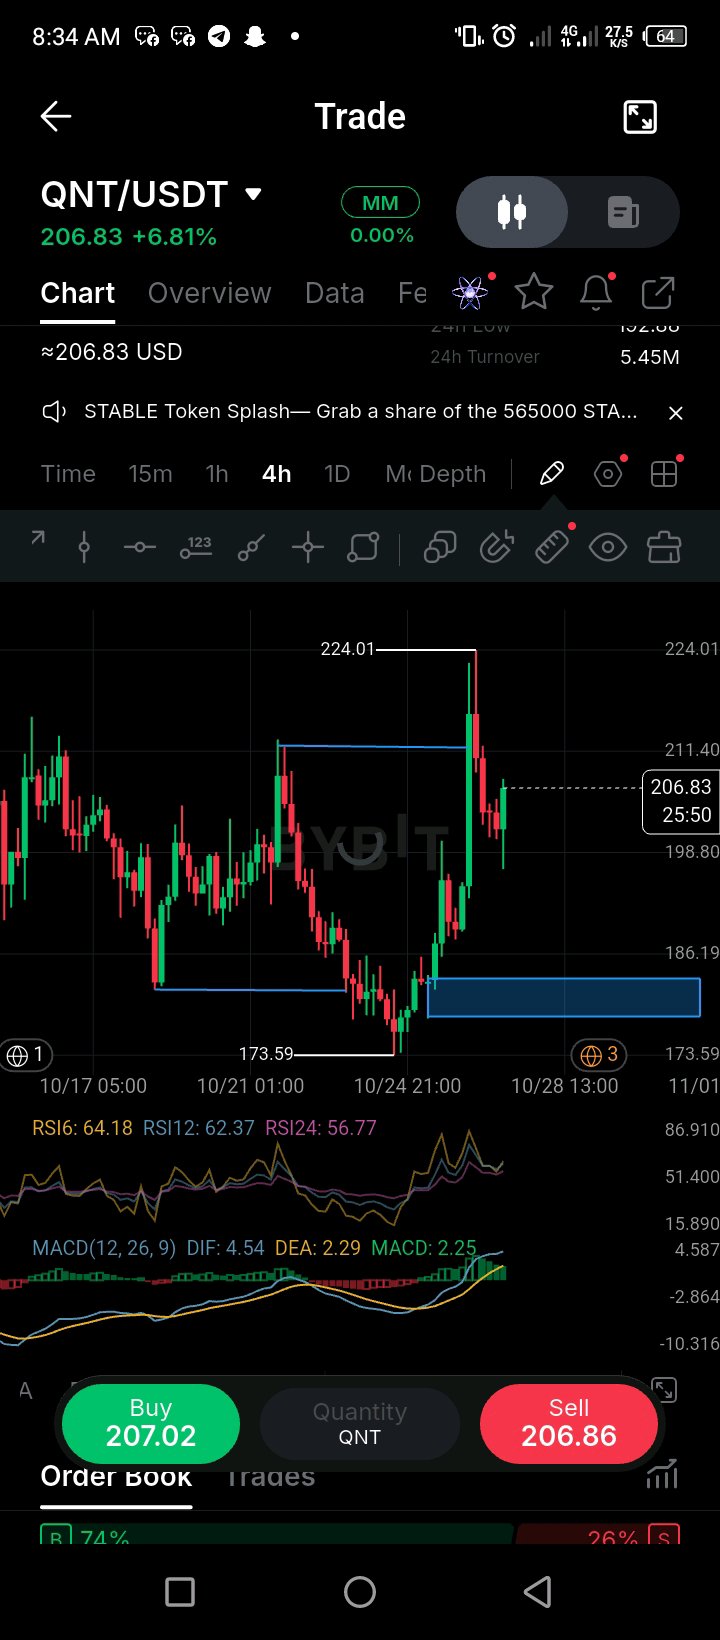
$QNTUSDT has been showing some interesting price action on the 4H chart. After spending days moving lower, price finally found buyers around $173.59 and started pushing back up. We then saw a strong rally that took QNT all the way to $224.01 before sellers stepped in. Price is currently around $206.83, up 6.81%. Even after the rejection from $224, buyers are still trying to hold the recovery. For me, the interesting part is how the market has moved from making lower prices to showing a strong bullish reaction. It looks like the direction could be changing, but I still want to see how price behaves before calling the reversal confirmed. Looking at the indicators, RSI6 is at 64.18, RSI12 at 62.37, and RSI24 at 56.77. All three are above 50, which tells me bullish momentum is still present. MACD is also positive, with DIF at 4.54, DEA at 2.29, and the histogram at 2.25. Momentum has cooled a little since the rejection, but buyers haven't completely lost control. Now, I'm not interested in chasing QNT at the current price after such a sharp move. I've marked out a 4H order block around $178–$183, and that's the zone I'm keeping my eyes on. The strong move up from the lower part of the chart makes this area worth watching for a possible retest. My plan is simple: let price come back to the OB and watch for confirmation. I want to see how the candles react inside the zone and whether buyers step in again. If the reaction is strong and the structure supports it, that could give us a setup worth considering. If QNT doesn't return to the zone and continues pushing higher, I'll let it go. There's no point forcing an entry just because the market is moving. And if price breaks below the OB without a convincing reaction, I'll reassess the idea rather than assume the zone will hold. For now, the shift from the previous downtrend is what has my attention. The next move matters, so I'll be patient and let the market show its hand. Let's see if QNT comes back to our zone and gives us a clean setup. Risk Disclosure: Always DYOR. #WSOT2026 #AnthropicS1Filing #IMPACTbyTrade #MyByXTake #MidtermsMarketWatch
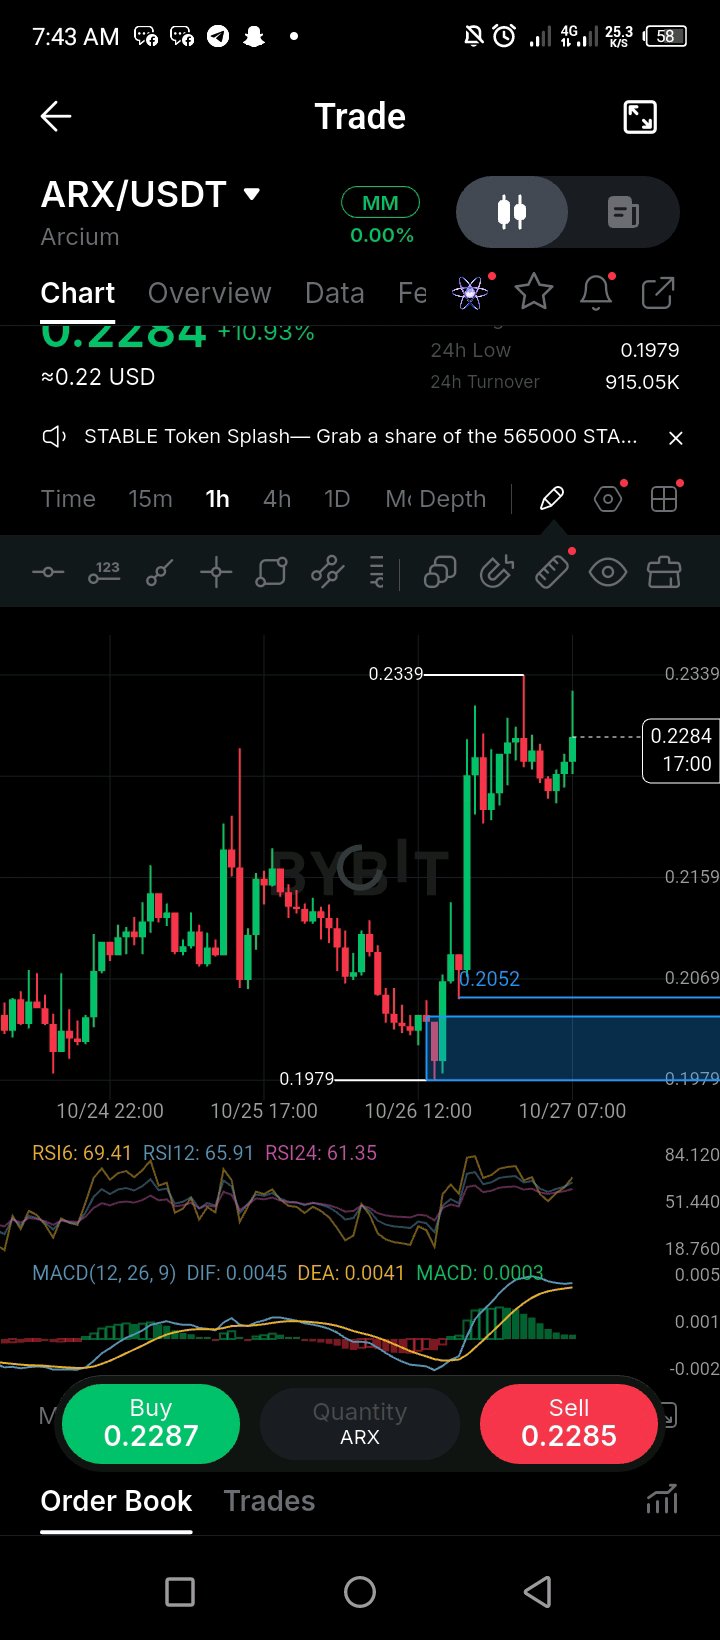
$ARXUSDT has been moving nicely, but I'm more interested in what happens next than chasing the current price. Price is around $0.2284 after bouncing from $0.1979 and pushing up to $0.2339. That was a strong move, and now price is consolidating near the highs. I've marked out my 1H order block around $0.198–$0.205, and I'm keeping an eye on it for a possible setup. The zone was followed by a strong bullish move, which is why it has my attention. Price has moved well away from it, so I'm waiting to see whether we get a retracement back into the area. RSI6 is at 69.41, RSI12 at 65.91, and RSI24 at 61.35. Buyers still have momentum, although the shorter RSI is getting close to overbought. MACD is positive too, with DIF at 0.0045 and DEA at 0.0041, but the histogram is getting smaller. That suggests the buying momentum may be slowing down a little. For now, I'm not interested in entering just because ARX has pumped. If price comes back to the 1H OB, I'll watch how it reacts and look for confirmation before considering a trade. If the zone holds and buyers step in again, there could be an opportunity. If price breaks through it, I'll reassess rather than force an entry. The OB is the area I'm watching, and the plan is to wait for price to come to me. Let's see if ARX gives us the setup. Risk Disclosure: Always DYOR. #WSOT2026 #IMPACTbyTrade #MidtermsMarketWatch #FOMCRateDecision
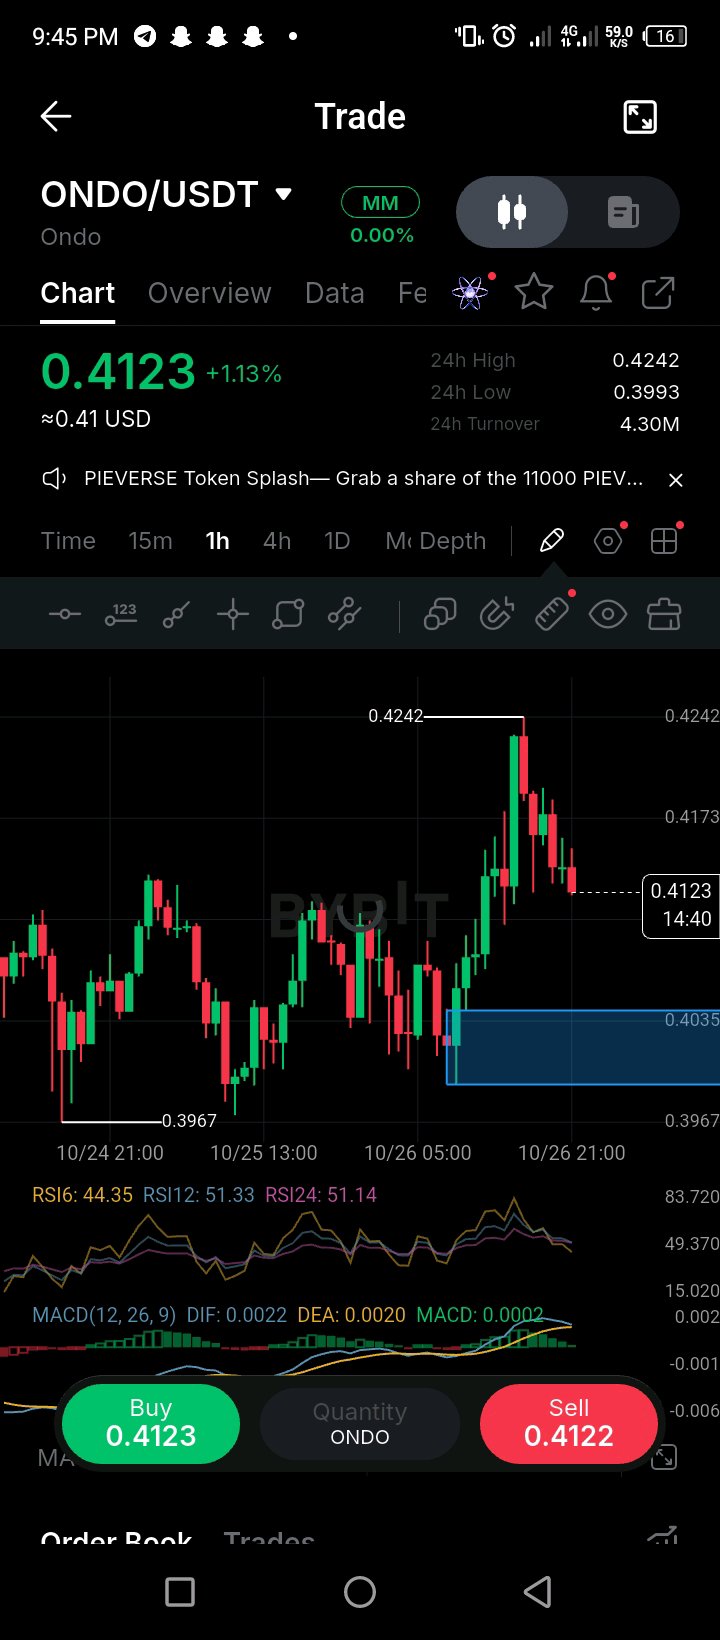
ONDO Is Pulling Back Into a Zone I'm Watching 👀 $ONDOUSDT is trading around $0.4123 on the 1H chart after getting rejected near $0.4242. Buyers pushed price up pretty hard, but sellers have started stepping in, and we're seeing a pullback. The area I'm keeping an eye on is the blue 1H order block around $0.400–$0.4035. Price is still trading above it, so I'm watching to see how it reacts if the pullback continues. RSI6 is at 44.35, while RSI12 and RSI24 are both around 51. That tells me the short-term momentum has cooled off, even though the broader picture on this chart hasn't completely turned bearish. MACD is also losing some steam. DIF is at 0.0022 and DEA at 0.0020, with the histogram still slightly positive at 0.0002. Momentum is there, but the gap is getting smaller. If ONDO comes into the order block and buyers defend it, I'd watch for a reaction back toward $0.4173, then a possible retest of $0.4242. But if price breaks through the zone and fails to reclaim it, I'd hold off on calling it a clean bounce. I want to see how price behaves inside the OB first. For now, I'm letting price come to the zone instead of chasing it up here. Let's see what happens when ONDO reaches the area. Risk Disclosure: Always DYOR. #WSOT2026 #IMPACTbyTrade #MidtermsMarketWatch #FOMCRateDecision
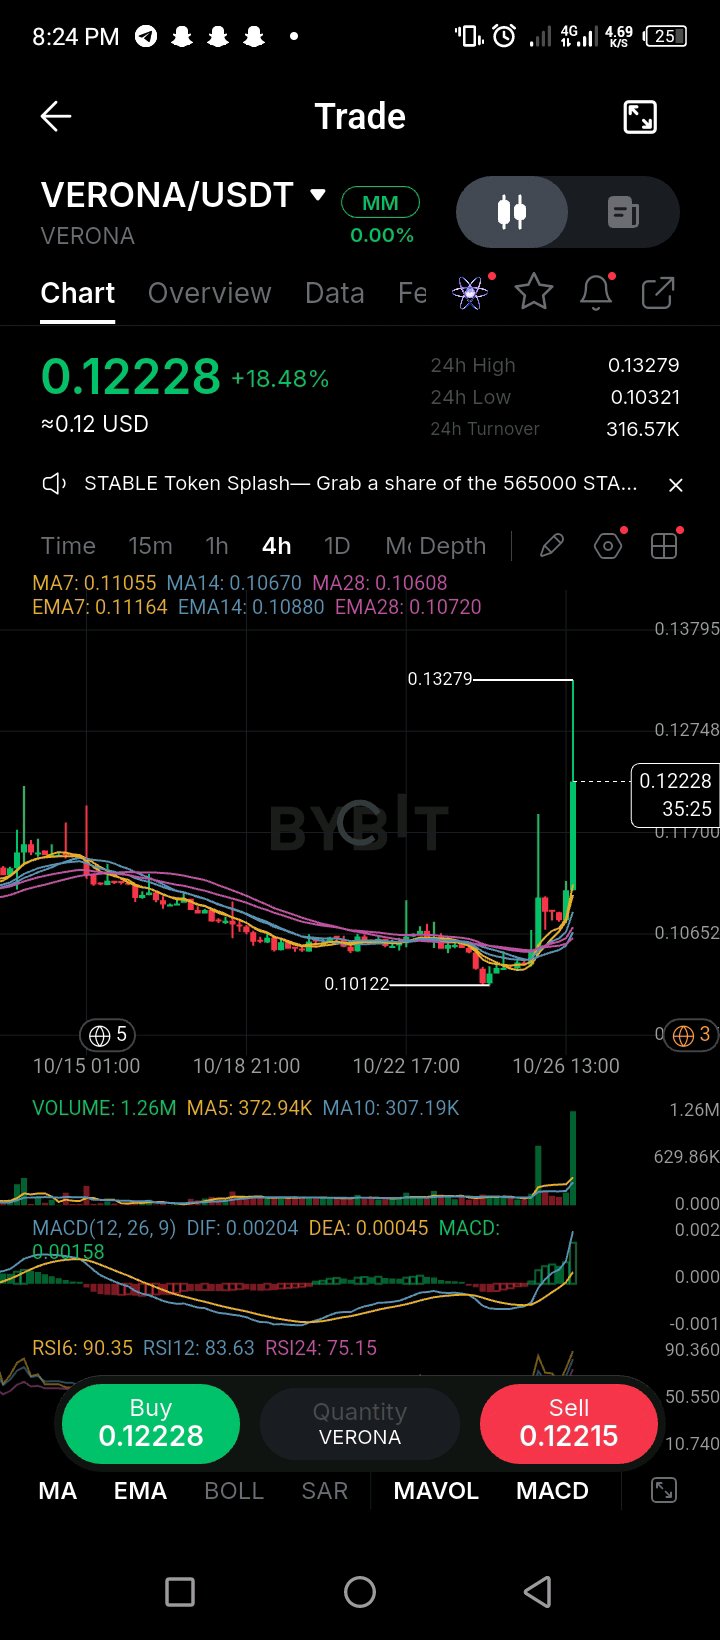
VERONA Is Making a Big Move 📈 $VERONAUSDT is up 18.48%, trading around $0.12228 on the 4H chart. What caught my attention is how quickly price has moved after spending days in a steady downtrend. For most of the chart, sellers were in control, pushing VERONA from higher levels down to around $0.10122. Price then started stabilizing, and now buyers have come in with two strong green candles. Volume has picked up significantly, so this isn't just a small move happening on low activity. The moving averages are finally turning upward. MA7 is at $0.11055, MA14 at $0.10670, and MA28 at $0.10608. Price is trading well above them, which is a positive change from the previous trend. MACD has also turned bullish, with DIF at 0.00204 and DEA at 0.00045. The histogram is positive at 0.00158, showing that upward momentum has increased. But here's where I'd be careful. RSI6 is at 90.35, RSI12 at 83.63, and RSI24 at 75.15. That's a very strong move in a short period, and some profit-taking wouldn't be surprising from here. VERONA has already reached $0.13279 today, making that the main resistance I'm watching. If buyers manage to break above it, there could be room for another push. If price pulls back, I'll be watching $0.117 first, followed by the $0.111–$0.107 area around the moving averages. After a move this sharp, I wouldn't rush to buy at the current price. I'd rather see whether VERONA can hold its gains or give a better entry on a retest. The momentum has clearly shifted, but the next move will tell us whether buyers can keep control. Risk Disclosure: Always DYOR. #WSOT2026 #IMPACTbyTrade #AnthropicS1Filing #FOMCRateDecision
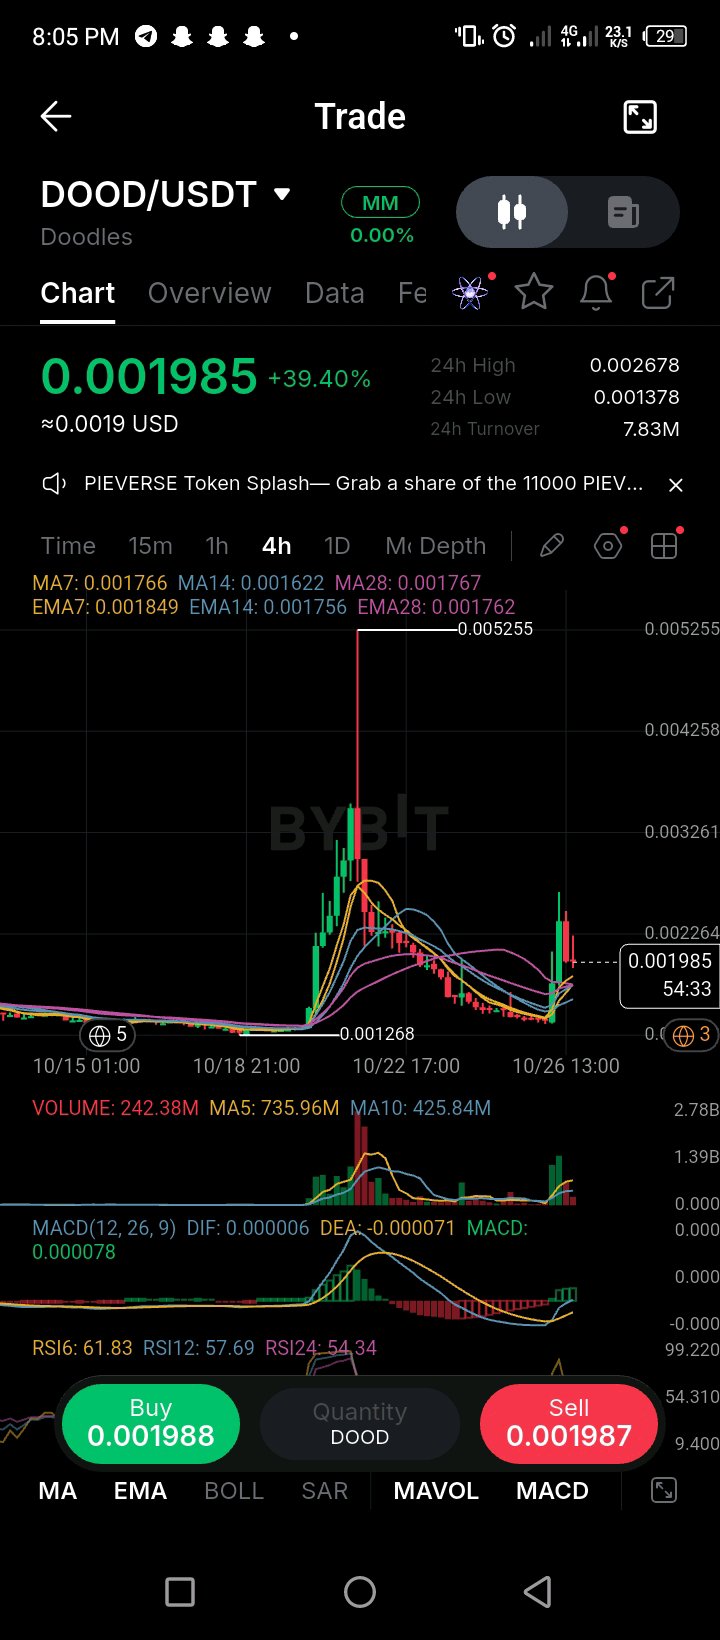
$DOODUSDT has made a big move today, up 39.40% and trading around $0.001985 on the 4H chart. Price spent days moving sideways near $0.0014 before buyers finally stepped in. Volume picked up during the rally, and price pushed above the moving averages. MA7 is at $0.001766, MA14 at $0.001622, and MA28 at $0.001767. MACD has also turned positive, while RSI readings are sitting above 50. So the momentum has definitely improved. But looking at the bigger picture, DOOD has made a similar move before. The last big spike reached $0.005255, only for price to drop back down afterward. I'm not saying the same thing will happen again, but it's a reason not to get carried away by one big candle. Right now, I'm watching $0.0022. If buyers can push through that level and hold, we could see another move up. If price starts pulling back, $0.00185 is the first area I'm keeping an eye on, followed by the $0.00175–$0.00165 zone. The rally looks promising, but I want to see what happens next before calling it a proper recovery. A strong move is one thing; holding those gains is another. Risk Disclosure: Always DYOR. #WSOT2026 #IMPACTbyTrade #AnthropicS1Filing #MyByXTake
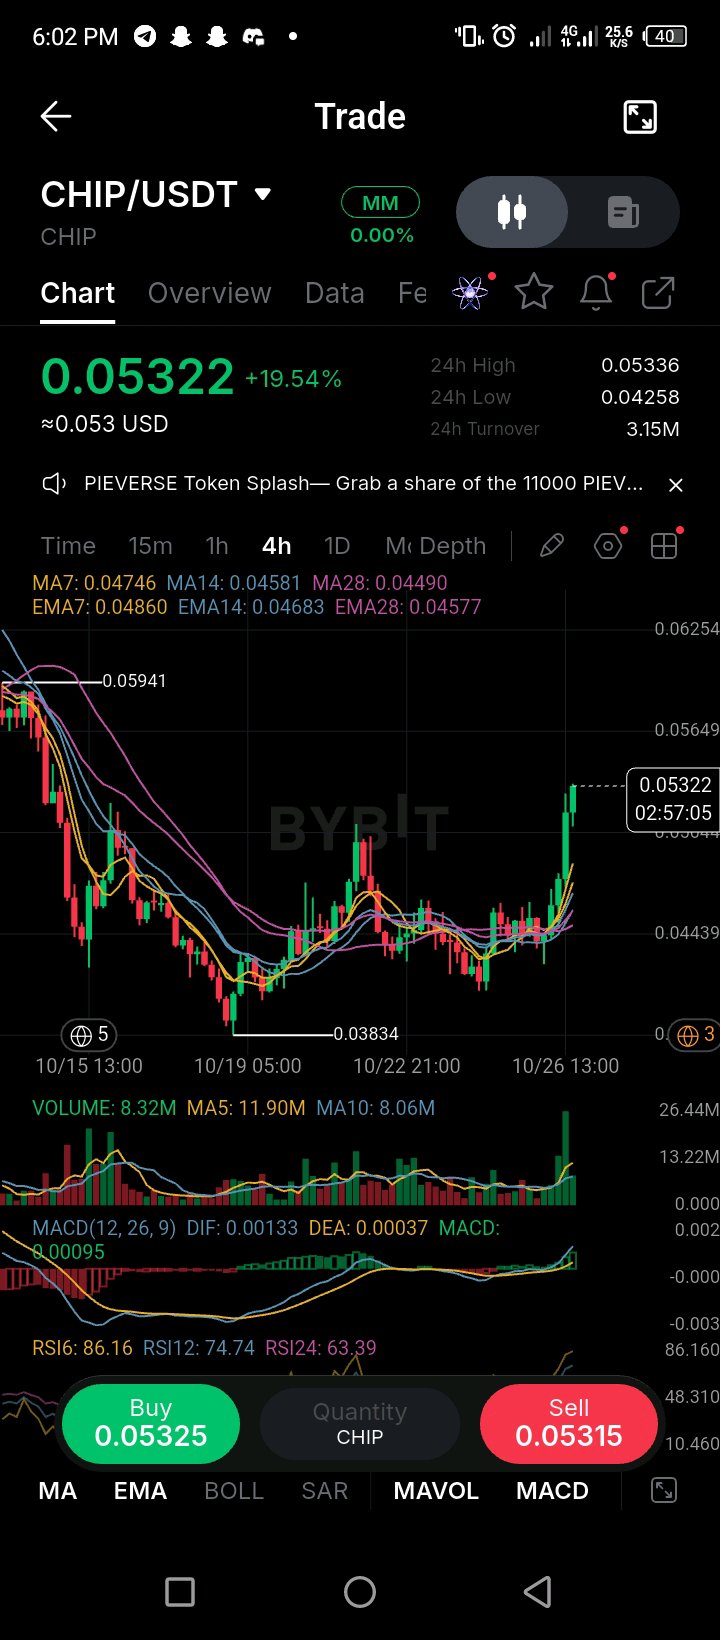
CHIP Is Up Nearly 20% Buyers Are Back 👀
$CHIPUSDT is having a strong session. Price is around $0.05322, up 19.54%, and the 4H chart is looking very different from the past few days. CHIP spent quite a while moving sideways around $0.043–$0.045 after dropping from much higher levels. Now buyers have stepped in with a big green candle, pushing price above the recent range. The moving averages have turned in price's favor. MA7 is at $0.04746, MA14 at $0.04581, and MA28 at $0.04490. The EMAs are also sitting below the current price, which supports the strength of this move. Volume has picked up alongside the breakout, and MACD is bullish. DIF is at 0.00133 against DEA at 0.00037, with the histogram positive at 0.00095. So far, momentum is clearly on the buyers' side. But there's one thing I wouldn't ignore: RSI6 is at 86.16, while RSI12 is 74.74. That's pretty hot. CHIP can still push higher, but after a move this sharp, some profit-taking wouldn't surprise me. The 24H high at $0.05336 is the first level I'm watching. If price breaks through and holds, buyers may try to extend the rally. If it gets rejected, I'll be watching $0.050 first, then the $0.0475–$0.0458 area around the moving averages. For me, the important thing now is whether CHIP can hold above its breakout zone. I wouldn't rush to buy after a nearly 20% move. Let the next candles show whether buyers are still in control. Risk Disclosure: Always DYOR. #WSOT2026 #IMPACTbyTrade #AnthropicS1Filing #MidtermsMarketWatch
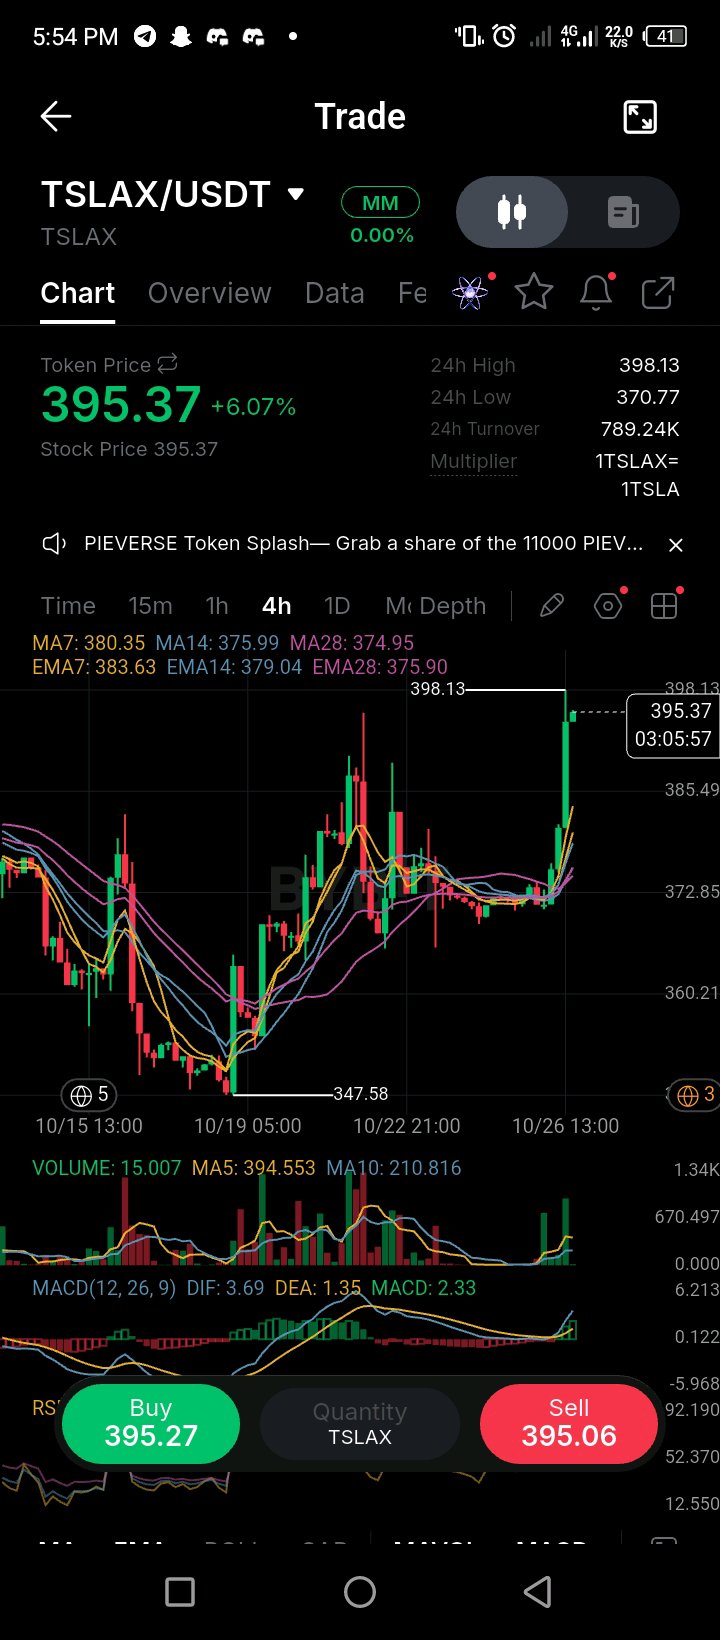
$TSLAXUSDT has been quiet for a while, moving around the $372–375 zone, but buyers are starting to wake up. Price is now at $395.37, up 6.07% on the 4H chart. That last candle brought some serious momentum, and volume has picked up as well. The question now is whether buyers can keep pushing or if we'll see a pullback after this move. Looking at the moving averages, price is trading above MA7 at 380.35, MA14 at 375.99, and MA28 at 374.95. The EMAs are also pointing in the same direction, which supports the current bullish momentum. MACD is positive too, with DIF at 3.69 and DEA at 1.35. But I wouldn't call it a confirmed breakout just yet. Price is approaching $398.13, the current 24-hour high, and that's the level I'm watching closely. If buyers manage to break above it and hold, we could see more upside. If price gets rejected, things could cool off pretty quickly. On a pullback, I'll be watching the $385–380 area first. If that doesn't hold, the old consolidation zone around $376–373 becomes important again. Personally, I wouldn't rush to enter after a candle this strong. Sometimes the better opportunity comes when price comes back to test a level it just broke through. For now, I'm watching how the next few candles develop. Risk Disclosure: Always DYOR. #WSOT2026 #IMPACTbyTrade #AnthropicS1Filing #MyByXTake
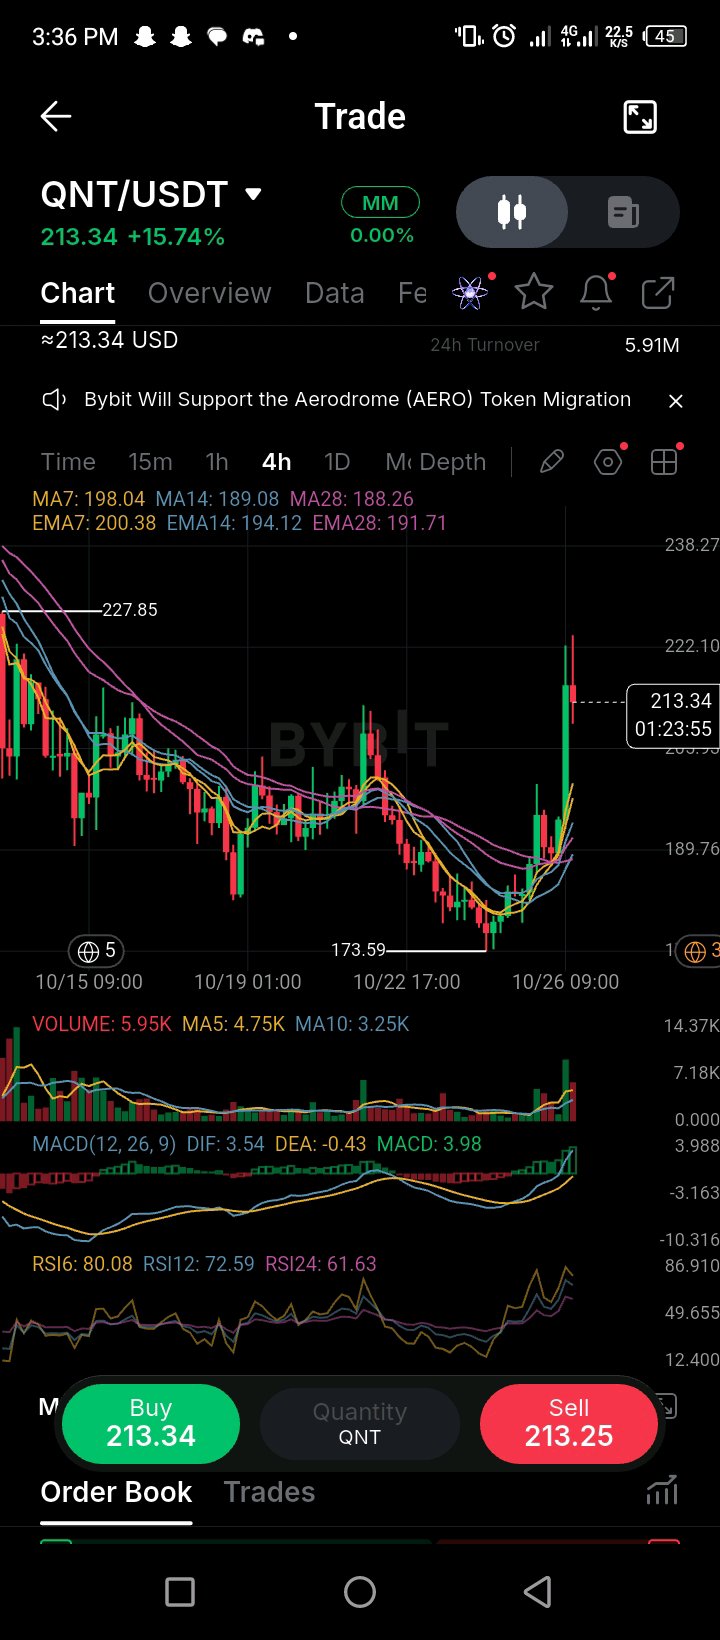
QNT Is Picking Up Again, Let's See How Far It Goes 👀 $QNTUSDT is up 15.74% and trading around $213.34 on the 4H chart. The move from $173.59 has been impressive, and buyers are finally showing some strength after the recent selling pressure. What I like is how price has pushed back above the moving averages. The MA7 is around $198.04, MA14 at $189.08, and MA28 at $188.26. Price is now comfortably above them, which tells me the short-term momentum has shifted in favor of the buyers. Volume has also picked up during this move, and the MACD is looking bullish. So there's some strength behind the recovery. But there's still something I want to see before getting too excited. $QNT pushed toward $222.10 but couldn't hold there and pulled back. That's the level I'm watching now. If buyers come back and break through it, we could see another push toward $227.85. On the other hand, if price struggles around $222 again, I wouldn't be surprised to see a pullback. The $205–$200 area is where I'd look for buyers to step in. If that zone holds, it could give price a chance to gather strength for another attempt higher. RSI6 is around 80, so the market is getting hot in the short term. That doesn't mean the rally has to end here, but after such a strong move, some profit-taking wouldn't surprise me. Personally, I wouldn't chase $QNT after a 15% move. I'd rather see whether it can hold its gains or give a better entry on a pullback. The recovery looks good so far. Now let's see if buyers can take out $222.10. Risk Disclosure: Always DYOR. Not financial advice. #WSOT2026 #IMPACTbyTrade #MidtermsMarketWatch #FOMCRateDecision
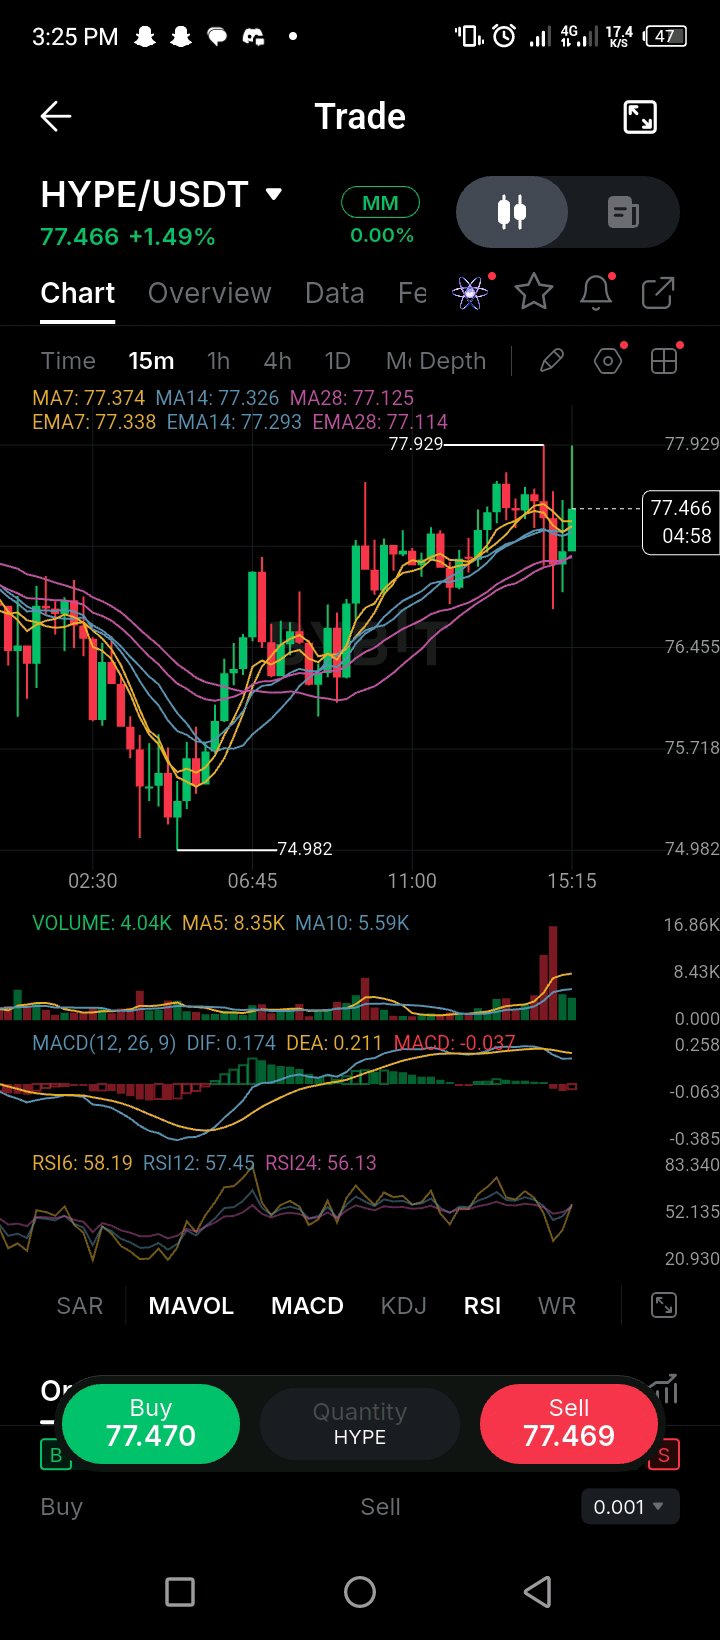
HYPE Is Holding Strong, But Can Buyers Push Higher? 👀 $HYPEUSDT is trading around $77.466 on the 15-minute chart, up 1.49%. After dropping to $74.982, buyers stepped in and pushed price higher, forming a series of higher lows. The short-term structure is still leaning bullish, but we're approaching a level where sellers could fight back. Looking at the moving averages, price is sitting above the MA7 at $77.374, MA14 at $77.326, and MA28 at $77.125. The EMAs show a similar picture, with the shorter averages above the longer ones. That's encouraging for buyers, although I want to see price hold above this cluster instead of slipping back below it. Now, the important level is $77.929. That's the recent high, and price has already shown some hesitation around this area. A clean break above it could open the door for another push higher. If buyers fail to break through, we could see a pullback toward $77.30–$77.10, where the moving averages may offer support. Volume picked up during the recent sell-off and rebound, so there's clearly been some activity around these levels. However, the latest volume readings are lower than the MA5 volume average, meaning I'd like to see stronger buying volume behind any breakout. The MACD is worth watching too. The DIF is at 0.174, below the DEA at 0.211, with a slightly negative histogram at -0.037. This tells me bullish momentum has cooled in the short term, even though price is still holding up. RSI readings are between 56 and 58, which keeps momentum on the bullish side without being overbought. Buyers still have room to push, but they need to prove themselves at resistance. My plan? I'm watching $77.929 closely. A strong breakout with volume would favor continuation. If price loses the $77.10 area, I'd be more cautious and watch how it reacts around $76.45. No need to chase the move here. Let the next candle show its hand. Risk Disclosure: Always DYOR. Not financial advice. #IMPACTbyTrade #WSOT2026 #MidtermsMarketWatch