Smangoge
Suleiman Mohammed
⚡ TESLA (TSLA) SITS AT 401.79 USDT — FALLING (-0.42%) ⚡ MARKET SUMMARY TSLA/USDT is consolidating at 401.79 USDT (1D timeframe) following a powerful rally to 412.97 USDT (24h Range: 397.89–412.97 USDT; 24h Turnover: 18.84M USDT). TECHNICAL OBSERVATION Price is holding high ground well above MA7 (384.96 USDT). The overall daily trend is strongly bullish-aligned (MA7 > MA28 at 375.05 > MA14 at 374.88 USDT), with the current red candle acting as a natural pullback after testing major swing resistance at 412.97 USDT. KEY LEVELS & TRADE SETUP Resistance: 412.97 (24h High / Swing Peak), 425.00 (Macro Target) Support: 397.89 (24h Low Base), 384.96 (MA7 Dynamic Support), 375.05 (MA28 / Major Base Floor) Bullish Reclaim Target: A 1D close above 413.00 USDT clears overhead supply toward 425.00+ USDT. Bearish Breakdown: A 1D close below 397.89 USDT risks a deeper pullback toward dynamic MA7 support at 384.96 USDT. 3.0R TRADE PLAN Strategy: Long on local pullback retest Entry: 386.00 USDT Take-Profit (TP): 422.00 USDT (+$36.00 / TSLA) Stop-Loss (SL): 374.00 USDT (-$12.00 / TSLA) Risk/Reward: 3.0R (Max 10x cross leverage; 1–2% account risk)$TSLAXUSDT #ByXIMPACT
⚡ ONDO FINANCE (ONDO) SITS AT 0.4150 USDC — RISING (+0.05%) ⚡ Ondo Finance (ONDOUSDC) is trading at 0.4150 USDC on the Daily (1D) timeframe, showing minimal positive movement (+0.05% daily change) while attempting to build a baseline above its major structural floor at 0.3964 USDC following a macro correction from 0.6066 USDC. MARKET SITUATION Price is currently consolidating near 0.4150 USDC after bouncing off structural base support (24h Low: 0.4117 USDC / 24h High: 0.4232 USDC). 24h Turnover stands at 10.21K USDC. MY OBSERVATION Price is testing immediate dynamic resistance at MA7 (0.4158 USDC). Medium-term resistance sits above at MA14 (0.4326 USDC) and major macro resistance at MA28 (0.4592 USDC). Moving averages are stacked in a downward bearish trend alignment (MA7 < MA14 < MA28). TECHNICAL ANALYSIS Moving Averages: MA7 (0.4158 USDC) is currently acting as immediate overhead resistance. A clean daily close above MA7 and MA14 (0.4326 USDC) is required to trigger a trend reversal. Candlestick Structure: Recent daily candles show small bodies compressing above the 0.3964 USDC double-bottom support, indicating seller exhaustion at lower levels. KEY LEVELS Resistance: 0.4158 USDC (MA7 Resistance), 0.4232 USDC (24h High Target), 0.4326 USDC (MA14 Resistance), 0.4592 USDC (MA28 Major Dynamic Target), 0.6066 USDC (Swing High Peak) Support: 0.4117 USDC (24h Low Base Support), 0.3964 USDC (Major Structural Floor), 0.3500 USDC (Macro Support Zone) BULLISH AND BEARISH SCENARIOS Bullish Scenario: A decisive daily candle close above MA14 (0.4326 USDC) confirms local bottoming and opens a macro retest toward MA28 (0.4592 USDC) and 0.4885 USDC. Bearish Scenario: Rejection at MA7/MA14 followed by a breakdown below 0.3964 USDC triggers downside continuation toward lower demand zones near 0.3500 USDC. ENTRY, TAKE-PROFIT AND INVALIDATION LEVELS Execution Strategy: Long retest on local support Entry: 0.4050 USDC Take-Profit (TP): 0.4650 USDC ($0.0600 Gain per ONDO) Invalidation / Stop-Loss (SL): 0.3850 USDC ($0.0200 Risk per ONDO) MOMENTUM AND VOLUME Volume indicator (MAVOL) shows current daily volume at 21.78K ONDO relative to MA5 volume of 152.09K and MA10 volume of 105.45K. Low volume during bottom consolidation indicates that buyers must step in with expanding buy volume above MA5 to break overhead MA resistance. RISK MANAGEMENT Given the prevailing daily downtrend structure, keep leverage controlled (max 10x cross). Risk strictly 1–2% of trading account equity per position.$ONDOUSDT #ByXIMPACT

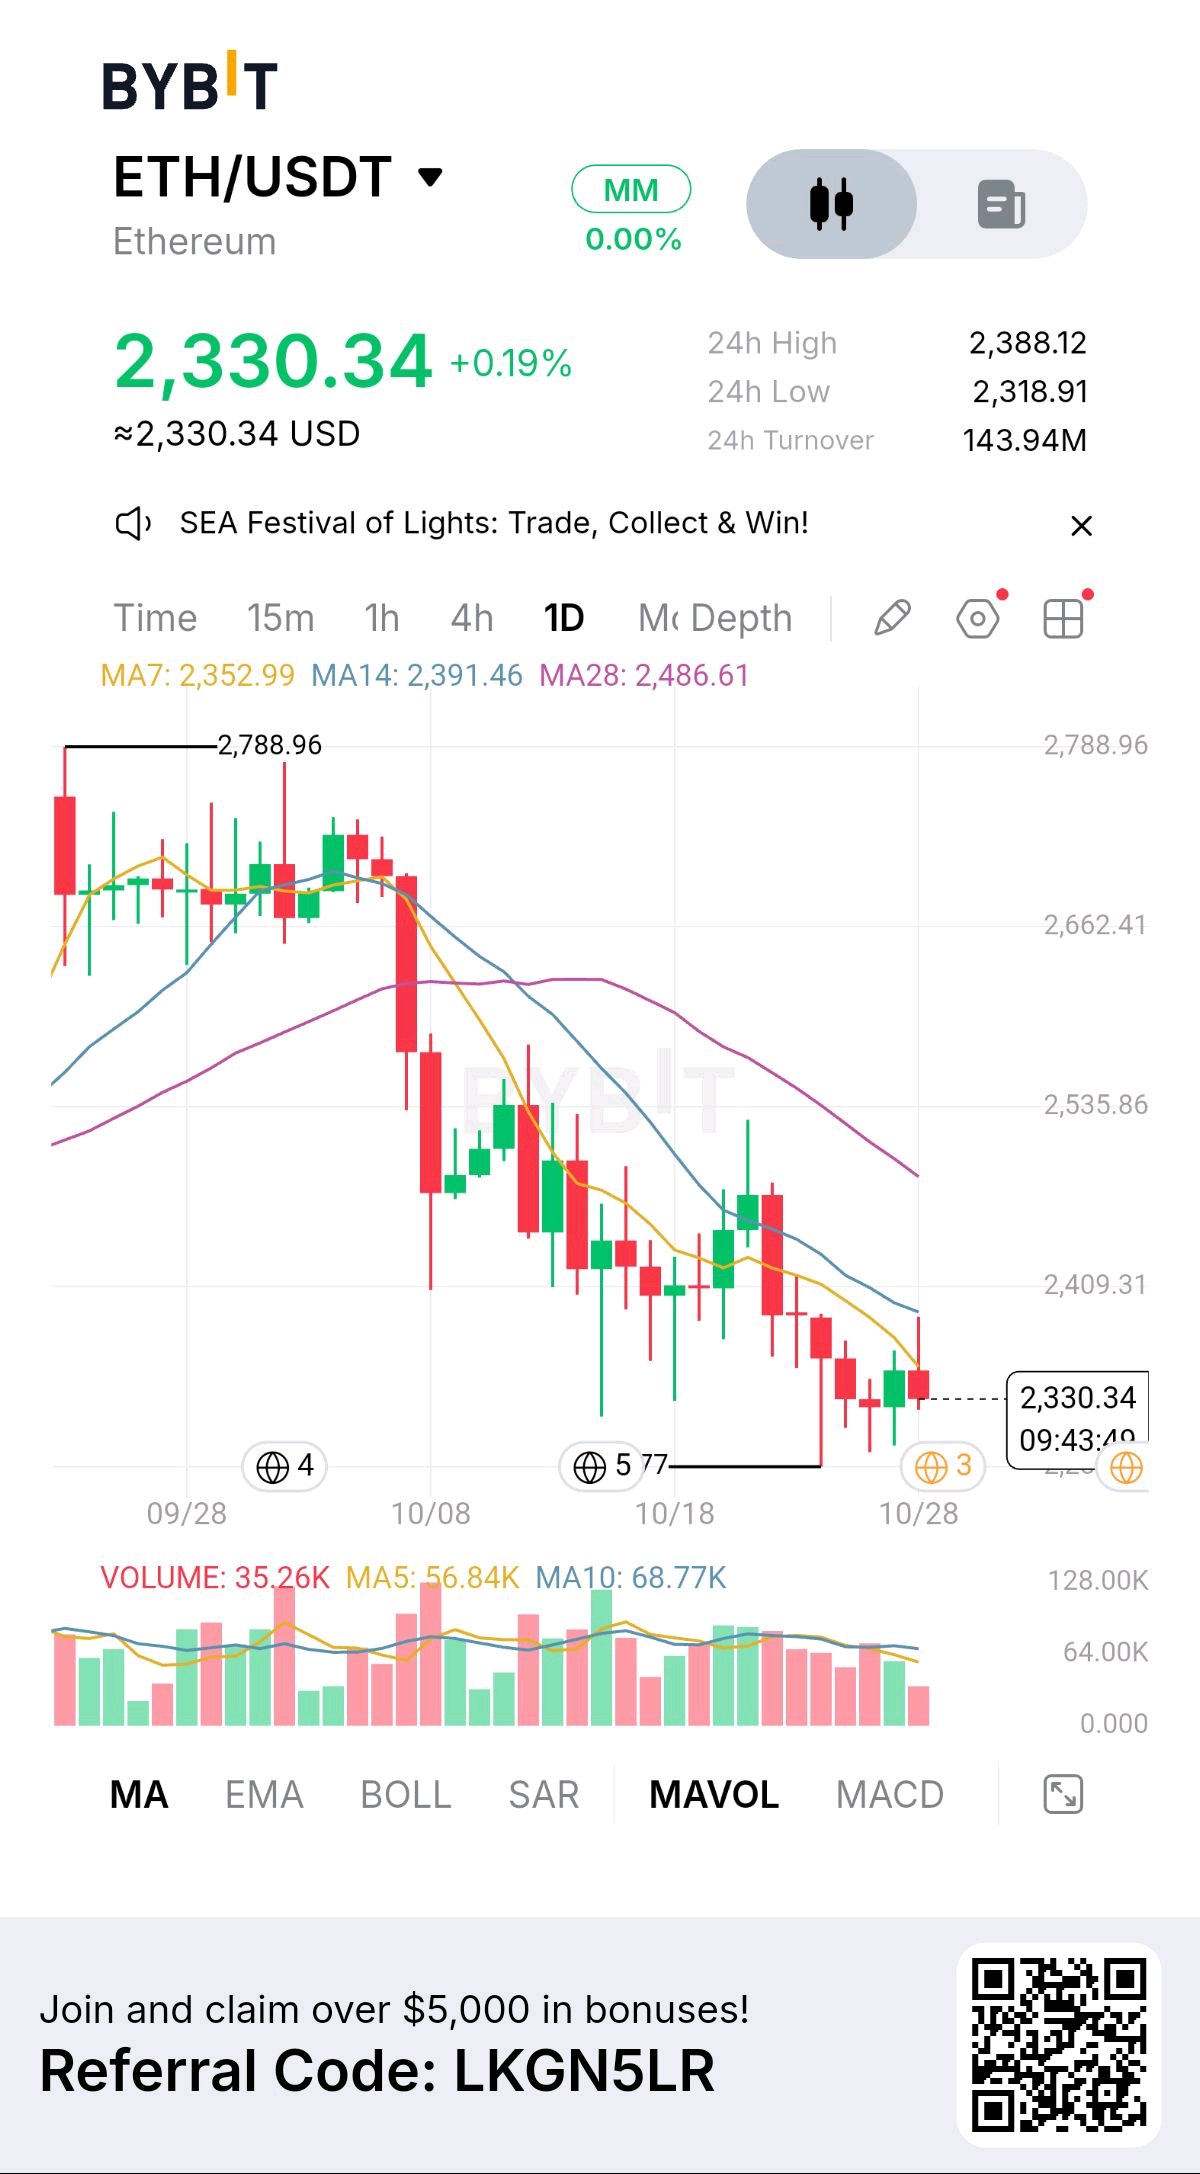
ETH ATTEMPTS BASE BUILDING BELOW OVERHEAD MOVING AVERAGES Price action is trying to hold local support, but declining moving averages keep pushing downward. One of those has to give. ETHUSDT | 1D | 2,330.34 (+0.19%) Bias: fragile below 2,352.99 (MA7), with no structural reversal until a daily close clears MA14 at 2,391.46. Market view A small green daily print is trying to stabilize after a prolonged leg down from the 2,788.96 peak. Price remains pinned underneath all major short-term moving averages, with the 24h low holding at 2,318.91 to provide temporary support. That is the constructive part. The weaker part: MA7 (2,352.99), MA14 (2,391.46), and MA28 (2,486.61) are all sloping downward in strong bearish alignment, keeping selling pressure active on every intraday bounce. Technical evidence Moving averages remain stacked bearishly directly overhead, showing tight compression that indicates ongoing range-bound consolidation before the next directional break. Volume and turnover 24h turnover stands at 143.94M, reflecting subdued volume as market participants wait for confirmation of either a breakout above MA7 or a breakdown below recent swing support. $ETHUSDT #ByXIMPACT
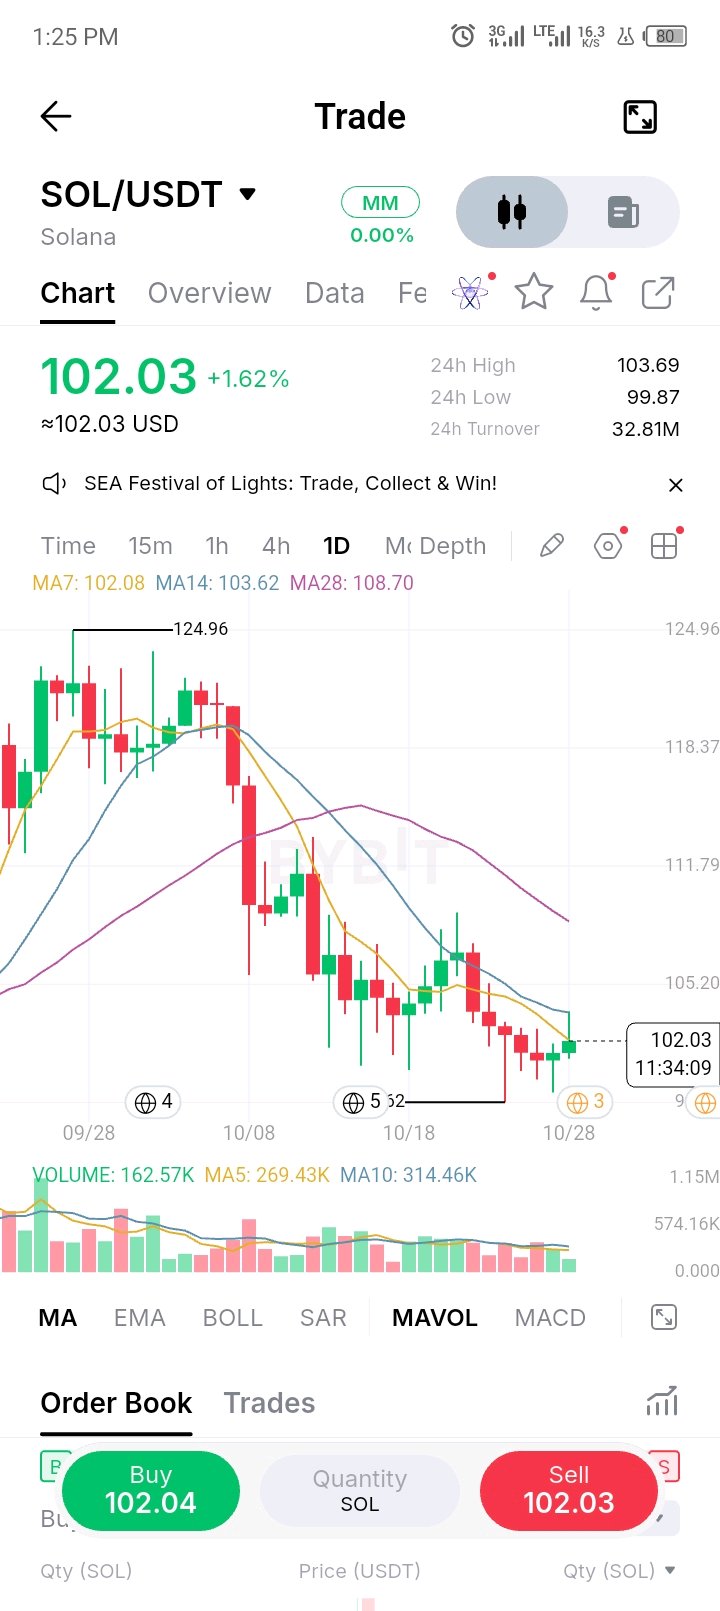
SOL PUSHES AGAINST MA7 AS DOWNTREND PRESSURE SLOWS Price keeps clawing upward from recent lows, but overhead resistance still looms. One of those has to give. SOLUSDT | 1D | 102.07 (+1.55%) Bias: constructive above 102.09 (MA7), but not a trend change until a daily close above MA14 at 103.62. Market view Two consecutive green daily prints are pushing the price back above the MA7 line, testing the immediate lower boundary of the MA14 band. The 24h low has held steady at 99.87, indicating that minor dips are attracting buyers around the key 100 level. That is the encouraging part. The weaker part: MA14 (103.62) and MA28 (108.70) are still sloping downward, and the distance to the 124.96 swing high remains significant. Technical evidence Short-term moving averages are bunching together tightly as price action hugs the baseline, signaling a consolidation phase right below key trend resistance. Volume and turnover 24h turnover stands at 32.81M, remaining stable as the market watches for a decisive breakout or rejection at the current technical barrier. $SOLUSDT #ByXIMPACT
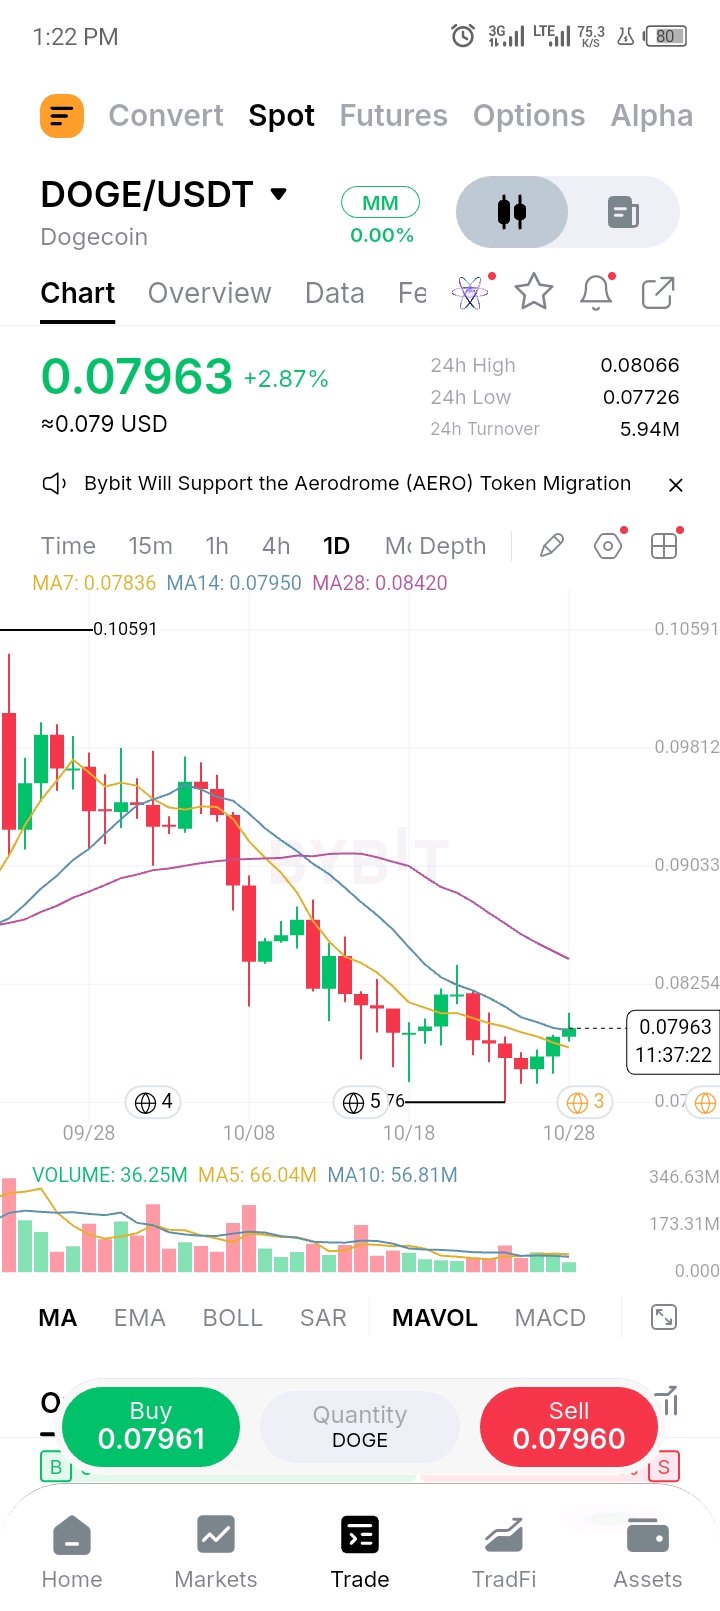
DOGE TESTS MA14 WHILE SHORT-TERM MOMENTUM ATTEMPTS A REBOUND Price is trying to claw its way back up the moving averages, but overhead resistance still looms. One of those has to give. DOGEUSDT | 1D | 0.07963 (+2.87%) Bias: constructive above 0.07836 (MA7), but not a trend shift until a daily close above MA14 at 0.07950. Market view Two consecutive green daily candles have pushed the price back above the MA7 line, testing the immediate pressure of the MA14 level. The 24h low has stepped up from 0.07726, indicating that dip-buyers are stepping in slightly earlier during minor pullbacks. That is the encouraging part. The weaker part: the MA14 and MA28 (0.08420) lines are still trending downward, showing that the broader medium-term corrective structure remains intact. Technical evidence Price action is hugging the short-term averages tightly after bouncing off recent lows near 0.077, attempting to build a local base while waiting for confirmation of a broader trend extension. Volume and turnover 24h turnover stands at 5.94M, reflecting relatively steady market participation as traders watch for a sustained close outside of the immediate MA compression zone. $DOGEUSDT #ByXIMPACT
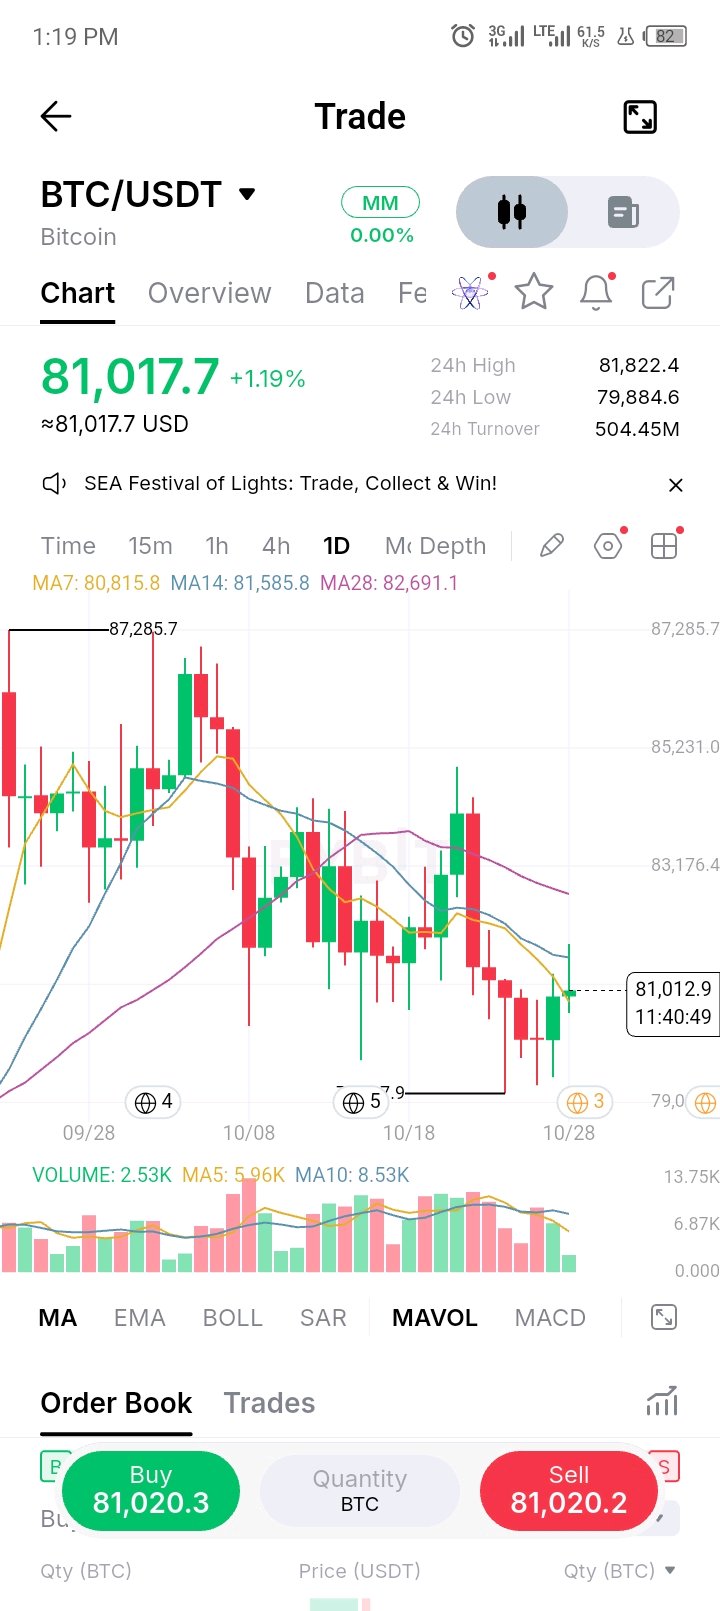
BTC is trading around $80,935.8, up roughly 1.30% in 24 hours, as buyers attempt to push the asset higher following a prolonged downtrend. The rebound is encouraging after the recent dip toward the $79,000 level, but price still needs stronger follow-through to confirm a sustained recovery and break the broader bearish structure established from the $87,285.7 high. Immediate support sits at $80,804.8–$79,884.6 (MA7 and 24h low). Holding this zone could keep the recovery alive, while a break below $79,884.6 may expose $79,000. On the upside, a move above $81,580.3–$82,688.3 (MA14 and MA28) could open the path toward $83,176.4. The key driver is physical momentum. The asset is attempting to stabilize near the $80,000 psychological level, but it remains firmly capped by the descending moving averages, keeping the broader trend bearish. Trading volume has generally subsided compared to the heavy selling pressure seen earlier in the month, suggesting a potential exhaustion of the downtrend, which supports the current bounce. However, broader market uncertainty could limit further immediate gains. Bullish scenario: $82,688.3 breakout → $83,176.4 → $85,231.0 Bearish scenario: $79,884.6 breakdown → $79,000.0 → $77,500.0 For now, the recovery is positive, but holding above $80,000 and breaking the immediate moving average resistance will be important for confirming the next move.$BTCUSDT #ByXIMPACT
XRP is trading around $1.3300, up roughly 2.28% in 24 hours, as buyers push the asset higher following a prolonged downtrend. The rebound is encouraging after the recent consolidation near the local lows, but price still needs stronger follow-through to confirm a sustained recovery and break the broader bearish structure established from the $1.6587 high. Immediate support sits at $1.3160–$1.2911 (MA14 and 24h low). Holding this zone could keep the recovery alive, while a break below $1.2911 may expose $1.2500. On the upside, a move above $1.3442–$1.3737 (24h high and MA28) could open the path toward $1.4566. The key driver is physical momentum. The asset is attempting to reverse its recent downtrend, but it remains capped by the descending MA28, which is acting as a significant overhead resistance. Trading volume has generally subsided compared to the selling pressure seen in early October, suggesting a potential exhaustion of the downtrend, which supports the current stabilization. However, broader market uncertainty could limit further immediate gains. Bullish scenario: $1.3737 breakout → $1.4566 → $1.5576 Bearish scenario: $1.2911 breakdown → $1.2500 → $1.2000 For now, the recovery is positive, but holding above $1.3100 and breaking the immediate moving average resistance will be important for confirming the next move.$XRPUSDT #ByXIMPACT

MNT is trading around $0.5322, up roughly 3.25% in 24 hours, as buyers push the asset higher following a prolonged downtrend. The rebound is encouraging after the recent consolidation near $0.5123, but price still needs stronger follow-through to confirm a sustained recovery and break the broader bearish structure established from the $0.7157 high. Immediate support sits at $0.5204–$0.5123 (MA7 and 24h low). Holding this zone could keep the recovery alive, while a break below $0.5123 may expose $0.5000. On the upside, a move above $0.5395–$0.5610 (24h high and MA28) could open the path toward $0.6085. The key driver is physical momentum. The asset is attempting to break out of a long consolidation phase, but it remains capped by the MA28, which is acting as a strong overhead resistance. Trading volume has been relatively steady without massive spikes, suggesting a gradual shift in momentum rather than a sudden surge. Expectations of broader market volatility could limit further immediate gains if the MA28 is rejected. Bullish scenario: $0.5610 breakout → $0.6085 → $0.6621 Bearish scenario: $0.5123 breakdown → $0.5000 → $0.4800 For now, the recovery is positive, but holding above $0.5200 and breaking the immediate moving average resistance will be important for confirming the next move.$MNTUSDT #ByXIMPACT

SOL is trading around $101.14, up roughly 0.76% in 24 hours, as buyers attempt to push the asset higher following a prolonged downtrend. The slight rebound is encouraging after the recent bottom near $98.62, but price still needs stronger follow-through to confirm a sustained recovery and break above the descending moving averages. Immediate support sits at $100.65–$99.16 (MA7 and 24h low). Holding this zone could keep the recovery alive, while a break below $99.16 may expose $98.62. On the upside, a move above $101.60–$101.38 (MA28 and 24h high) could open the path toward $103.56. The key driver is physical momentum. The asset has been in a steady decline from $108.51, and while it is currently attempting to stabilize above the $100 psychological level, it remains capped by the MA28. Trading volume has generally subsided compared to the massive spike seen on October 24th, suggesting a potential exhaustion of selling pressure, which supports the current consolidation. However, broader market uncertainty could limit further immediate gains. Bullish scenario: $101.60 breakout → $103.56 → $106.03 Bearish scenario: $99.16 breakdown → $98.62 → $95.00 For now, the recovery is positive, but holding above $100.00 and breaking the immediate moving average resistance will be important for confirming the next move.$SOLUSDT #ByXIMPACT

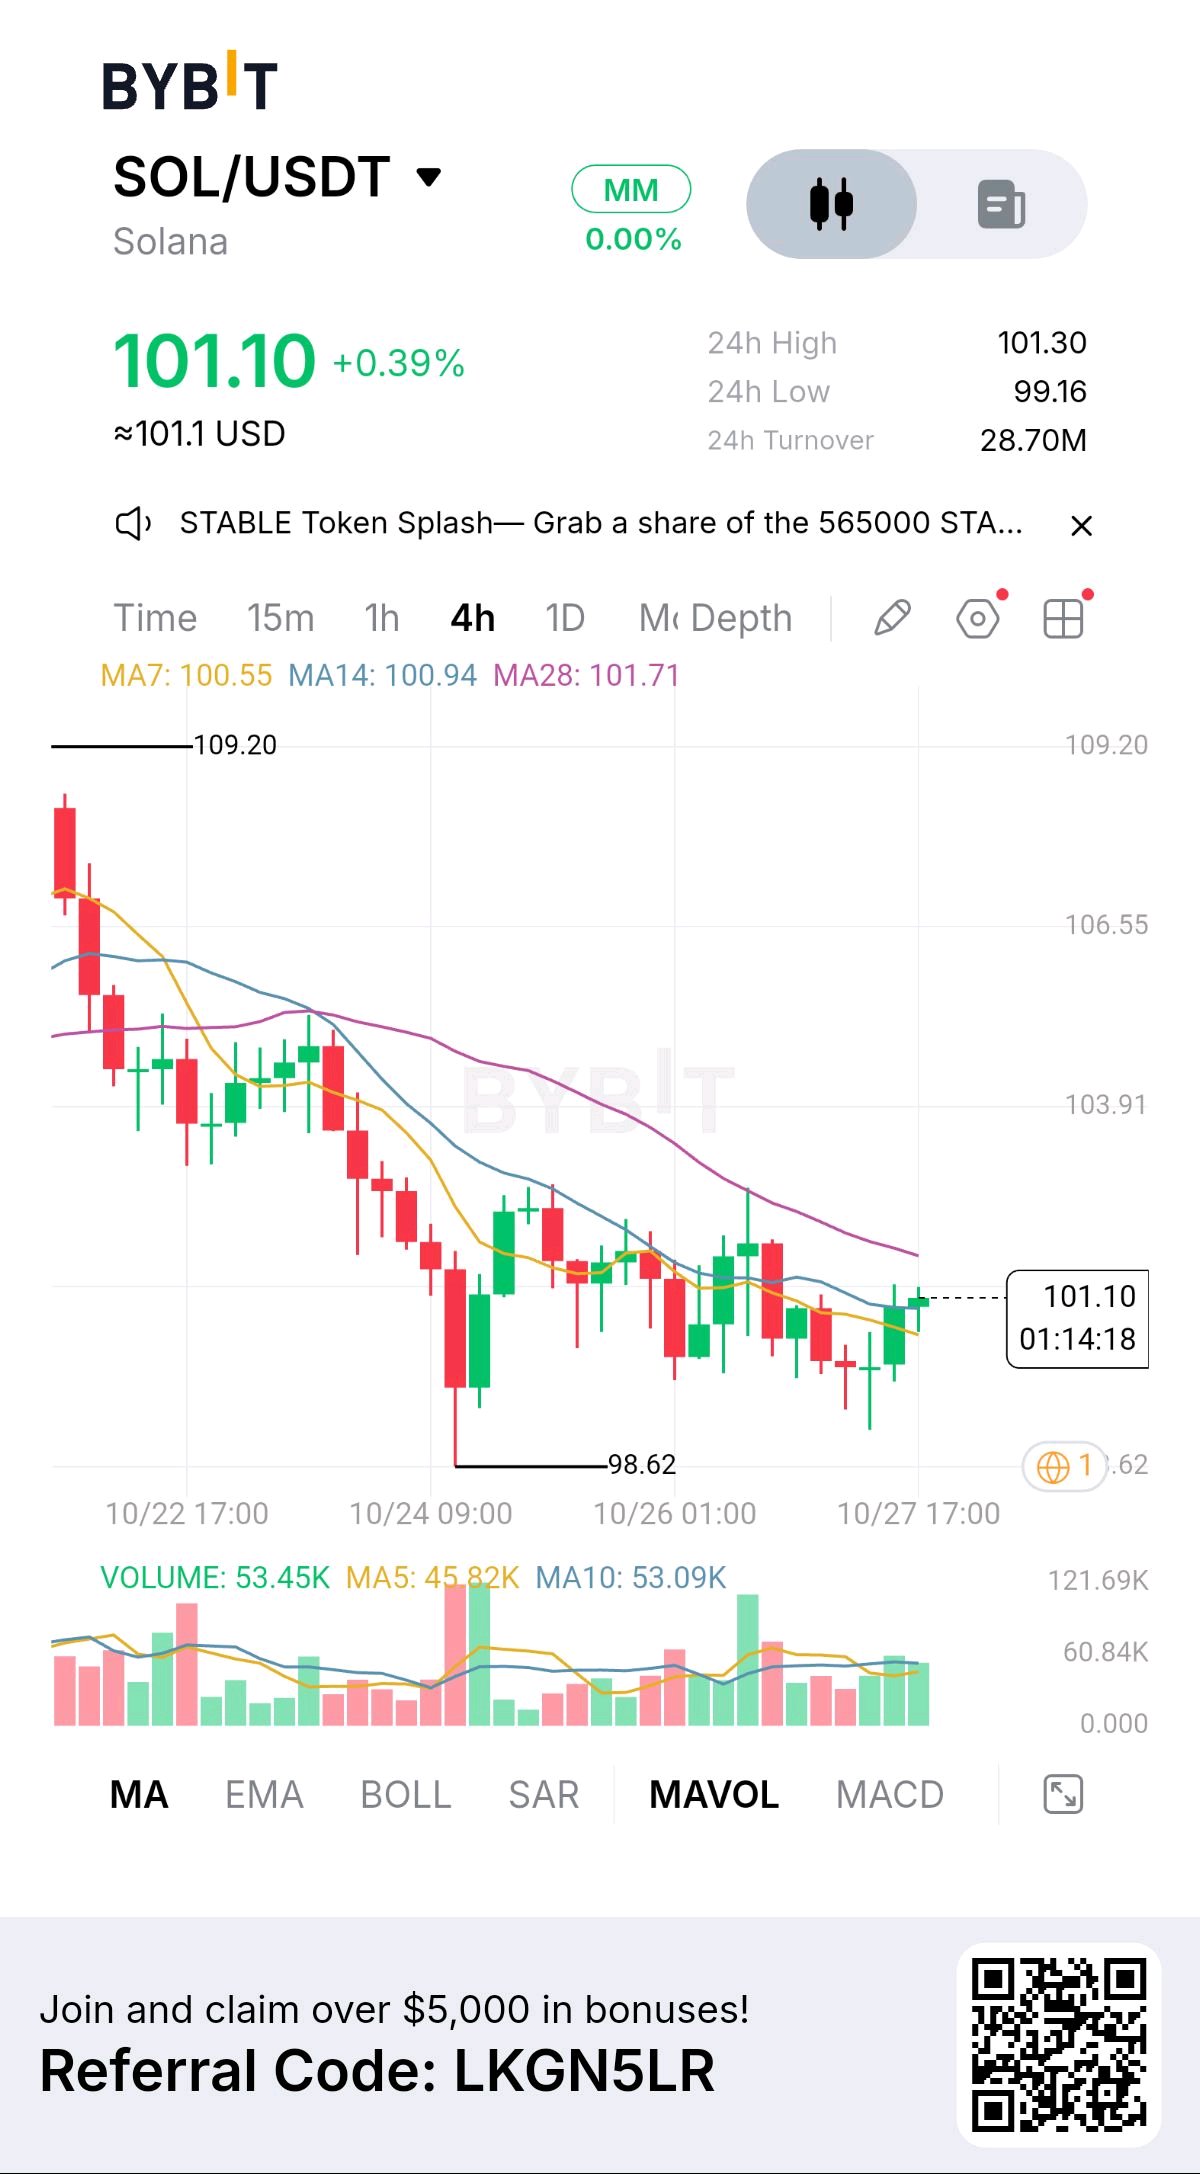
⚡ SOLANA (SOL) SITS AT 101.10 USDT — RAISING (+0.39%) ⚡ Solana (SOLUSDT) is trading at 101.10 USDT on the 4H timeframe, displaying minor positive recovery (+0.39% 24h change) while consolidating above its local floor at 98.62 USDT after pulling back from the 109.20 USDT swing high. CONSIDERATION Overhead Asks (Resistance): Immediate overhead sell resistance is anchored at MA28 (101.71 USDT) and the 24h High of 101.30 USDT. Above this level, key structural resistance sits at 103.91 USDT and 106.55 USDT. Underlying Bids (Support): Dynamic support is established by MA7 (100.55 USDT) and MA14 (100.94 USDT) directly beneath current price action. Structural floor defense holds at the 24h Low of 99.16 USDT and the local swing base at 98.62 USDT. Technical Structure: Price has reclaimed both MA7 and MA14, forming an initial bullish micro-crossover beneath price. However, MA28 (101.71 USDT) continues to slope downward directly overhead as dynamic barrier resistance. VOLUME AND TURNOVER Volume indicator (MAVOL) shows current 4H candle volume at 53.45K SOL relative to MA5 volume of 45.82K and MA10 volume of 53.09K. 24h Turnover stands at 28.70M USDT. Steady buy-side volume indicates initial accumulation near 98.62–100.55 USDT, but an expansion above MA10 is required to clear MA28. LEVEL TO WATCH 101.71 USDT (MA28 Dynamic Resistance): A strong 4H candle close above 101.71 USDT confirms a bullish trend flip and opens an expansion path toward 103.91 USDT and 106.55 USDT. SUPPORT AND RESISTANCE Resistance: 101.30 USDT (24h High), 101.71 USDT (MA28 Resistance), 103.91 USDT (Structural Level), 106.55 USDT (Major Target Zone) Support: 100.94 USDT (MA14 Support), 100.55 USDT (MA7 Support), 99.16 USDT (24h Low), 98.62 USDT (Major Base Floor) TRADE PLAN Breakout Entry: Enter on a confirmed 15M/4H candle close above 101.80 USDT following the full reclaim of MA28. Target 103.90 USDT and 106.50 USDT. Pullback Entry: Look for a high-volume retest holding dynamic MA support near 100.20 USDT before opening long exposure. Invalidation: A 4H candle close below 98.00 USDT breaks local base support and invalidates the bullish reversal setup. INVALIDATION AND RISK NOTE Avoid taking aggressive long market entries directly into MA28 resistance (101.71 USDT) without clear volume expansion. Short-term bullish structure is invalidated on a 4H close below 98.00 USDT. 3.0R Setup Example (Pullback Strategy): Entry: 100.20 USDT Stop Loss: 98.00 USDT ($2.20 Risk per SOL) Take Profit: 106.80 USDT ($6.60 Reward per SOL) Risk/Reward Ratio: 3.0R $SOLUSDT #ByXIMPACT
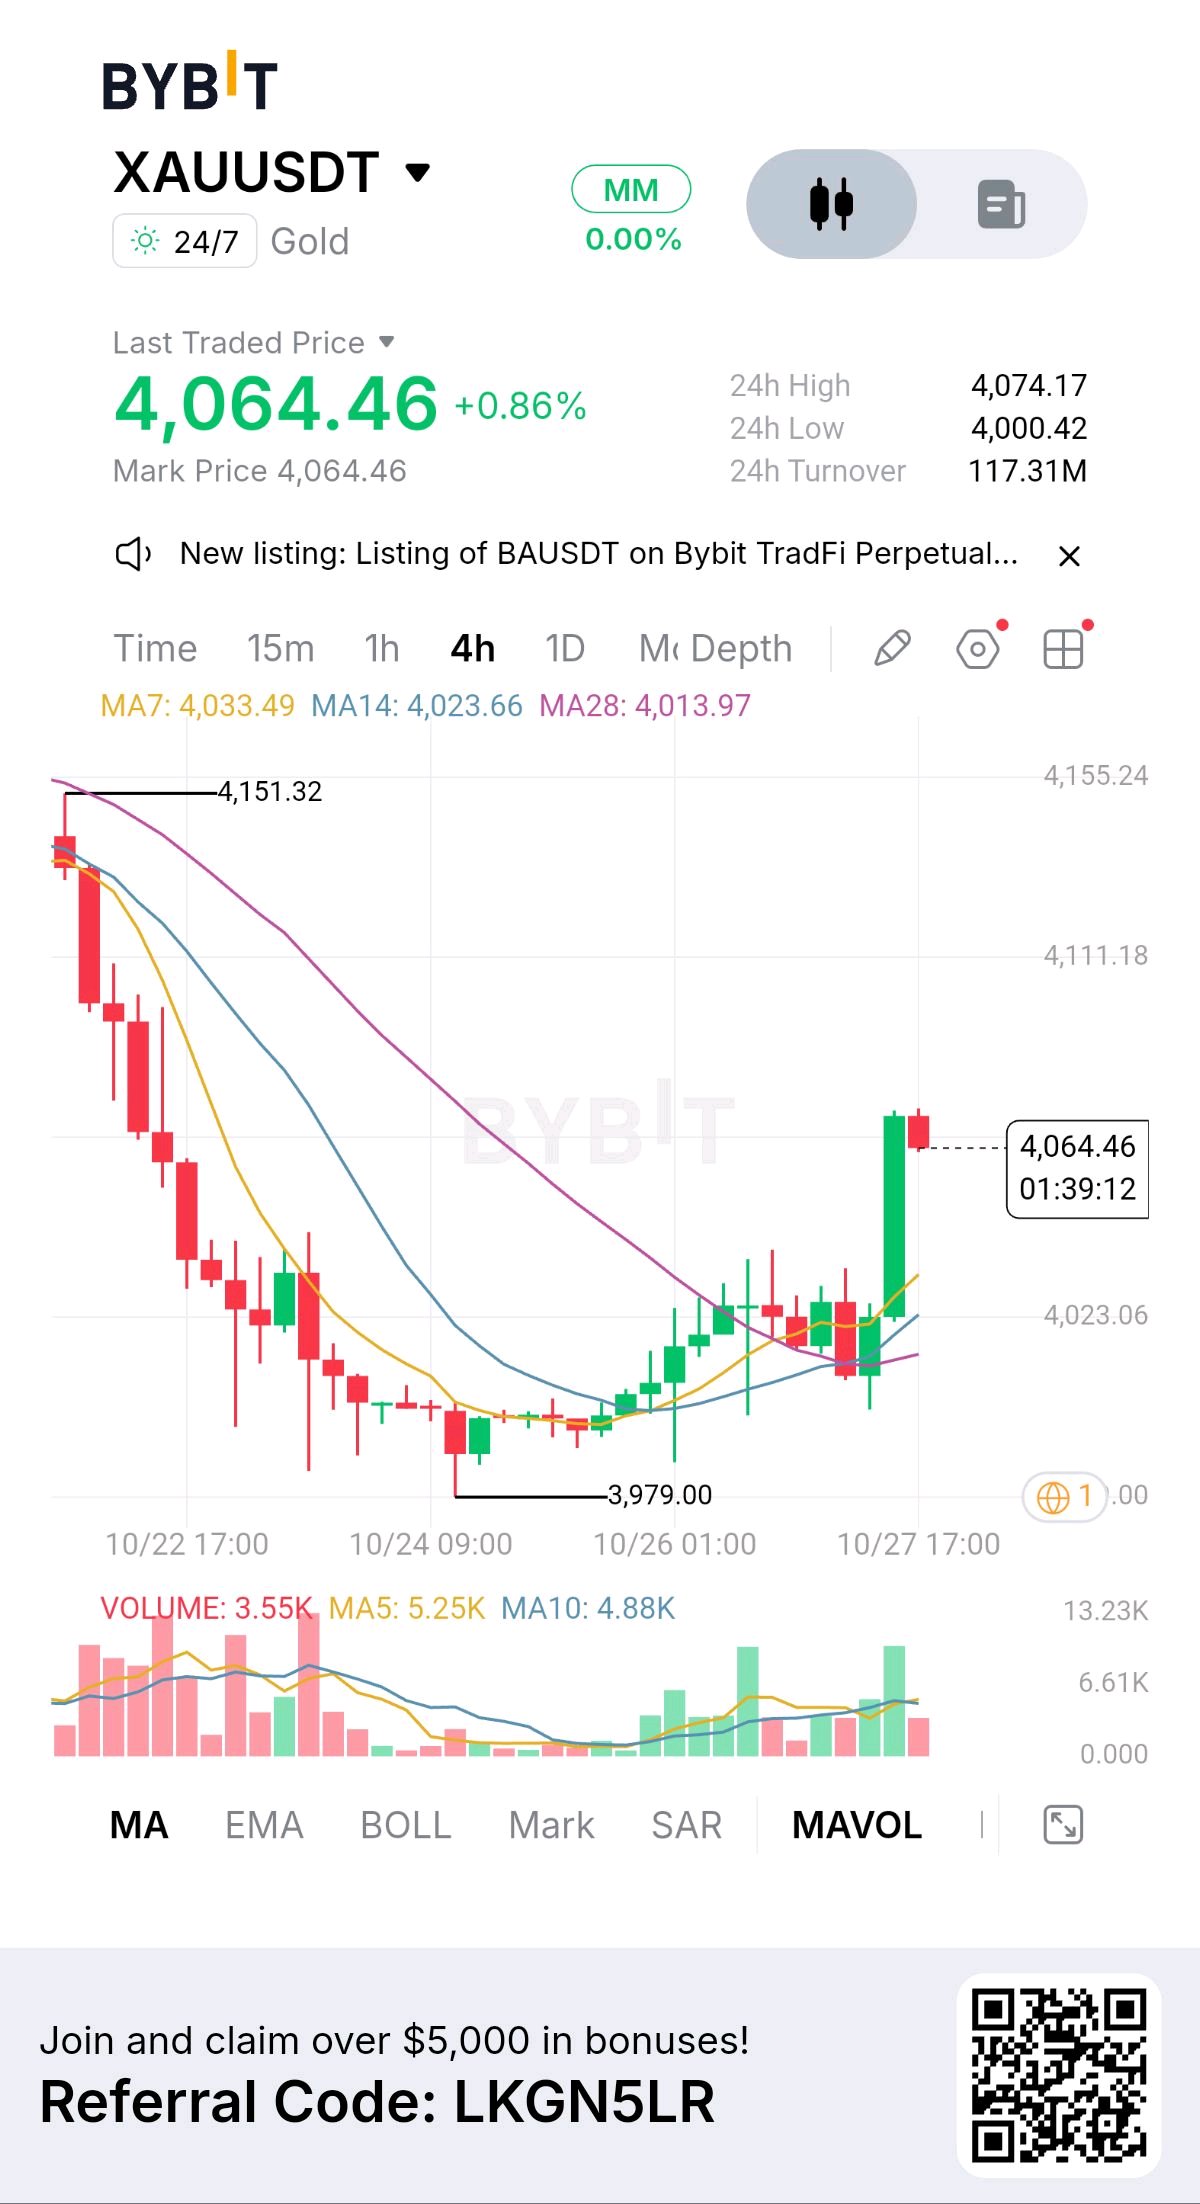
⚡ GOLD (XAU) SITS AT 4,064.46 USDT — RAISING (+0.86%) ⚡ Gold (XAUUSDT) is trading at 4,064.46 USDT on the 4H timeframe, displaying strong bullish continuation (+0.86% 24h change) following a powerful impulse candle off the 3,979.00 USDT base up to a 24h High of 4,074.17 USDT. CONSIDERATION Overhead Asks (Resistance): Overhead sell resistance is anchored at the 24h High of 4,074.17 USDT. Above this level, key structural resistance sits at 4,111.18 USDT and the major peak at 4,151.32 USDT. Underlying Bids (Support): Dynamic support is established by MA7 (4,033.49 USDT), MA14 (4,023.66 USDT), and MA28 (4,013.97 USDT), forming a fully stacked bullish moving average alignment. Structural floor defense holds at the 24h Low of 4,000.42 USDT and the swing base at 3,979.00 USDT. Technical Structure: Price has executed a strong breakout above all moving averages, with MA7, MA14, and MA28 fanning out upward in perfect bullish order beneath current price action. VOLUME AND TURNOVER Volume indicator (MAVOL) shows current 4H candle volume at 3.55K XAU against MA5 volume of 5.25K and MA10 volume of 4.88K. 24h Turnover stands strong at 117.31M USDT. The massive green volume surge on the breakout candle confirms strong institutional buyer expansion. LEVEL TO WATCH 4,074.17 USDT (24h High Resistance): A clean 4H candle close above 4,074.17 USDT clears immediate overhead supply and unlocks expansion toward 4,111.18 USDT. SUPPORT AND RESISTANCE Resistance: 4,074.17 USDT (24h High Target), 4,111.18 USDT (Structural Resistance), 4,151.32 USDT (Major Swing Peak) Support: 4,033.49 USDT (MA7 Support), 4,023.66 USDT (MA14 Support), 4,013.97 USDT (MA28 Dynamic Support Floor), 3,979.00 USDT (Major Double-Bottom Base) TRADE PLAN Breakout Entry: Enter on a confirmed 15M/4H candle close above 4,076.00 USDT following the full reclaim of the 24h High. Target 4,111.00 USDT and 4,150.00 USDT. Pullback Entry: Look for a high-volume retest holding dynamic MA support near 4,034.00 USDT before opening long exposure. Invalidation: A 4H candle close below 3,990.00 USDT breaks local moving average support and invalidates the bullish trend structure. INVALIDATION AND RISK NOTE Avoid chasing market long entries directly under 4,074.17 USDT without waiting for either a volume breakout or a pullback to dynamic MA7 support (4,033.49 USDT). Short-term bullish structure is invalidated on a 4H close below 3,990.00 USDT. 3.0R Setup Example (Pullback Strategy): Entry: 4,034.00 USDT Stop Loss: 3,994.00 USDT ($40.00 Risk per XAU) Take Profit: 4,154.00 USDT ($120.00 Reward per XAU) Risk/Reward Ratio: 3.0R #XAUUSDT #ByXIMPACT
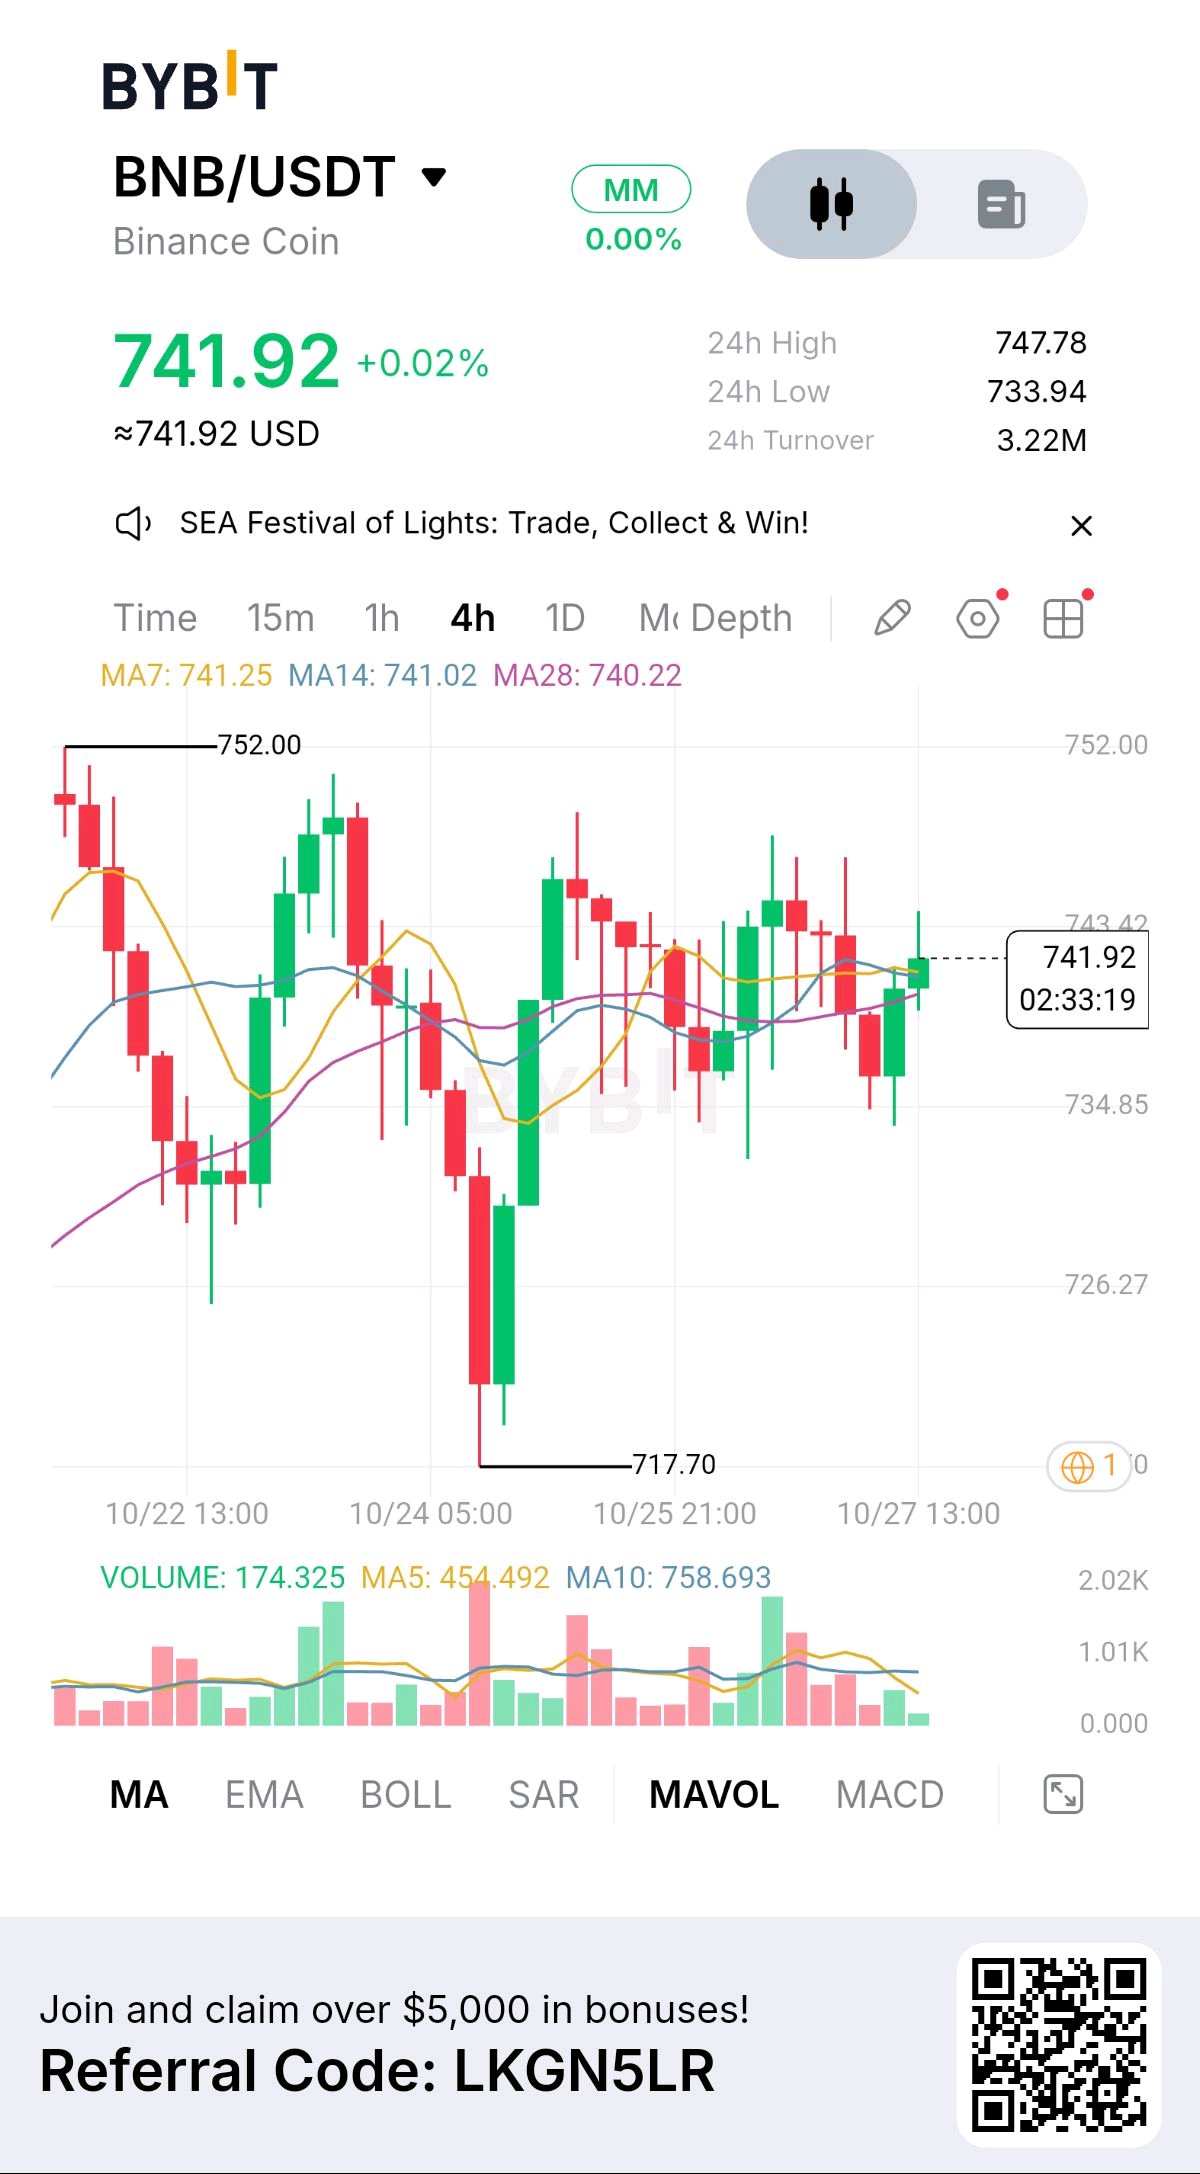
BNB is trading around $741.92, up roughly 0.02% in 24 hours, as buyers attempt to hold price steady after a volatile period. The consolidation is encouraging after the sharp drop to $717.70, but price still needs stronger follow-through to confirm a sustained recovery and break out of the current sideways range. Immediate support sits at $740.22–$733.94 (MA28 and 24h low). Holding this zone could keep the stabilization alive, while a break below $733.94 may expose $726.27. On the upside, a move above $747.78–$752.00 could open the path toward $760.00. The key driver is physical momentum. Price is currently tangled tightly with the moving averages (MA7, MA14, MA28), indicating a lack of clear directional trend and low volatility. The volume has significantly dried up compared to previous days, suggesting market indecision. Expectations of broader market volatility could limit further immediate gains until a catalyst emerges. Bullish scenario: $752.00 breakout → $760.00 → $775.00 Bearish scenario: $733.94 breakdown → $726.27 → $717.70 For now, the stabilization is positive, but holding above $740.00 and breaking the immediate resistance will be important for confirming the next move.$BNBUSDT #ByXIMPACT
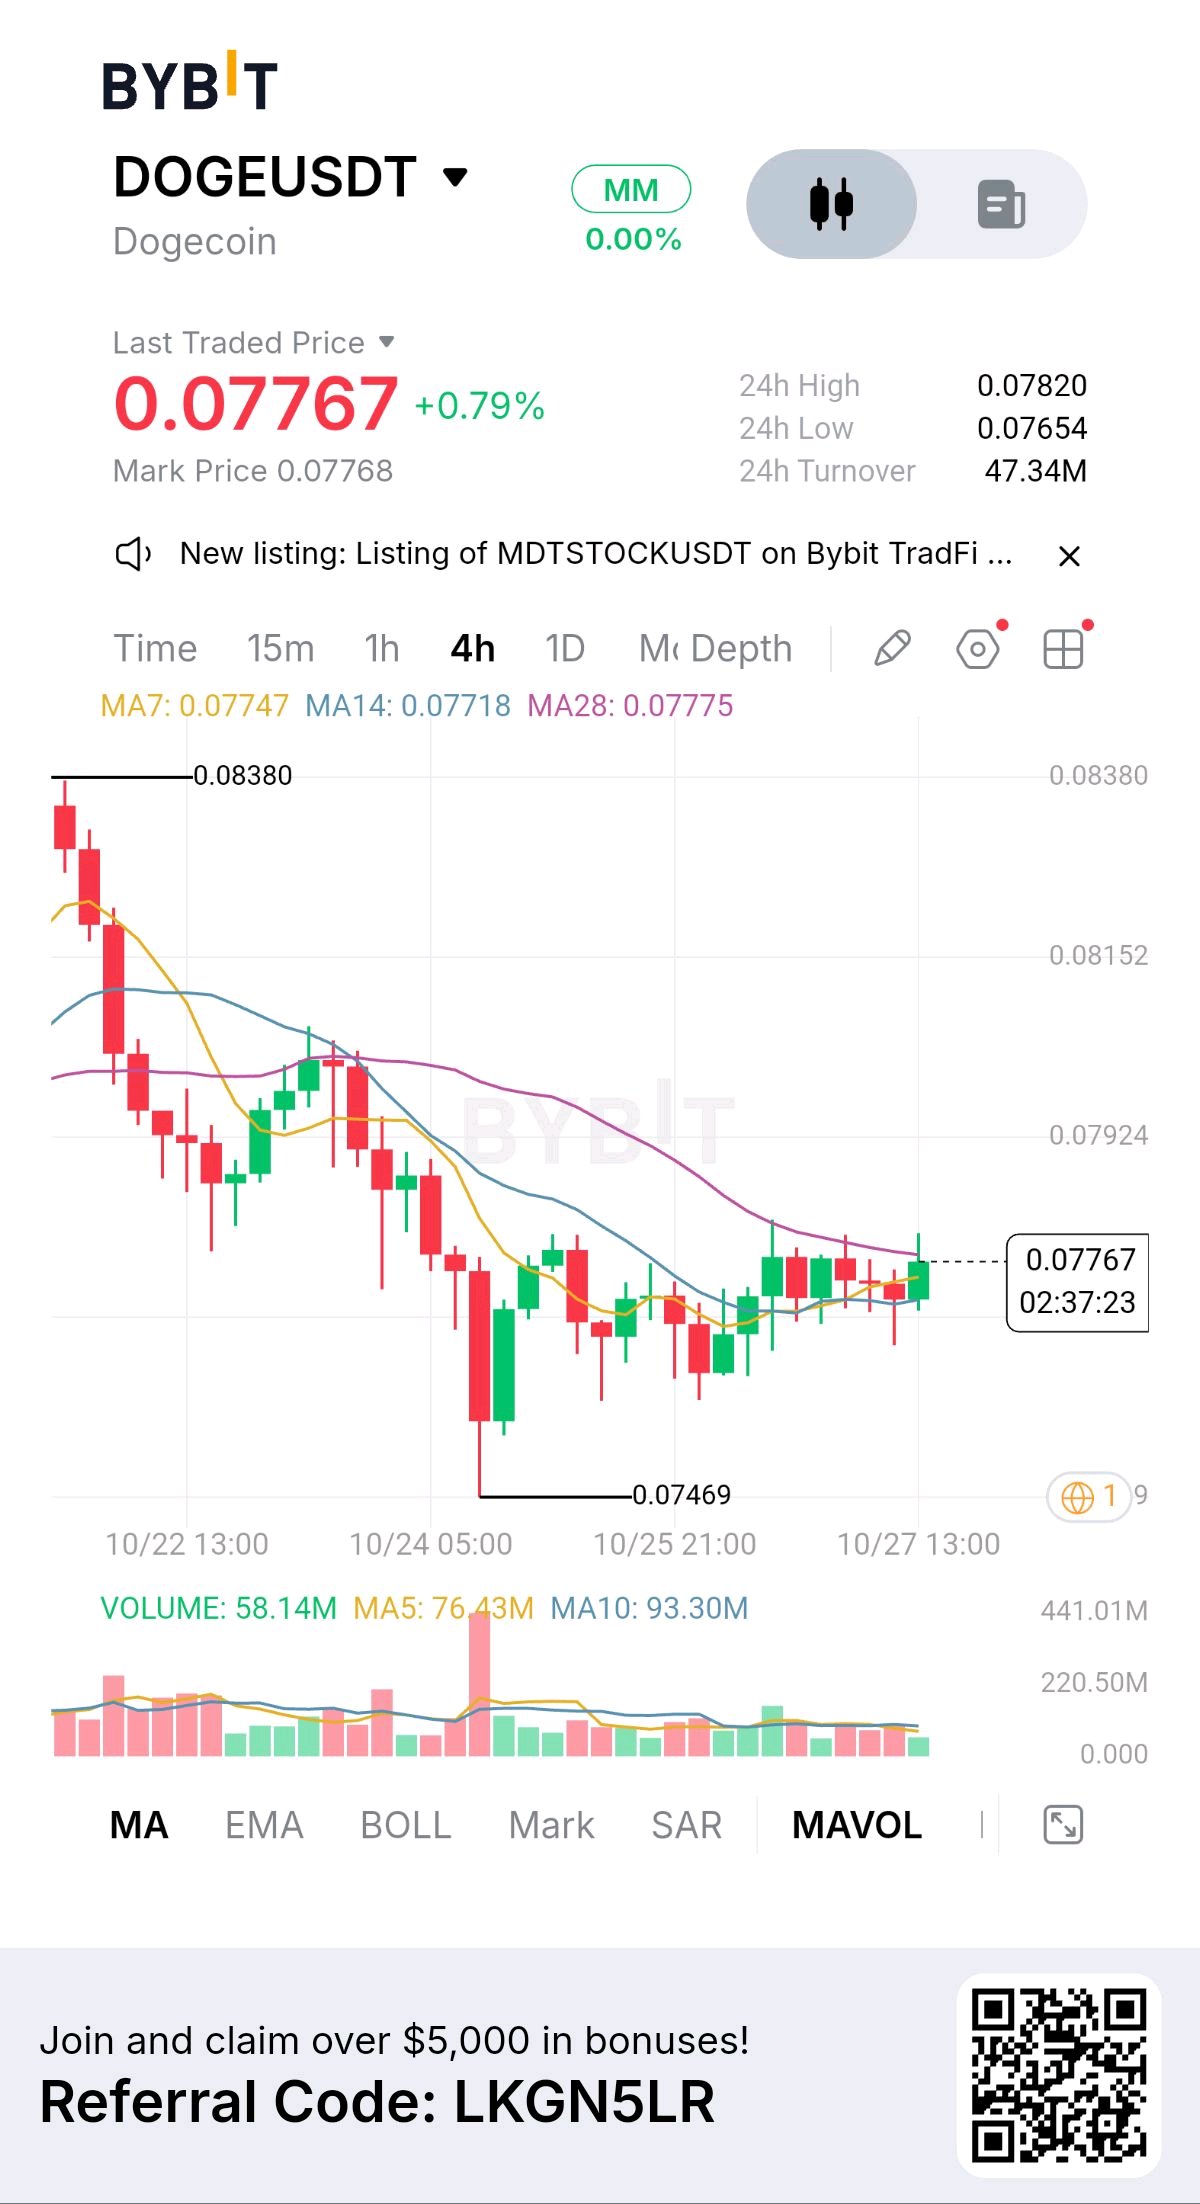
⚡ DOGECOIN (DOGE) SITS AT 0.07767 USDT — RAISING (+0.79%) ⚡ Dogecoin (DOGEUSDT) is trading at 0.07767 USDT on the 4H timeframe, attempting a gradual recovery (+0.79% 24h change) following a multi-day corrective pull down from its peak at 0.08380 USDT to a local support floor at 0.07469 USDT. CONSIDERATION Overhead Asks (Resistance): Overhead sell liquidity is anchored at the recent 24h High of 0.07820 USDT and the structural resistance level at 0.07924 USDT. The swing high peak sits further above at 0.08380 USDT. Underlying Bids (Support): Dynamic support is established by MA7 (0.07747 USDT), MA14 (0.07718 USDT), and MA28 (0.07775 USDT), which are all converging tightly beneath current price action. Structural support holds at the 24h Low of 0.07654 USDT and the primary floor at 0.07469 USDT. Technical Structure: Price has reclaimed MA7 and MA14 while actively pushing against MA28, forming a volatility compression squeeze on the 4H timeframe. VOLUME AND TURNOVER Volume indicator (MAVOL) shows current 4H candle volume at 58.14M DOGE relative to MA5 volume of 76.43M and MA10 volume of 93.30M. 24h Turnover stands at 47.34M USDT. Decreasing sell volume during this tight baseline consolidation suggests seller exhaustion near 0.07654–0.07767 USDT. LEVEL TO WATCH 0.07820 USDT (24h High Resistance): A strong 4H candle close above 0.07820 USDT clears immediate overhead supply and confirms breakout expansion toward 0.07924 USDT and 0.08152 USDT. SUPPORT AND RESISTANCE Resistance: 0.07820 USDT (24h High), 0.07924 USDT (Structural Pivot), 0.08152 USDT (Intermediate Resistance Target), 0.08380 USDT (Swing High) Support: 0.07747 USDT (MA7 Support), 0.07718 USDT (MA14 Support), 0.07654 USDT (24h Low), 0.07469 USDT (Major Floor) TRADE PLAN Breakout Entry: Enter on a confirmed 15M/4H candle close above 0.07830 USDT following the full reclaim of the 24h High. Target 0.08150 USDT and 0.08380 USDT. Pullback Entry: Look for a high-volume retest holding dynamic MA support near 0.07700 USDT before establishing long exposure. Invalidation: A 4H candle close below 0.07450 USDT breaks local structural support and invalidates the bullish reversal setup. INVALIDATION AND RISK NOTE Avoid chasing long market entries directly into MA28 / 24h High resistance (0.07820 USDT) without clear volume expansion. Short-term bullish structure is invalidated on a 4H close below 0.07450 USDT. 3.0R Setup Example (Pullback Strategy): Entry: 0.07700 USDT Stop Loss: 0.07500 USDT ($0.0020 Risk per DOGE) Take Profit: 0.08300 USDT ($0.0060 Reward per DOGE) Risk/Reward Ratio: 3.0R $DOGEUSDT #ByXIMPACT
⚡ BITCOIN (BTC) SITS AT 80,234.0 USDT — RAISING (+0.11%) ⚡ Bitcoin (BTCUSDT) is trading at 80,234.0 USDT on the 4H timeframe, attempting a minor recovery (+0.11% 24h change) while consolidating tightly above its major structural floor at 79,217.9 USDT following a prolonged correction from the 84,906.1 USDT peak. CONSIDERATION Overhead Asks (Resistance): Immediate overhead sell resistance is anchored at MA28 (80,597.7 USDT) and the 24h High of 80,852.0 USDT. Major structural resistance sits above at 83,484.0 USDT and 84,906.1 USDT. Underlying Bids (Support): Dynamic support is established by MA7 (80,050.2 USDT) and MA14 (80,167.6 USDT) directly beneath current price action. Structural support anchors at the 24h Low of 79,461.1 USDT and the local double-bottom floor at 79,217.9 USDT. Technical Structure: Price has reclaimed both MA7 and MA14, forming an initial bullish micro-crossover beneath price. However, MA28 (80,597.7 USDT) continues to slope downward directly overhead as dynamic barrier resistance. VOLUME AND TURNOVER Volume indicator (MAVOL) shows current 4H volume at 555.292 BTC relative to MA5 volume of 911.193 and MA10 volume of 1.34K. 24h Turnover stands at 626.92M USDT. Volume contraction during consolidation indicates low selling pressure near 79,217.9 USDT, though buy-side expansion is required to force a breakout past MA28. LEVEL TO WATCH 80,597.7 USDT (MA28 Dynamic Resistance): A strong 4H candle close above 80,597.7 USDT confirms a bullish trend flip and clears the path toward the 80,852.0–83,484.0 USDT expansion zone. SUPPORT AND RESISTANCE Resistance: 80,597.7 USDT (MA28 Resistance), 80,852.0 USDT (24h High Target), 83,484.0 USDT (Structural Level), 84,906.1 USDT (Swing High) Support: 80,167.6 USDT (MA14 Support), 80,050.2 USDT (MA7 Support), 79,461.1 USDT (24h Low), 79,217.9 USDT (Major Double-Bottom Floor) TRADE PLAN Breakout Entry: Enter on a confirmed 15M/4H candle close above 80,650.0 USDT following the full reclaim of MA28. Target 83,484.0 USDT and 84,906.1 USDT. Pullback Entry: Look for a high-volume retest holding the local demand base around 79,600.0 USDT before opening long exposure. Invalidation: A 4H candle close below 79,000.0 USDT breaks the local consolidation support and invalidates the bullish reversal setup. INVALIDATION AND RISK NOTE Avoid initiating aggressive long market orders directly into MA28 resistance (80,597.7 USDT) without clear buy volume confirmation. Bullish structure is invalidated on a 4H close below 79,000.0 USDT. 3.0R Setup Example (Pullback Strategy): Entry: 79,600.0 USDT Stop Loss: 79,000.0 USDT ($600.00 Risk per BTC) Take Profit: 81,400.0 USDT ($1,800.00 Reward per BTC) Risk/Reward Ratio: 3.0R$BTCUSDT #ByXIMPACT
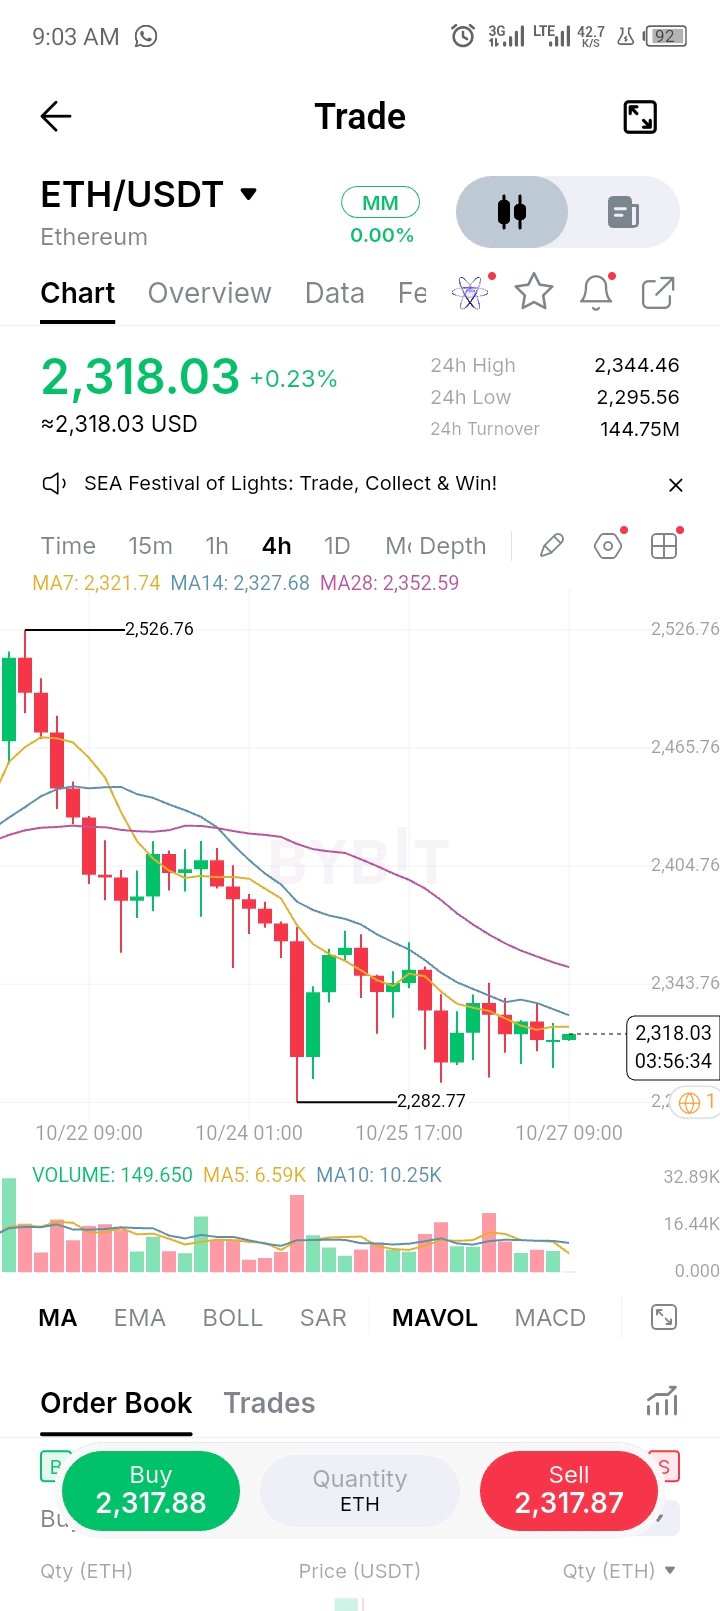
⚡ ETHEREUM (ETH) SITS AT 2,318.03 USDT — RAISING (+0.23%) ⚡ Ethereum (ETHUSDT) is trading at 2,318.03 USDT on the 4H timeframe, holding minor positive ground (+0.23% 24h change) while consolidating tightly above its recent swing low floor of 2,282.77 USDT after pulling back from 2,526.76 USDT. CONSIDERATION Overhead Asks (Resistance): Overhead sell liquidity is heavily stacked across the moving average barrier between 2,321.74 USDT (MA7), 2,327.68 USDT (MA14), and 2,344.46 USDT (24h High). Major structural resistance sits above at 2,352.59 USDT (MA28). Underlying Bids (Support): Immediate demand is anchoring the local base near the 24h Low of 2,295.56 USDT, with strong structural floor defense positioned at 2,282.77 USDT. Technical Structure: Price action remains constrained beneath all primary moving averages (MA7 < MA14 < MA28), which continue to slope downward as dynamic resistance. However, compression candles indicate a volatility squeeze forming at support. VOLUME AND TURNOVER Volume indicator (MAVOL) shows current candle volume contracting to 149.650 ETH relative to the MA5 volume of 6.59K and MA10 volume of 10.25K. 24h Turnover stands at 144.75M USDT. The drop in volume signals seller exhaustion near 2,295.56–2,318.03 USDT, but buying volume is required to force a breakout past MA14. LEVEL TO WATCH 2,327.68 USDT (MA14 Resistance Pivot): A clean 4H candle close above 2,327.68 USDT clears immediate short-term supply and triggers a retest of major dynamic resistance at 2,352.59 USDT (MA28). SUPPORT AND RESISTANCE Resistance: 2,321.74 USDT (MA7 Resistance), 2,327.68 USDT (MA14 Pivot), 2,344.46 USDT (24h High), 2,352.59 USDT (MA28 Dynamic Target) Support: 2,295.56 USDT (24h Low), 2,282.77 USDT (Major Swing Support Base), 2,220.00 USDT (Key Structural Floor) TRADE PLAN Breakout Entry: Enter on a confirmed 15M/4H candle close above 2,330.00 USDT following the full reclaim of MA7 and MA14. Target 2,352.00 USDT and 2,404.00 USDT. Pullback Entry: Look for a liquidity sweep holding near the primary demand floor around 2,285.00 USDT before opening long exposure. Invalidation: A 4H candle close below 2,270.00 USDT invalidates the local consolidation support and triggers further downward extension. INVALIDATION AND RISK NOTE Avoid taking aggressive long positions directly under the MA7/MA14 cluster (2,321.74–2,327.68 USDT) without clear buy volume expansion. Bullish setup is invalidated on a 4H close below 2,270.00 USDT. 3.0R Setup Example (Pullback Strategy): Entry: 2,285.00 USDT Stop Loss: 2,270.00 USDT ($15.00 Risk per ETH) Take Profit: 2,330.00 USDT ($45.00 Reward per ETH) Risk/Reward Ratio: 3.0R$ETHUSDT #ByXIMPACT
⚡ TESLA (TSLA) SITS AT 390.96 USDT — RAISING (+4.04%) ⚡ Tesla (TSLAUSDT) is trading at 390.96 USDT on the 4H timeframe, holding strong bullish momentum (+4.04% 24h change) while consolidating near its top after a sharp breakout from the 365.75 USDT base up to a 24h High of 397.47 USDT. CONSIDERATION Overhead Asks (Resistance): Overhead sell resistance is concentrated at the recent swing peak of 397.47 USDT. Above this, psychological resistance sits at 400.00 USDT and 415.00 USDT. Underlying Bids (Support): Immediate dynamic support is provided by MA7 (390.94 USDT), which is directly testing current market prices. Secondary structural support sits at 381.81 USDT (MA14), 379.67 USDT, and 377.46 USDT (MA28). Technical Structure: Price remains cleanly stacked above all key moving averages with MA7 > MA14 > MA28 in full bullish alignment. The current 4H candle is retesting the fast MA7 line to build a high-level consolidation flag. VOLUME AND TURNOVER Volume indicator (MAVOL) shows current candle volume cooling to 894.210 TSLA relative to MA5 volume of 5.58K and MA10 of 8.69K. 24h Turnover stands strong at 29.83M USDT. The volume contraction during high-level consolidation indicates healthy absorption rather than aggressive selling pressure. LEVEL TO WATCH 397.47 USDT (24h High & Resistance Peak): A strong 4H candle close above 397.47 USDT clears overhead supply and confirms breakout continuation toward the 410.00–415.00 USDT target zone. SUPPORT AND RESISTANCE Resistance: 397.47 USDT (24h High Target), 405.00 USDT (Psychological Level), 415.00 USDT (Major Structural Target) Support: 390.94 USDT (MA7 Immediate Support), 381.81 USDT (MA14 Base Support), 377.46 USDT (MA28 Dynamic Support Floor) TRADE PLAN Breakout Entry: Enter on a confirmed 15M/4H candle close above 398.00 USDT following the full absorption of the 397.47 USDT high. Target 408.00 USDT and 418.00 USDT. Pullback Entry: Look for a high-volume retest holding the dynamic support cluster around 382.00 USDT before opening long positions. Invalidation: A 4H candle close below 372.00 USDT breaks the short-term bullish trend structure. INVALIDATION AND RISK NOTE Avoid entering aggressive long positions at 390.96 USDT without waiting for either a volume breakout past 397.47 USDT or a dip to stronger MA14 support at 381.81 USDT. Bullish structure is invalidated on a 4H close below 372.00 USDT. 3.0R Setup Example (Pullback Strategy): Entry: 382.00 USDT Stop Loss: 372.00 USDT ($10.00 Risk per TSLA) Take Profit: 412.00 USDT ($30.00 Reward per TSLA) Risk/Reward Ratio: 3.0R$TSLAXUSDT #ByXIMPACT

⚡ BINANCE COIN (BNB) SITS AT 742.93 USDT — RAISING (+0.17%) ⚡ Binance Coin (BNB) is trading at 742.93 USDT on the 4H timeframe, attempting to hold higher ground (+0.17% 24h change) following a strong rebound from its key local support floor at 717.70 USDT up to its recent peak near 752.00 USDT. MARKET SITUATION Price is currently consolidating around 742.93 USDT after holding above the key moving average cluster (24h Low: 732.35 USDT / 24h High: 747.78 USDT). 24h Turnover stands at 4.16M USDT. MY OBSERVATION Price is trading strictly above the MA7 (741.12 USDT), MA14 (741.20 USDT), and MA28 (739.12 USDT). The short-term moving averages have formed a tight bullish convergence beneath current price action, providing an immediate dynamic demand floor. TECHNICAL ANALYSIS Moving Averages: MA7 (741.12) and MA14 (741.20) are sloping upward alongside MA28 (739.12), establishing a stacked bullish alignment under price. Candlestick Structure: Price has established higher swing lows since bouncing off 717.70 USDT, with recent 4H candles showing buyer absorption on lower-wick retests of the MA cluster. KEY LEVELS Resistance: 747.78 USDT (24h High), 752.00 USDT (Key Structural Resistance), 770.00 USDT (Major Target Zone) Support: 741.12–741.20 USDT (MA7/MA14 Support Cluster), 739.12 USDT (MA28 Dynamic Support), 732.35 USDT (24h Low), 717.70 USDT (Major Structural Floor) BULLISH AND BEARISH SCENARIOS Bullish Scenario: A clean 4H candle close above 747.78 USDT unlocks momentum toward the major structural resistance at 752.00 USDT, with a breakout opening expansion targets near 770.00 USDT. Bearish Scenario: A breakdown below the MA28 support at 739.12 USDT triggers a pullback toward 732.35 USDT, with a loss of that level exposing the 717.70 USDT key floor. ENTRY, TAKE-PROFIT AND INVALIDATION LEVELS Execution Strategy: Long retest on local MA support Entry: 741.50 USDT Take-Profit (TP): 765.50 USDT ($24.00 Gain per BNB) Invalidation / Stop-Loss (SL): 733.50 USDT ($8.00 Risk per BNB) MOMENTUM AND VOLUME Volume indicator (MAVOL) shows current candle volume at 92.184 BNB against MA5 volume of 859.206 BNB and MA10 of 746.590 BNB. Low volume during consolidation indicates buyers need a volume expansion above MA10 to push past the 747.78–752.00 USDT resistance zone. RISK MANAGEMENT Maintain disciplined position sizing using max 10x cross leverage. Keep total risk per trade capped strictly at 1–2% of trading account capital. KEY FACTORS TO WATCH MA Support Defense: Holding above the 739.12–741.20 USDT MA zone. 24h High Breakout: Volume sweep pushing price above 747.78 USDT. Volume Surge: MAVOL expansion crossing above MA5 (859.206 BNB). FINAL TAKE BNB is maintaining a solid bullish structure above all major 4H moving averages (MA7, MA14, MA28). Dips toward the 741.50 USDT zone offer a favorable 3.0R Risk/Reward long entry targeting 765.50 USDT with invalidation below 733.50 USDT. $BNBUSDT #ByXIMPACT

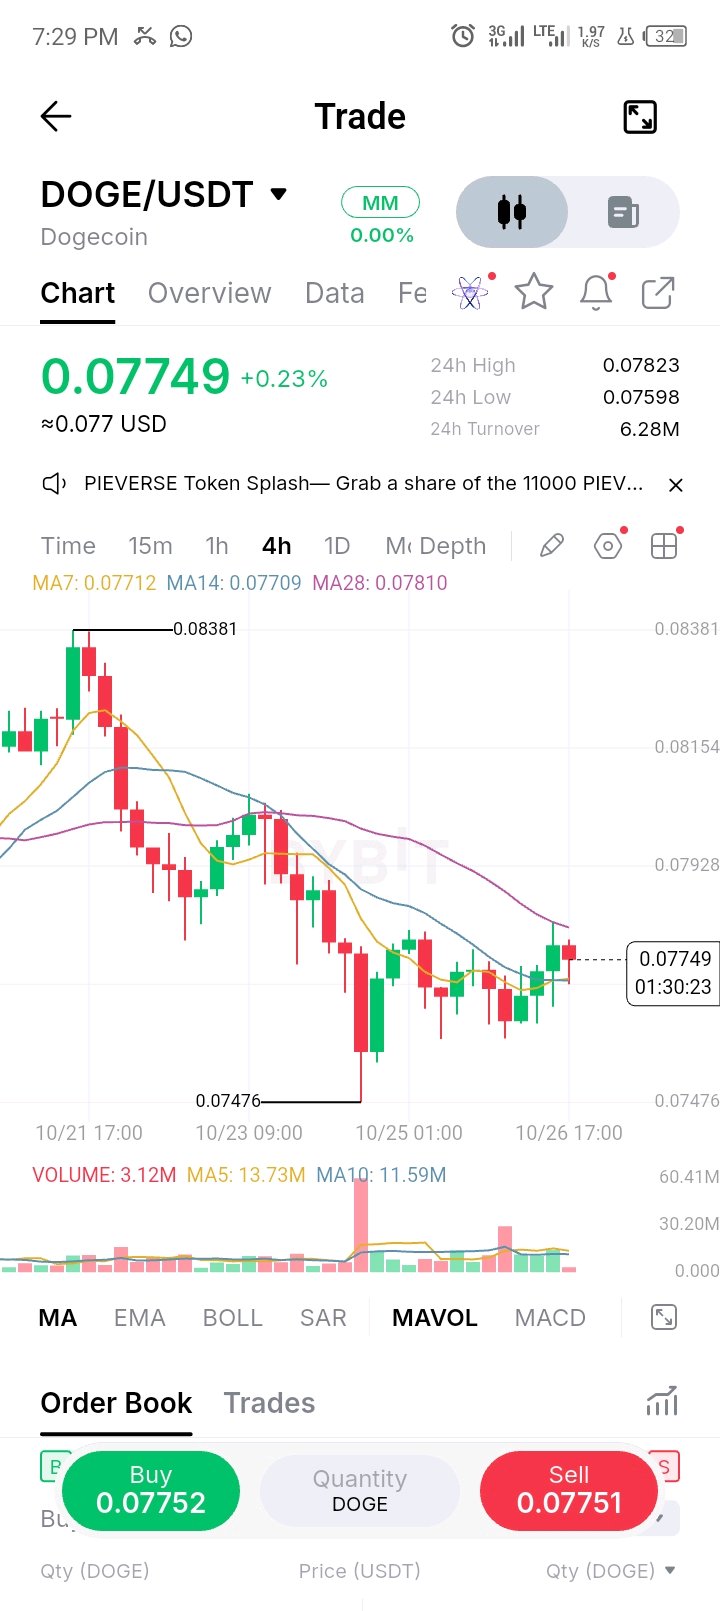
DOGE is trading around $0.07749, up roughly 0.23% in 24 hours, as buyers attempt to halt the recent downtrend near local lows. The stabilization is encouraging after the sharp drop from $0.08381, but price still needs stronger follow-through to confirm a sustained recovery and break the current lower-high structure. Immediate support sits at $0.07598–$0.07476. Holding this zone could keep the stabilization alive, while a break below $0.07476 may expose $0.07300. On the upside, a move above $0.07712–$0.07810 (MA7/MA28 cluster) could open the path toward $0.08000. The key driver is physical momentum. The asset is currently trapped below the descending moving averages, keeping the broader trend bearish. However, the recent volume spike on the downside has subsided, and consolidation is occurring, which could support a relief rally if buyers step in. Expectations of broader market volatility could limit further immediate gains if risk appetite remains low. Bullish scenario: $0.07810 breakout → $0.08000 → $0.08150 Bearish scenario: $0.07476 breakdown → $0.07300 → $0.07150 For now, the stabilization is positive, but holding above $0.07500 and breaking the immediate moving average resistance will be important for confirming the next move.$DOGEUSDT #ByXIMPACT
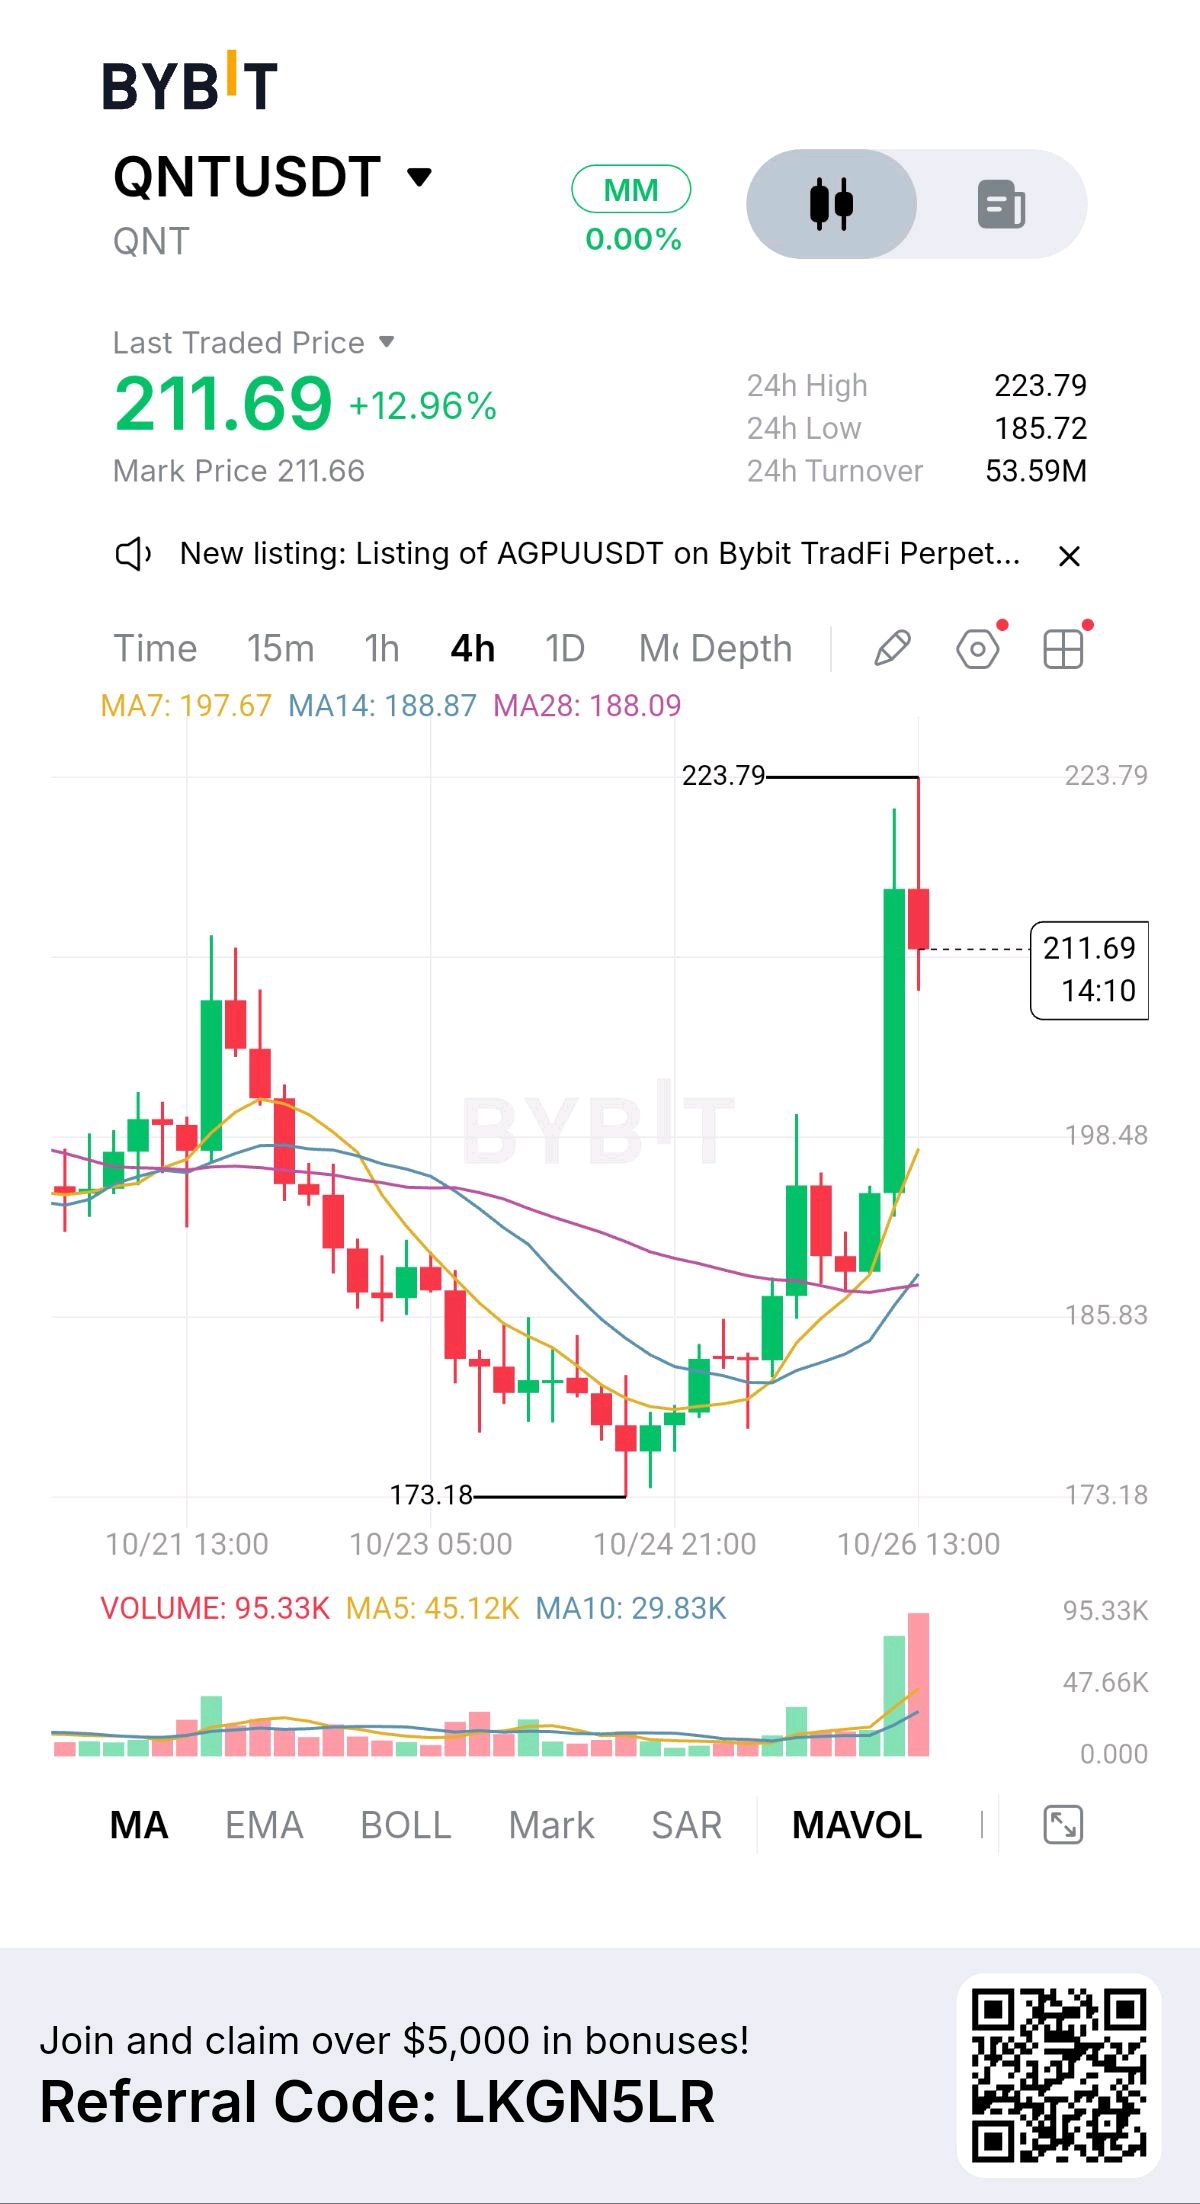
QNT is trading around $211.69, up roughly 12.96% in 24 hours, as buyers push the asset well above previous resistance levels following a massive breakout. The surge is encouraging after the recent bottom near $173, but price is currently facing a strong rejection at the highs, leaving a long upper wick that needs follow-through to confirm a sustained recovery. Immediate support sits at $197.67–$198.00 (near the MA7). Holding this zone could keep the recovery alive, while a break below $197.00 may expose $188.87–$188.09 (MA14/MA28). On the upside, a move above $223.79 could open the path toward $230.00. The key driver is the massive physical volume spike. The surge in trading volume has fueled this aggressive rally, supporting the upward momentum. However, the heavy volume on the current red candle indicates strong selling pressure and potential profit-taking at these levels, which could limit further gains in the immediate short term. Bullish scenario: $223.79 breakout → $230.00 → $240.00 Bearish scenario: $197.67 breakdown → $188.87 → $173.18 For now, the recovery is positive, but holding above $200.00 and breaking the immediate high will be important for confirming the next move.$QNTUSDT #ByXIMPACT
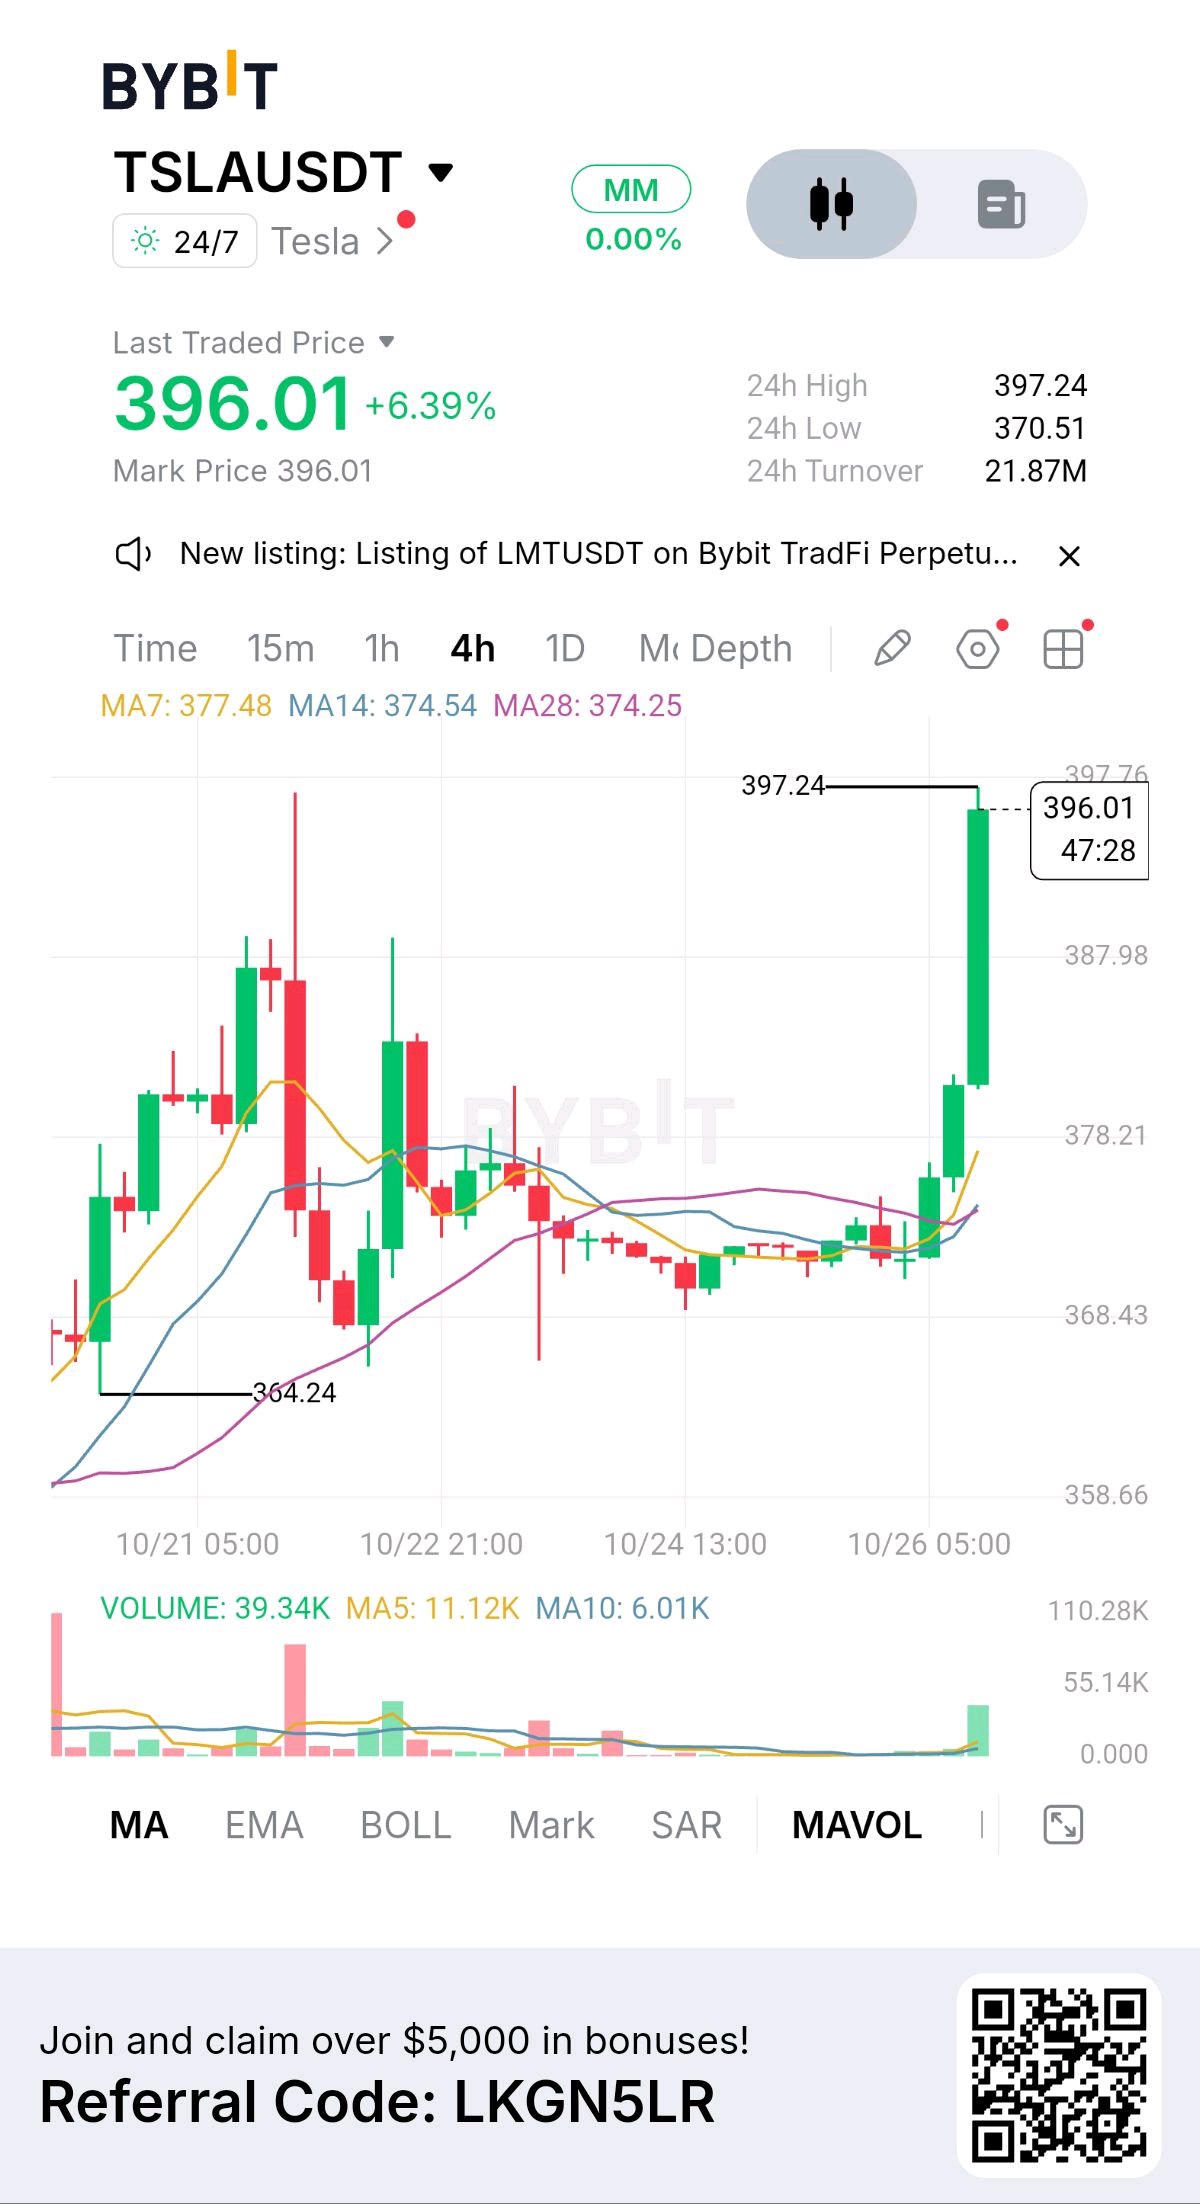
⚡ TESLA (TSLA) SITS AT 396.01 USDT — RAISING (+6.39%) ⚡ Tesla (TSLAUSDT) is trading at 396.01 USDT on the 4H timeframe, executing a massive bullish expansion (+6.39% 24h change) following a prolonged tight consolidation phase above its base at 364.24 USDT. CONSIDERATION Overhead Asks (Resistance): Immediate overhead sell pressure is anchored at the 24h High of 397.24 USDT and the structural resistance level at 397.76 USDT. Underlying Bids (Support): Immediate demand floor sits at 387.98 USDT, backed by key dynamic support at 378.21 USDT and the moving average cluster between 374.25 and 377.48 USDT. Technical Structure: The huge full-bodied 4H green expansion candle has cleanly pulled away from MA7 (377.48 USDT), MA14 (374.54 USDT), and MA28 (374.25 USDT), signaling powerful trend acceleration. VOLUME AND TURNOVER Volume indicator (MAVOL) shows a huge surge with current candle volume reaching 39.34K TSLA, drastically exceeding the MA5 volume (11.12K) and MA10 volume (6.01K). 24h Turnover has climbed to 21.87M USDT, confirming heavy institutional buying momentum. LEVEL TO WATCH 397.24–397.76 USDT (24h High & Key Resistance Zone): A clean 4H close above 397.76 USDT eliminates all immediate overhead supply and triggers price discovery toward 410.00+ USDT. SUPPORT AND RESISTANCE Resistance: 397.24 USDT (24h High), 397.76 USDT (Immediate Resistance Target), 415.00 USDT (Major Expansion Level) Support: 387.98 USDT (Immediate Support), 378.21 USDT (Intermediate Base Support), 374.25 USDT (MA28 / Major Structural Floor) TRADE PLAN Breakout Continuation: Enter on a confirmed 15M/4H candle close above 398.00 USDT, targeting 410.00 USDT and 420.00 USDT. Pullback Entry: Look for a high-volume retest holding the 388.00 USDT support zone before establishing long exposure. Invalidation: A 4H candle close below 368.00 USDT invalidates the immediate bullish breakout structure. INVALIDATION AND RISK NOTE Avoid chasing aggressive market long entries directly at resistance (397.24 USDT) as price is extended away from MA7 (377.48 USDT). The bullish setup is invalidated on a close below 368.00 USDT. 3.0R Setup Example (Pullback Strategy): Entry: 388.00 USDT Stop Loss: 378.00 USDT ($10.00 Risk per TSLA) Take Profit: 418.00 USDT ($30.00 Reward per TSLA) Risk/Reward Ratio: 3.0R $TSLAUSDT #ByXIMPACT