
MARCUS
4441Like0Shares58Fans19Follow
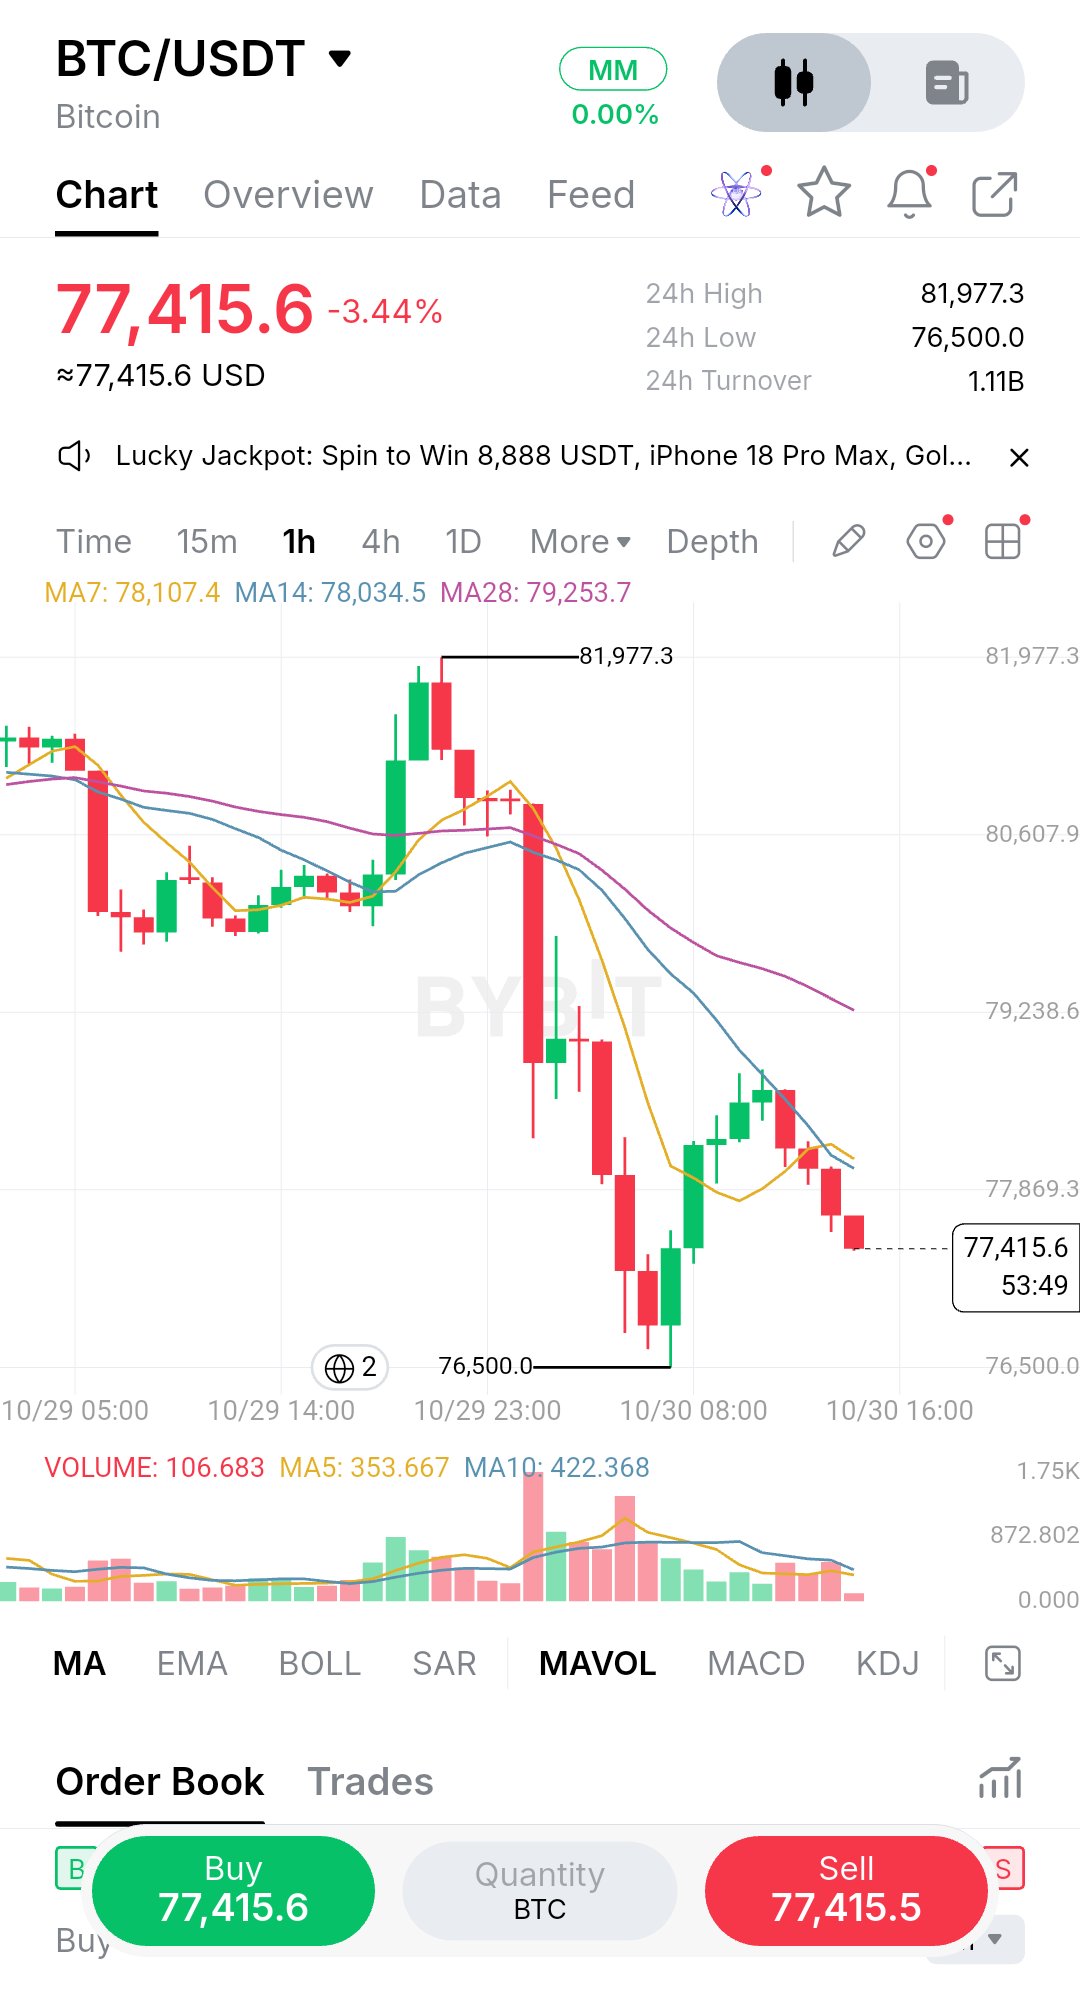
$BTC: Sellers Still Control the 1H Structure — Can Buyers Defend $76,500? Bitcoin's latest recovery attempt is losing momentum, and what concerns me most is that buyers have failed to reclaim the short-term moving-average cluster after the sharp selloff. I’m watching the $76,500 level closely. This is now the most important visible support separating a potential stabilization from another leg of downside pressure. 1. Market Structure — 1H BTC rejected the $81,977.3 swing high and transitioned into a clear bearish structure. The sequence is important: - $81,977.3: Local swing high and rejection point. - Price broke below the $80,607.9 area, accelerating selling pressure. - Sellers pushed BTC down to $76,500. - Buyers attempted a recovery toward the $78K–$78.5K region. - The recovery failed to establish a sustained higher high. - Price rolled over again and is now trading at $77,415.6. For me, this is not yet a confirmed reversal. The latest recovery looks more like a relief bounce within a broader short-term downtrend. 2. Current Market Data - BTC Price: $77,415.6 - 24H Change: -3.44% - 24H High: $81,977.3 - 24H Low: $76,500.0 - 24H Turnover: 1.11B - Timeframe: 1H Moving Averages: - MA7: $78,107.4 - MA14: $78,034.5 - MA28: $79,253.7 BTC is trading below all three moving averages. MA7 and MA14 are clustered around $78K, creating an immediate resistance zone, while MA28 remains considerably higher. This alignment favors sellers until price can reclaim these levels. 3. Volume and Momentum The volume readings deserve attention: - Current Volume: 106.683 - Volume MA5: 353.667 - Volume MA10: 422.368 Current volume is significantly below both volume averages. This suggests participation has cooled during the latest candle. Although sellers still have structural control, I want to see stronger volume confirmation before assuming another aggressive breakdown. RSI and MACD are not displayed in this screenshot, so I won't assign momentum readings that cannot be verified. 4. Important Price Levels Resistance: - $78,034–$78,107: MA14/MA7 resistance cluster. - $79,253.7: MA28 resistance. - $80,607.9: Higher structural resistance. - $81,977.3: Previous swing high. Support: - $77,000 area: Immediate psychological reference. - $76,500: Critical visible swing low. The $76,500 level matters most because a confirmed breakdown would remove the current visible support structure. 5. Three Possible Scenarios Bullish Scenario — Recovery I would become more interested in a bullish setup if BTC: 1. Defends $76,500. 2. Reclaims the $78,034–$78,107 moving-average cluster. 3. Holds above it on a successful retest. 4. Shows improving buying volume. Potential upside levels: - $79,253.7 - $80,607.9 - $81,977.3 A move above these levels would progressively improve the recovery structure. Bearish Scenario — Continuation The bearish scenario remains my primary concern. Confirmation would require: 1. A decisive 1H close below $76,500. 2. Increased selling volume. 3. A failed retest of the broken support. That would suggest sellers are maintaining control and open the possibility of further downside. I would not invent a downside target below $76,500 without additional chart history. Neutral Scenario — Consolidation If BTC continues holding $76,500 but cannot reclaim $78,107, price could remain trapped in a consolidation range. In that situation, I would avoid forcing either direction and wait for a confirmed breakout or breakdown. 6. Macro and Risk Perspective Bitcoin's broader macro sensitivity still matters. Federal Reserve expectations, real Treasury yields, dollar strength, and institutional ETF flows can influence risk appetite and liquidity conditions. However, this chart alone does not establish whether those factors are currently supporting or pressuring BTC. I would not attribute this particular selloff to a macro catalyst without verified evidence. From a risk-management perspective, I would avoid chasing shorts directly into $76,500 support or opening longs while BTC remains below its moving averages. Position size should reflect the distance to invalidation, not the excitement of a potential move. Capital preservation comes before catching every candle. 7. My Final Market Assessment Current control: Sellers. BTC has lost its short-term moving-average structure, failed to sustain its recovery, and returned toward the lower end of its recent trading range. The level I am watching most closely is $76,500. A defended support followed by a reclaim of $78,107 could create a meaningful recovery opportunity. A confirmed breakdown below $76,500 would strengthen the bearish case. For now, my approach is WAIT FOR CONFIRMATION. I would rather miss the first part of a move than enter before the market reveals its direction. One question for the community: Do you think $76,500 will become the foundation for Bitcoin's next recovery, or are sellers preparing to push BTC into another leg lower? #ByXIMPACT $BTCUSDT
$BNB is showing a sharp shift in short-term momentum. After reaching $762.18 and attempting another recovery toward the $759 area, price has been hit by a strong bearish candle that pushed it down to $746.04. What stands out to me is the loss of the entire moving-average cluster. Buyers managed to recover after the first rejection, but the latest selloff has erased that recovery. I want to see whether BNB produces a failed reclaim before committing to a short. ### 1H Market Structure BNB started from the $739.76 low and recovered through several resistance levels before accelerating toward $762.18. The rejection from that high triggered a sharp pullback. Buyers attempted to stabilize the structure around $748–$750 and pushed price back toward $759, but sellers returned aggressively. The latest candle broke through MA7, MA14, and MA28, bringing price down to $746.04. The small green candle afterward shows an initial bounce, but it is not enough to confirm a reversal. ### Current Data - Price: $746.04 - 24H Change: +0.21% - 24H High: $762.18 - 24H Low: $743.76 - 24H Turnover: $34.43M - MA7: $753.63 - MA14: $751.87 - MA28: $750.35 - 1H Volume: 1.11K - Volume MA5: 1.39K - Volume MA10: 1.72K ### Key Levels - Immediate resistance: $750.35 - MA14 resistance: $751.87 - MA7 resistance: $753.63 - Recent recovery resistance: $756.39 - Immediate support: $743.76 - Previous structural low: $739.76 ### What I Like - Price has broken below all three moving averages. - The latest bearish candle shows a decisive rejection from the recovery zone. - The $750.35–$753.63 area provides a clear resistance zone to monitor on a rebound. - The $743.76 low offers a nearby downside reference if sellers maintain control. ### What I Don’t Like - Current 1H volume is 1.11K, below MA5 at 1.39K and MA10 at 1.72K. Selling participation has not exceeded its recent averages. - Price is already close to the $743.76 support, so chasing the current move could offer an unattractive entry. - The small green candle suggests buyers are attempting to respond, although confirmation is still missing. ### My Plan: WAIT FOR CONFIRMATION **Preferred setup — Conditional SHORT** I want BNB to rebound into the broken moving-average zone and fail to reclaim it. A rejection would provide better confirmation than entering immediately after the large bearish candle. **Entry:** $750.30–$752.00 after a confirmed rejection. **Stop-loss:** $754.20 **TP1:** $746.00 **TP2:** $743.76 **TP3:** $739.76 Using an illustrative entry of $751.00 with a stop at $754.20, the approximate reward-to-risk ratios are: - TP1: 1.6R - TP2: 2.3R - TP3: 3.5R These levels are conditional, based on the visible chart, and do not guarantee execution or outcomes. **Invalidation:** A sustained reclaim above $754.20 would cancel this short setup and require a fresh assessment. If TP1 hits, I would consider taking partial profit and reducing risk. If BNB drops straight through $743.76 without a retest, I won't chase. **Alternative scenario — Bullish recovery** If buyers reclaim $750.35–$753.63 and hold above the moving-average cluster, the immediate bearish thesis would weaken. A further recovery toward $756.39 would then become worth monitoring, provided price structure and participation support it. ### Final Take BNB has shifted from recovery to a sharp short-term breakdown, but the next move matters more than the size of the red candle. I’m watching the $750.35–$753.63 zone closely. **If the bounce fails there, the short becomes more structured. If buyers reclaim and hold the zone, I’ll reassess rather than force a bearish trade.** Confirmation first, execution second. #ByXIMPACT $BNBUSDT

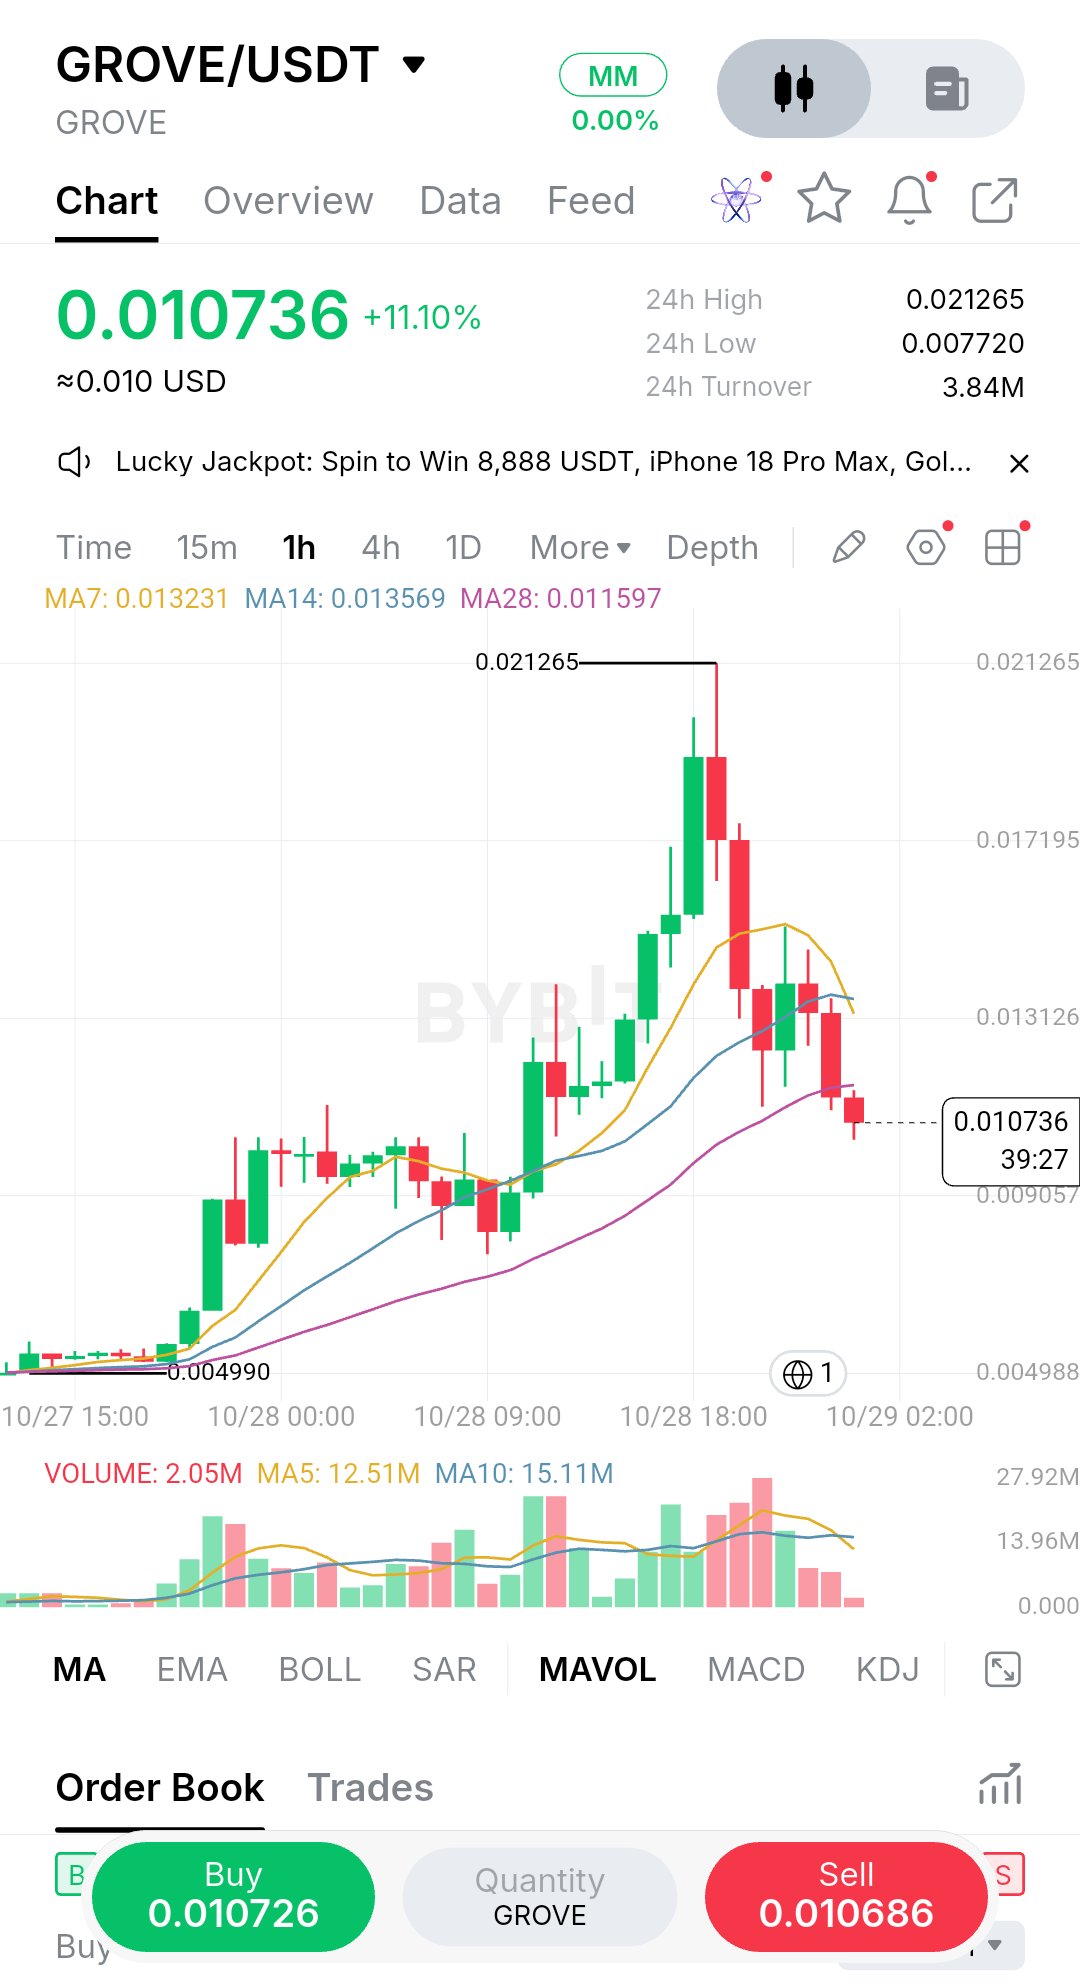
$GROVE is showing the downside of chasing a vertical rally. After climbing from $0.004990 to a $0.021265 high, price has reversed sharply to $0.010736. The important detail for me is that the rebound attempts are failing while price remains below all three short-term moving averages. I’m not looking to short simply because the chart looks weak. I want to see whether GROVE produces a failed reclaim that gives sellers another opportunity to take control. 1H Market Structure GROVE built a base around $0.004990 before accelerating into a powerful rally toward $0.021265. That expansion attracted strong participation, but the move has since reversed. Price fell back through the MA7, MA14, and MA28, attempted a rebound around the $0.0130–$0.0140 area, and then rolled over again. The latest price is $0.010736, below the entire moving-average cluster. Short-term structure is bearish, but after such a sharp decline, entering late could leave limited room before support. Current Data - Price: $0.010736 - 24H Change: +11.10% - 24H High: $0.021265 - 24H Low: $0.007720 - 24H Turnover: $3.84M - MA7: $0.013231 - MA14: $0.013569 - MA28: $0.011597 - 1H Volume: 2.05M - Volume MA5: 12.51M - Volume MA10: 15.11M Key Levels - Immediate resistance: $0.011597 - Moving-average resistance zone: $0.011597–$0.013569 - First recovery hurdle: $0.013231 - Near-term support: $0.009057 - Major visible support: $0.007720 - Previous rally origin: $0.004990 What I Like - Price has lost the short-term moving-average cluster. - The attempted rebound failed to restore bullish structure. - MA7 is below neither MA14 nor MA28 at present? No—the displayed values show MA7 at $0.013231, MA14 at $0.013569, and MA28 at $0.011597. This places price below all three averages, with the short-term averages still showing a damaged recovery structure. - The chart offers a clear conditional setup if price retests resistance and sellers defend it. What I Don’t Like - The latest 1H volume is only 2.05M, below MA5 at 12.51M and MA10 at 15.11M. Selling pressure is visible in the candles, but participation has contracted sharply relative to recent averages. - Price is already well below the moving averages, making a late short vulnerable to a relief bounce. - The $0.009057 area could attract buyers before the larger $0.007720 low is tested. - GROVE remains up 11.10% over 24 hours despite the sharp reversal, so volatility and sudden rebounds remain important risks. My Plan: WAIT FOR CONFIRMATION Preferred setup — Conditional SHORT I want price to rebound into resistance, fail to reclaim it, and then show renewed selling pressure. I would not chase the current downside candle. Entry: $0.011500–$0.011900 after a confirmed rejection. Stop-loss: $0.012400 TP1: $0.010000 TP2: $0.009057 TP3: $0.007720 Using an illustrative entry of $0.011700 and a stop at $0.012400, the approximate reward-to-risk ratios are: - TP1: 2.4R - TP2: 3.8R - TP3: 5.7R These are conditional levels based on the visible chart, not guaranteed outcomes. Actual execution, slippage, and fees can change the ratios. Invalidation: A sustained reclaim above $0.012400 would cancel this short setup and require a fresh assessment. If TP1 hits, I would consider taking partial profit and reducing risk. If GROVE drops directly toward $0.009057 without offering a retest, I won't chase. Alternative scenario — Bullish recovery If buyers reclaim $0.011597 and hold above it, I would watch whether price can recover the $0.013231–$0.013569 zone. That would be an early sign of stabilization, although a stronger structural recovery would still need confirmation. Final Take GROVE has shifted from aggressive expansion to a sharp correction. The moving-average structure favors caution on the long side, but the decline is already extended and volume has cooled significantly. My focus is on the next reaction at resistance. A failed bounce offers a more controlled short setup than selling after the market has already fallen this far. #ByXIMPACT $GROVEUSDT
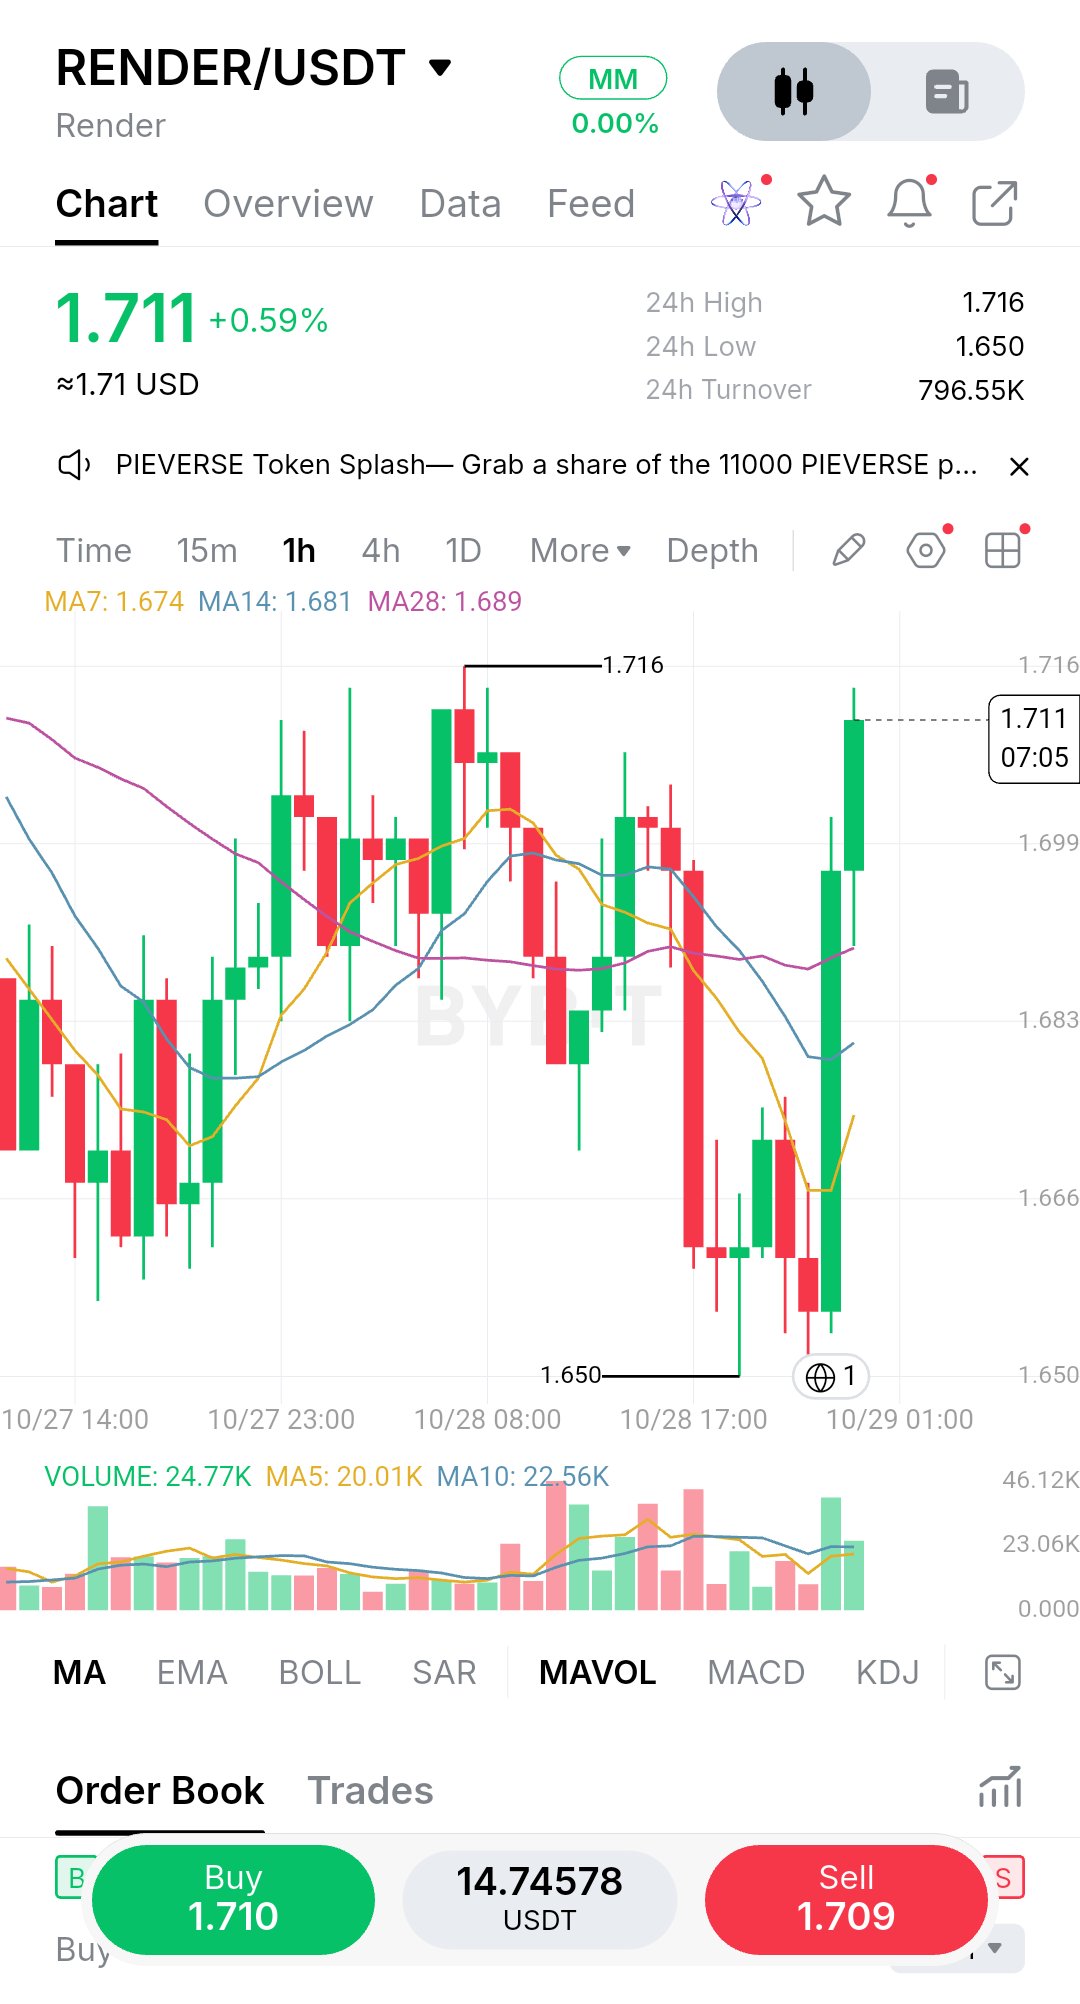
$RENDER is showing a sharp recovery from $1.650, but I’m watching whether this move can hold above the moving-average cluster rather than treating the latest green candles as a confirmed breakout. Price has pushed back to $1.711, bringing the $1.716 resistance into immediate focus. 1H Market Structure RENDER recovered from the $1.650 low after a sharp sell-off pushed price below the short-term moving averages. Buyers then stepped in aggressively, driving price back through MA7, MA14, and MA28. The recovery is strong, but price is now approaching the visible $1.716 high. I want to see whether buyers can hold the reclaimed levels on a pullback or whether this move gets rejected near resistance. Current Data - Price: $1.711 - 24H Change: +0.59% - 24H High: $1.716 - 24H Low: $1.650 - 24H Turnover: $796.55K - MA7: $1.674 - MA14: $1.681 - MA28: $1.689 - 1H Volume: 24.77K - Volume MA5: 20.01K - Volume MA10: 22.56K Key Levels - Immediate resistance: $1.716 - Breakout confirmation: Sustained hold above $1.716 - First support: $1.699 - Moving-average support zone: $1.689–$1.681 - Major support: $1.666 - Structural low: $1.650 What I Like - Price has reclaimed all three moving averages. - The recovery from $1.650 shows a clear shift in short-term momentum. - Current volume of 24.77K is above MA5 at 20.01K and MA10 at 22.56K, suggesting participation has improved alongside the rebound. - Buyers are challenging resistance rather than remaining trapped below the moving averages. What I Don’t Like - Price is approaching $1.716 resistance, where a rejection could trigger another pullback. - The recovery has been very sharp, so chasing the current candle offers limited room before resistance. - One strong recovery candle does not establish that the breakout will hold. My Plan: WAIT FOR CONFIRMATION Preferred setup — Conditional LONG I want a confirmed breakout or a successful retest before committing. My preferred approach is to let price establish support instead of buying directly into resistance. Entry: $1.699–$1.705 after a successful retest and bullish confirmation. Stop-loss: $1.688 TP1: $1.716 TP2: $1.730 TP3: $1.745 Using an illustrative entry of $1.702 and stop at $1.688, the approximate reward-to-risk ratios are: - TP1: 1.0R - TP2: 2.0R - TP3: 3.1R These targets are conditional planning levels, not guaranteed outcomes. Invalidation: A sustained move below $1.688 would weaken the immediate bullish setup and cancel this entry plan. If TP1 hits, I would consider taking partial profit and reducing risk. If RENDER breaks higher without offering a retest, I won't chase. Alternative scenario — Failed breakout If price rejects $1.716 and falls back below $1.699, I would watch whether the $1.689–$1.681 moving-average zone can hold. A failed reclaim followed by continued selling could open a move toward $1.666. Final Take RENDER has recovered its short-term structure, and volume is supporting the rebound. The next test is whether buyers can turn $1.716 resistance into support. I'm bullish on the recovery, but I want confirmation before entering. A breakout that holds is more valuable than a green candle that simply looks strong. #ByXIMPACT $RENDERUSDT
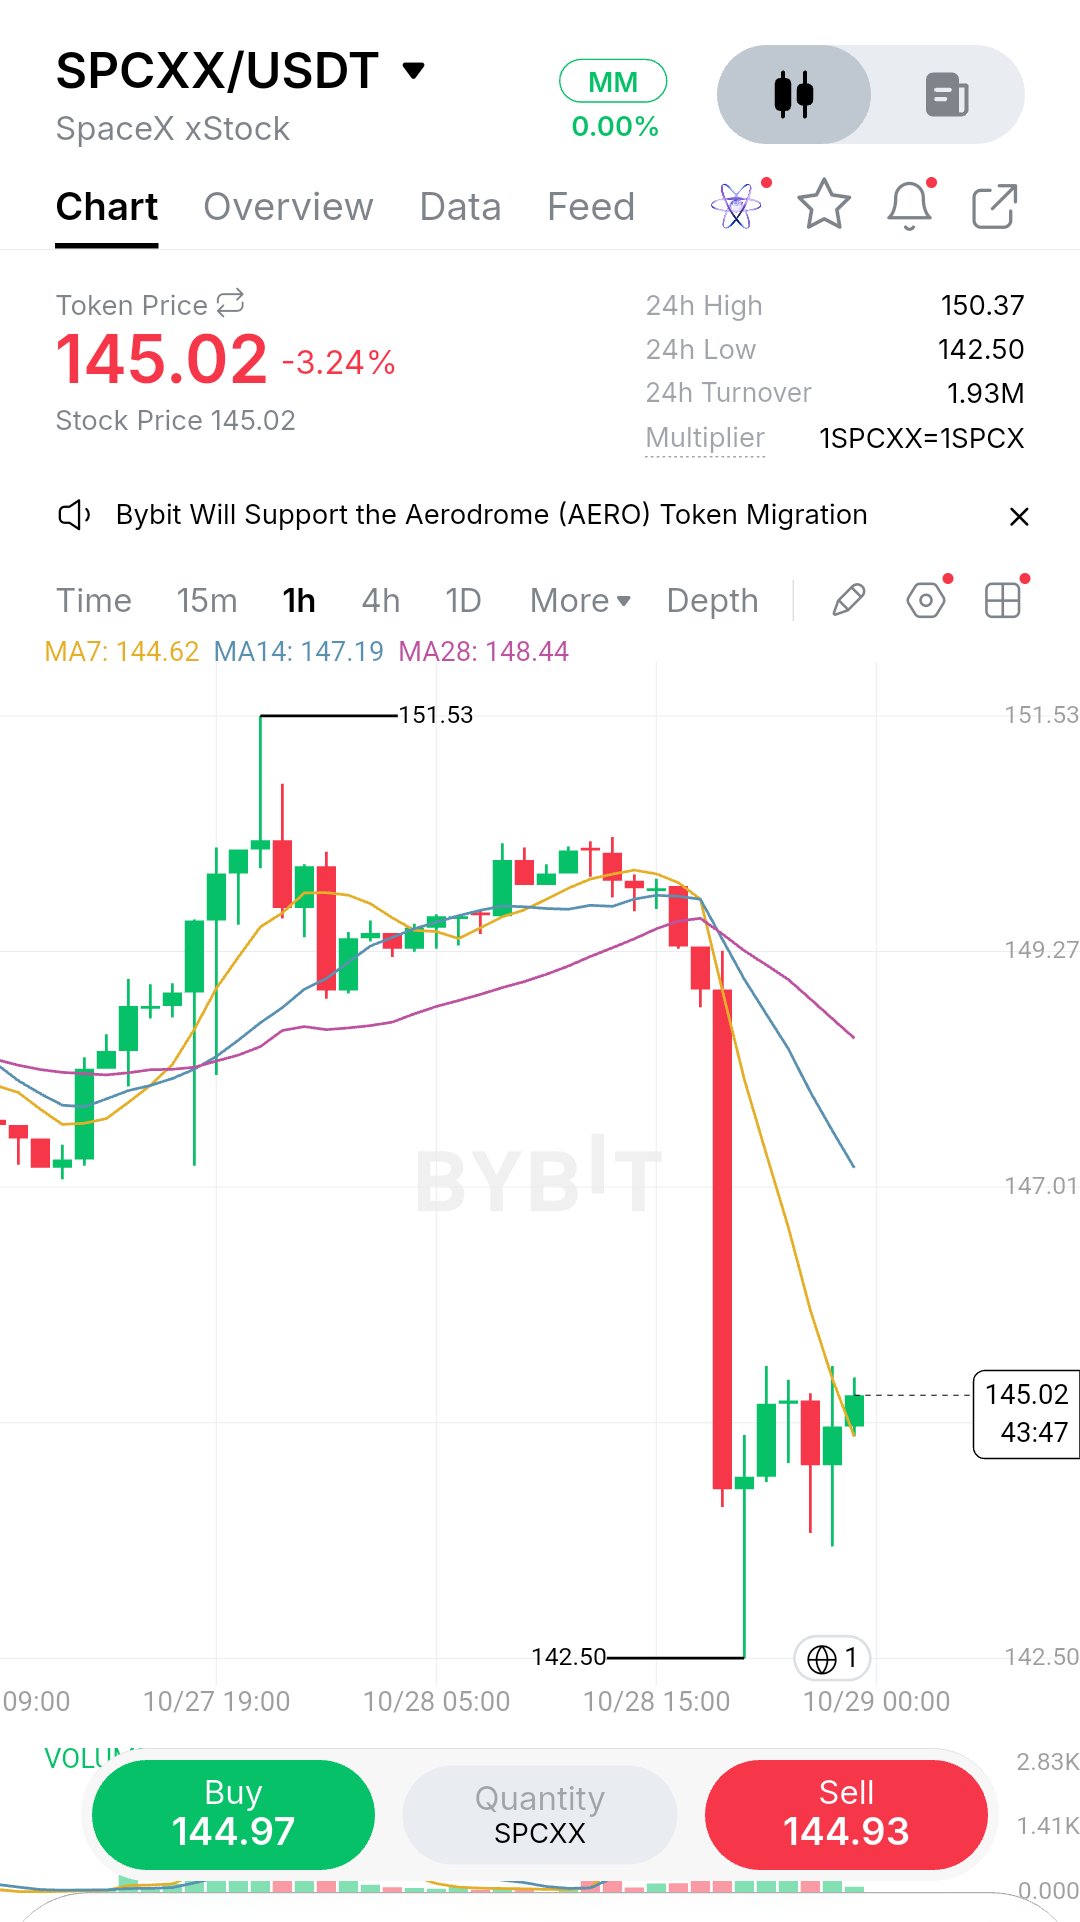
$SPCXX just experienced a sharp breakdown, and the bounce from $142.50 is the part I’m watching carefully. Price has recovered to $145.02, but it remains well below the moving-average cluster that previously supported the rally. For me, this is a potential failed-reclaim setup—not a confirmed short entry yet. ### 1H Market Structure SPCXX climbed toward the $151.53 high before momentum weakened and price began rolling over. Sellers then drove a sharp breakdown from the $149 area, pushing price toward $143 before buyers attempted a recovery. The latest rebound has reached $145.02, but the broader structure remains bearish. **Current Data** - Price: $145.02 - 24H Change: -3.24% - 24H High: $150.37 - 24H Low: $142.50 - 24H Turnover: $1.93M - MA7: $144.62 - MA14: $147.19 - MA28: $148.44 ### Key Levels - Immediate resistance: $145.50–$146.00 - Reclaim zone: $147.01–$147.19 - Major resistance: $148.44–$149.27 - Immediate support: $144.00 - Critical support: $142.50 ### What I Like - The $142.50 low triggered a visible recovery attempt. - Price has reclaimed MA7 at $144.62. - The gap between current price and MA14/MA28 leaves a clear resistance area to monitor for a potential failed bounce. ### What I Don’t Like - The breakdown candle was exceptionally large relative to the preceding candles. - Price remains below MA14 at $147.19 and MA28 at $148.44. - The screenshot does not provide readable current volume values, so I cannot reliably compare participation against MA5 and MA10. ### My Plan: WAIT FOR CONFIRMATION **Preferred setup — Conditional SHORT** I don't want to sell directly into the lows after such an aggressive decline. I want price to bounce into resistance and show that buyers cannot reclaim it. **Entry:** $145.50–$147.00 after a confirmed rejection. **Stop-loss:** $147.60 **TP1:** $144.00 **TP2:** $143.20 **TP3:** $142.50 Using an illustrative entry of $146.00 and a stop at $147.60, the approximate reward-to-risk ratios are: - TP1: 1.25R - TP2: 1.75R - TP3: 2.19R **Invalidation:** A sustained reclaim above $147.60 cancels this short thesis. If TP1 hits, I would consider taking partial profit and reducing risk. If price falls straight toward $142.50 without retesting the entry zone, I won't chase. **Alternative scenario — Bullish stabilization** If SPCXX reclaims $147.01–$147.19 and holds that zone on a retest, I would reassess the short. A stronger recovery could open a move toward MA28 at $148.44 and the $149.27 resistance area. ### Final Take The breakdown has changed the short-term structure, but the bounce is now testing whether sellers can defend the recovery zone. I want the failed reclaim to confirm the setup before committing capital. **The objective isn't to catch the entire decline. It's to identify the next high-quality entry, define the invalidation, and let price confirm the trade.** #ByXIMPACT $SPCXXUSDT
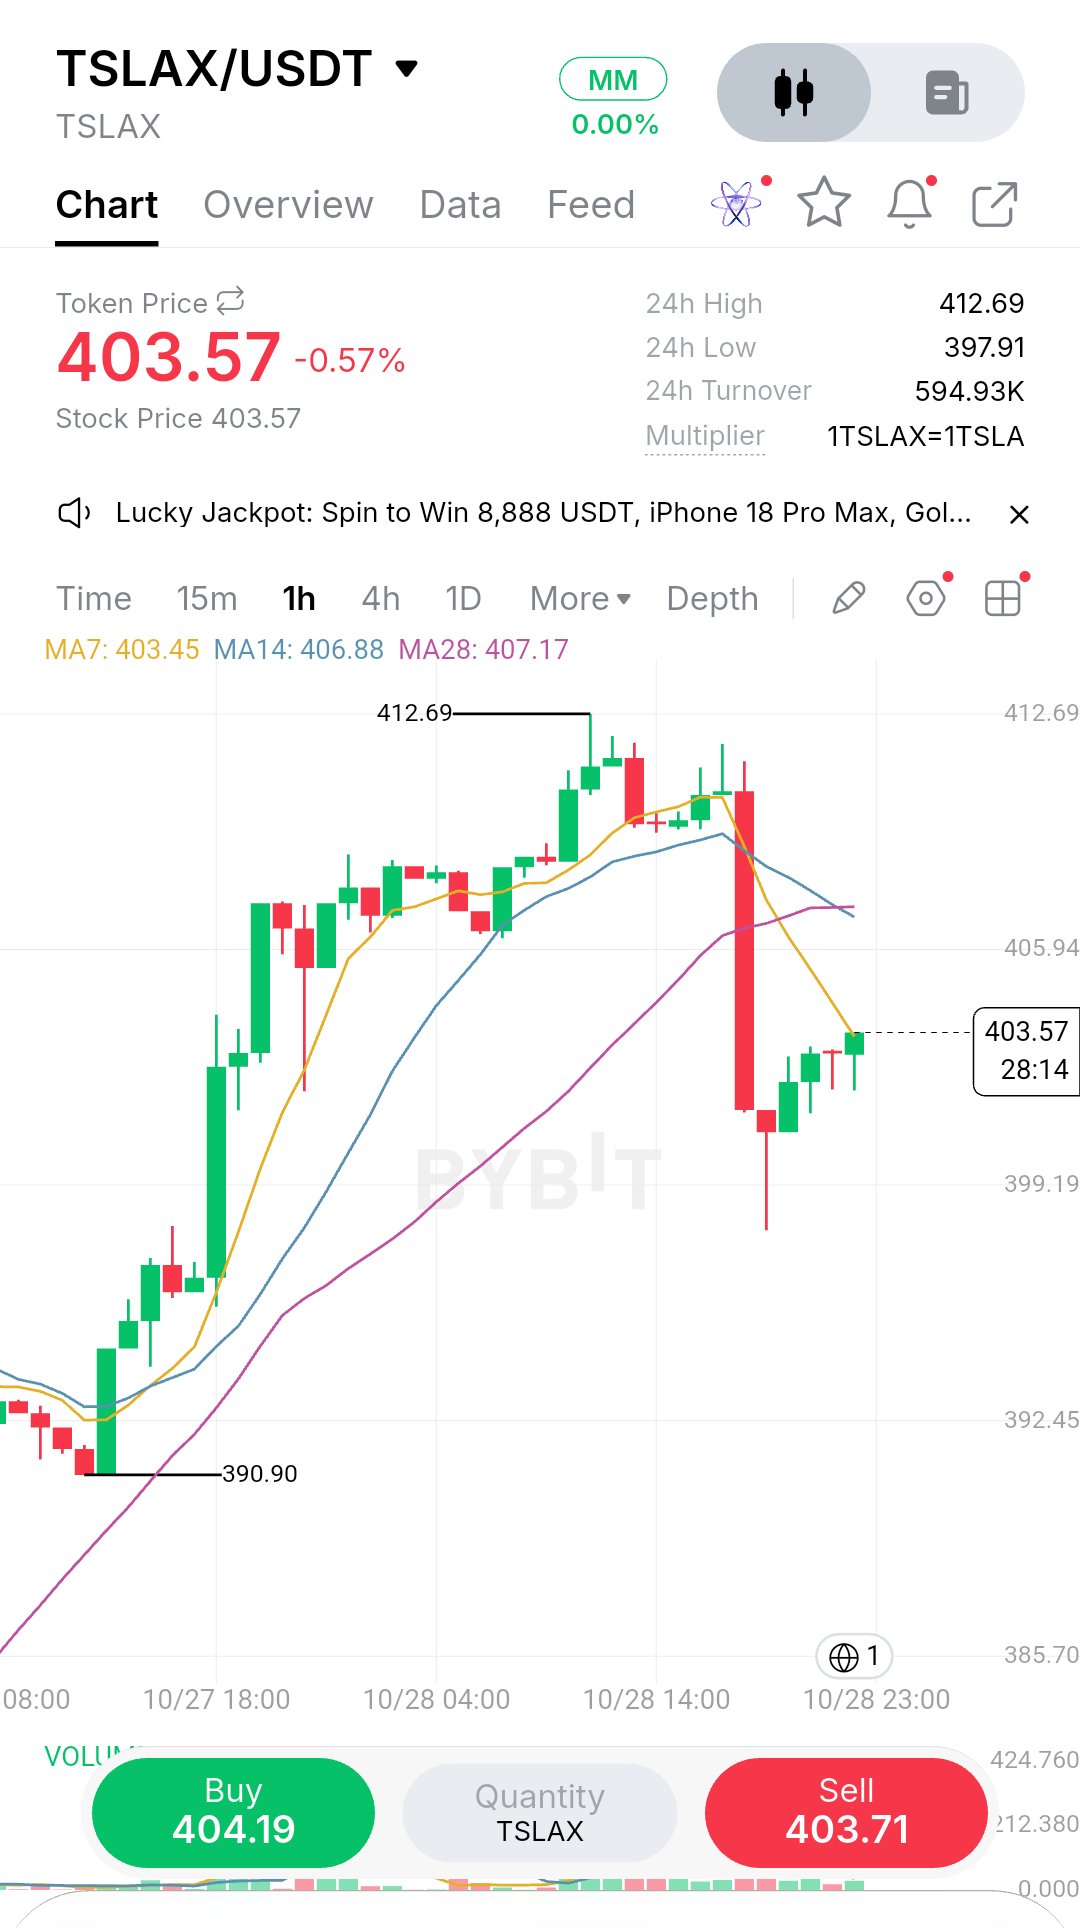
$TSLAX has suffered a sharp 1H breakdown, and the current bounce is the part I’m watching most closely. Price dropped from the $408–$410 area toward $401 before recovering to $403.57. That recovery is encouraging, but it has not yet repaired the structure sellers broke. 1H Market Structure TSLAX rallied from $390.90 to a session high of $412.69, forming a strong recovery. After consolidating near the highs, price experienced a sharp sell-off that broke below the short-term moving averages. The latest rebound has brought price back toward MA7, but the broader moving-average structure remains weak. - Price: $403.57 - MA7: $403.45 - MA14: $406.88 - MA28: $407.17 - 24H High: $412.69 - 24H Low: $397.91 - 24H Change: -0.57% - 24H Turnover: $594.93K Key Levels - Immediate resistance: $403.50–$404.20 - Reclaim zone: $406.88–$407.17 - Major resistance: $408.00–$410.00 - Immediate support: $401.00–$402.00 - Critical support: $397.91 - Earlier structural low: $390.90 What I Like - Buyers responded after the sharp decline and recovered some lost ground. - Price is testing MA7 near $403.45, providing a clear short-term decision point. - The $397.91 low offers a visible downside reference if selling resumes. What I Don’t Like - Price remains below MA14 and MA28, which are clustered around $407. - The rebound has not reclaimed the breakdown area convincingly. - The screenshot does not provide readable volume figures, so I cannot confirm whether the sell-off was accompanied by above-average participation. My Plan: WAIT FOR CONFIRMATION Preferred setup — Conditional SHORT I do not want to short the low after the initial breakdown. I want to see whether this recovery fails beneath resistance. Entry: $405.50–$407.00 after a confirmed rejection. Stop-loss: $408.50 TP1: $402.00 TP2: $399.50 TP3: $397.91 Using an illustrative entry of $406.00 and stop at $408.50, the approximate reward-to-risk ratios are: - TP1: 1.6R - TP2: 2.6R - TP3: 3.2R Invalidation: A sustained reclaim above $408.50 cancels this short thesis. If TP1 hits, I would consider taking partial profit and reducing risk. If price falls directly toward $397.91 without retesting resistance, I will not chase. Alternative scenario — Bullish recovery If TSLAX reclaims $406.88–$407.17 and holds that area on a retest, I would reassess the bearish setup. A sustained recovery could open a move toward $408–$410 and potentially the $412.69 high. Final Take The breakdown is clear, but the bounce is not yet a reversal. I want to see whether buyers can reclaim the $407 area or whether the recovery becomes a failed bounce beneath resistance. My preference is to trade the confirmed rejection, not the panic candle. Define the risk first, take partial profits at planned levels, and never chase an extended move. This is a conditional technical scenario based on the supplied 1H chart, not a guaranteed outcome. #ByXIMPACT $TSLAXUSDT
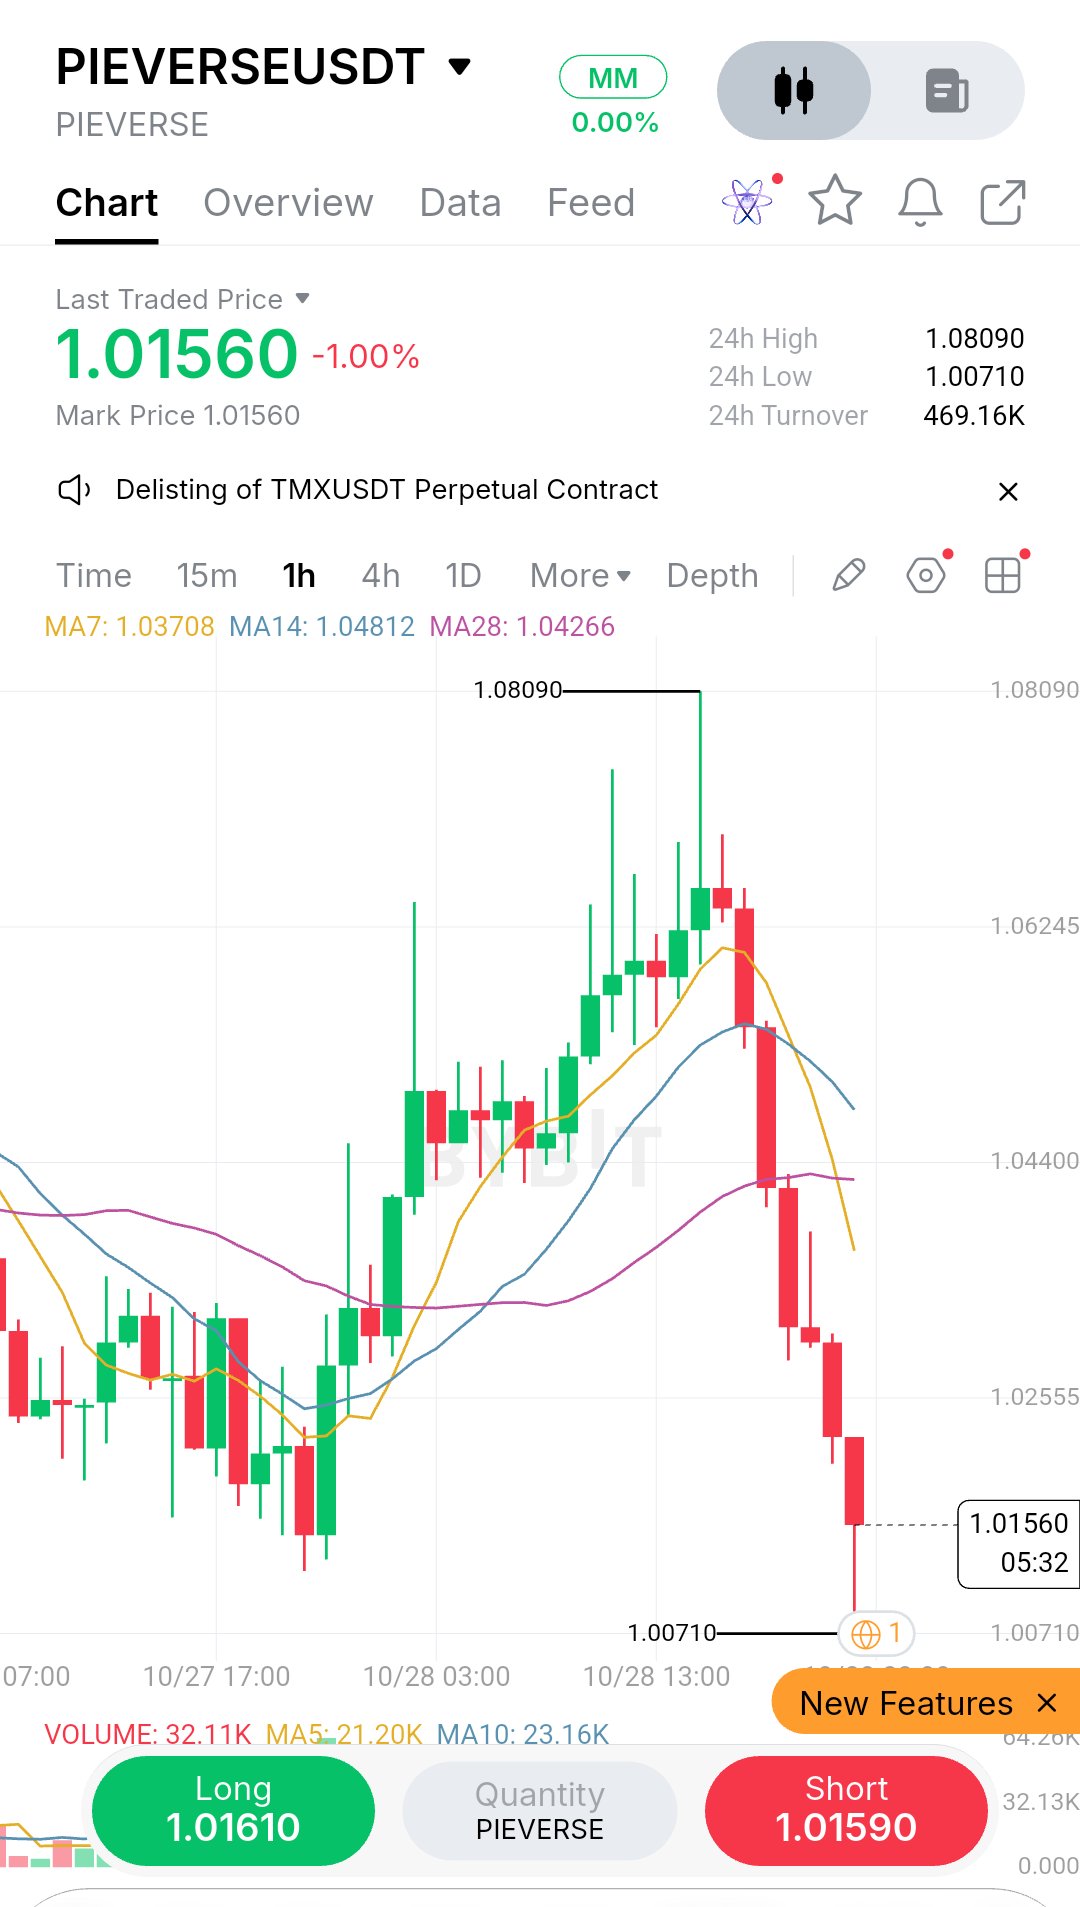
$PIEVERSE is showing a sharp breakdown, and I’m not interested in chasing the red candles at the current price. The important detail on the 1H chart is the loss of the moving-average structure after rejection near $1.08090. Sellers have pushed price down to $1.01560, with the market now approaching the visible $1.00710 low. ### 1H Market Structure PIEVERSE rallied toward $1.08090 before momentum reversed. Price then lost the short-term moving averages, broke below the $1.04400 area, and accelerated through $1.02555. The current structure is bearish: - MA7: $1.03708 - MA14: $1.04812 - MA28: $1.04266 Price is below all three moving averages, with MA7 below MA28 and MA14. The recovery structure has deteriorated, but price is now close to support, where a fresh short entry could offer poor risk/reward. ### Current Data - Price: $1.01560 - 24H Change: -1.00% - 24H High: $1.08090 - 24H Low: $1.00710 - 24H Turnover: $469.16K - Volume: 32.11K - Volume MA5: 21.20K - Volume MA10: 23.16K ### Volume & Participation Unlike a breakdown without participation, the displayed volume is currently above both MA5 and MA10. Selling pressure is therefore accompanied by increased activity relative to the recent averages. However, the screenshot shows the current candle still forming, so the final volume and closing price may change. I want to see whether sellers can maintain pressure after a bounce rather than assume the move must continue lower. ### Key Levels - Immediate resistance: $1.02555 - Reclaim zone: $1.03708–$1.04400 - Higher resistance: $1.04812 - Immediate support: $1.00710 - Breakdown confirmation: A decisive move below $1.00710 ### My Plan: WAIT FOR CONFIRMATION **Preferred setup — Conditional SHORT** I do not want to short directly into the $1.00710 support area after such an extended decline. Entry: $1.02500–$1.03700, only after a failed reclaim and confirmed rejection. Stop-loss: $1.04450 TP1: $1.01560 TP2: $1.00710 TP3: $0.99500, conditional on a confirmed breakdown below $1.00710. Using an illustrative entry of $1.03100 and stop at $1.04450, the approximate reward-to-risk ratios are: - TP1: 1.14R - TP2: 1.77R - TP3: 2.67R These targets are conditional scenarios, not guaranteed outcomes. TP3 is below the visible chart range and would require fresh price confirmation. **Invalidation:** A sustained reclaim above $1.04450 cancels this short setup. If TP1 hits, I would consider taking partial profit and reducing risk. If price breaks directly below $1.00710 without a retest, I will not chase the move. **Alternative scenario — Support recovery** If $1.00710 holds and price reclaims $1.02555, I would watch for stabilization. A stronger reclaim toward $1.03708–$1.04400 could indicate that selling pressure is easing. ### Final Take The bearish structure is clear, and volume is running above its recent averages. But the distance already traveled matters: entering late near support can turn a good directional read into a poor trade. I want the failed bounce into resistance, followed by confirmation from sellers. **My approach: let price return to the setup. Define the risk first. Never chase the candle.** #ByXIMPACT $PIEVERSEUSDT
$BILL is showing the kind of rebound I want to evaluate carefully: buyers pushed price toward $0.00630, but sellers immediately erased most of that move. For me, the key question is whether this becomes a failed reclaim or simply a pause before another recovery attempt. 1H Market Structure BILL recovered from $0.00573 and rallied to $0.00639 before losing momentum. Price then retraced toward $0.00600, bounced sharply toward $0.00630, and faced another strong rejection. Price is now at $0.00613, sitting around MA7 at $0.00612 and MA14 at $0.00613, while remaining below MA28 at $0.00616. The moving averages are compressed around the current price. That makes the next reclaim or rejection more important than the latest candle alone. Current Data - Price: $0.00613 - 24H Change: +0.16% - 24H High: $0.00639 - 24H Low: $0.00598 - 24H Turnover: $1.62M - MA7: $0.00612 - MA14: $0.00613 - MA28: $0.00616 - Volume: 3.74M - Volume MA5: 16.25M - Volume MA10: 12.04M Volume & Participation The recent candles show a clear rejection after the rebound, but volume is not confirming a strong expansion in selling participation. Current volume is 3.74M, well below MA5 at 16.25M and MA10 at 12.04M. This makes me cautious about treating the rejection as a confirmed breakdown. I want to see how price reacts at resistance before committing to a short. Key Levels - Resistance zone: $0.00616–$0.00622 - Rejection area: $0.00630 - Major resistance: $0.00639 - Immediate support: $0.00606 - Breakdown confirmation: $0.00598 - Major structural support: $0.00573 My Plan: WAIT FOR CONFIRMATION Preferred setup — Conditional SHORT Entry: $0.00616–$0.00622 after a failed reclaim and confirmed rejection. Stop-loss: $0.00630 TP1: $0.00606 TP2: $0.00598 TP3: $0.00573 Using a $0.00619 entry and $0.00630 stop, the approximate reward-to-risk ratios are: - TP1: 1.2R - TP2: 1.9R - TP3: 4.2R Invalidation: A sustained reclaim above $0.00630 weakens the short thesis and cancels this setup. If TP1 hits, I would consider taking partial profit and reducing risk. If BILL drops straight through support without retesting the entry zone, I won't chase it. Alternative scenario — Bullish reclaim If price reclaims $0.00622 and holds above it on a retest, I would reconsider the short. A stronger recovery could open another test of $0.00630, followed by $0.00639 if buyers sustain momentum. Final Take I'm not interested in shorting simply because the latest candle is red. The rejection is visible, but volume remains below its recent averages, and price is still holding around the short-term moving averages. I want the failed bounce, not the extended sell-off. Confirmation first. Risk defined before entry. No chasing. #ByXIMPACT $BILLUSDT

The sharp reversal on $SUI is the detail I’m focused on here. Price climbed to $0.94770, but sellers erased much of that advance in a powerful bearish candle. The bounce from the lower wick is encouraging, yet I need to see whether buyers can reclaim resistance before calling this a recovery. On the 1H chart, SUI recovered from $0.90040, established higher highs, and then rejected the $0.94770 peak. Price is now $0.92550, below MA7 at $0.93180 and MA14 at $0.93462, while sitting below MA28 at $0.93003. The short-term structure has weakened, and the $0.91650 area is the next important support. Volume is 1.18M, below MA5 at 2.20M and MA10 at 1.77M. The breakdown was sharp, but participation has since cooled. I don’t want to enter short after the move has already extended. My preferred setup is a conditional SHORT: Entry: $0.9300–$0.9340 after rejection Stop: $0.9390 TP1: $0.9200 TP2: $0.9165 TP3: $0.9070 R:R: Approximately 1.1R–3.0R from a $0.9320 entry. Invalidation: A sustained reclaim above $0.9390 cancels the short thesis. If TP1 hits, I’d consider taking partial profit and reducing risk. If SUI drops without a retest, I won’t chase. The alternative is a reclaim of $0.9346 followed by a successful hold, which could restore bullish momentum. I’ve learned that after a violent candle, the next retest often gives a cleaner signal than the initial move. #ByXIMPACT $SUIUSDT

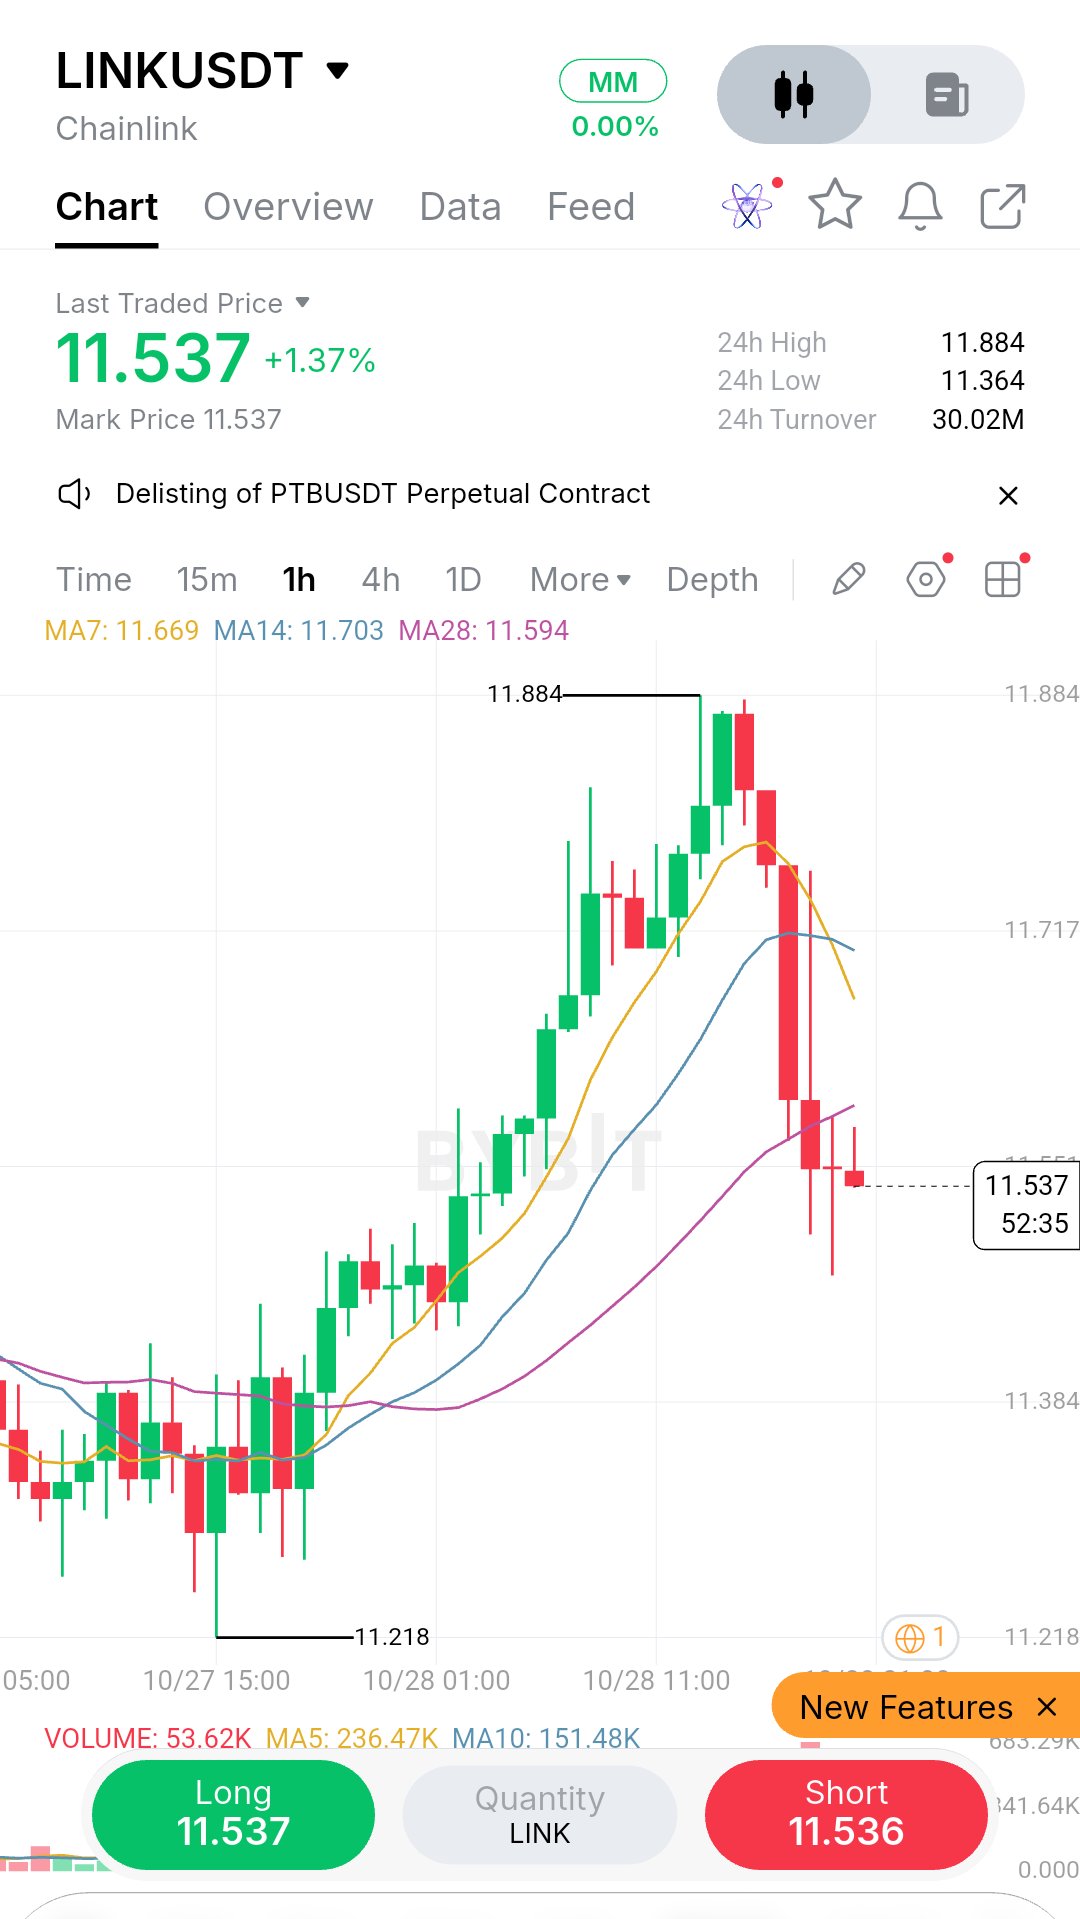
The part of $LINK that concerns me is how quickly the rally toward $11.884 turned into a sharp sell-off. Buyers controlled the earlier advance, but the latest candles have broken that momentum, and I want to see whether sellers can defend a failed reclaim. On the 1H chart, LINK climbed from $11.218 to $11.884 before reversing aggressively. Price is now $11.537, below MA7 at $11.669 and MA14 at $11.703, while sitting just below MA28 at $11.594. The short-term structure has weakened considerably, and the next question is whether $11.50 can hold. Volume reinforces my caution: the latest reading is 53.62K, compared with MA5 at 236.47K and MA10 at 151.48K. The sell-off is clear in the candles, but the displayed volume is now subdued, so I want confirmation rather than an impulsive short. My preferred setup is a conditional SHORT: Entry: $11.59–$11.67 after rejection Stop: $11.76 TP1: $11.50 TP2: $11.364 TP3: $11.218 R:R: Approximately 1.1R–3.5R from an $11.63 entry. Invalidation: A sustained reclaim above $11.76 cancels the short thesis. If TP1 hits, I’d consider taking partial profit and reducing risk. If LINK drops without a retest, I won’t chase. The alternative is a reclaim of $11.67 followed by a successful hold, which could signal stabilization. I’ve learned that after a sharp reversal, patience is especially valuable: the failed bounce often provides a clearer entry than the initial breakdown. #ByXIMPACT $LINKUSDT
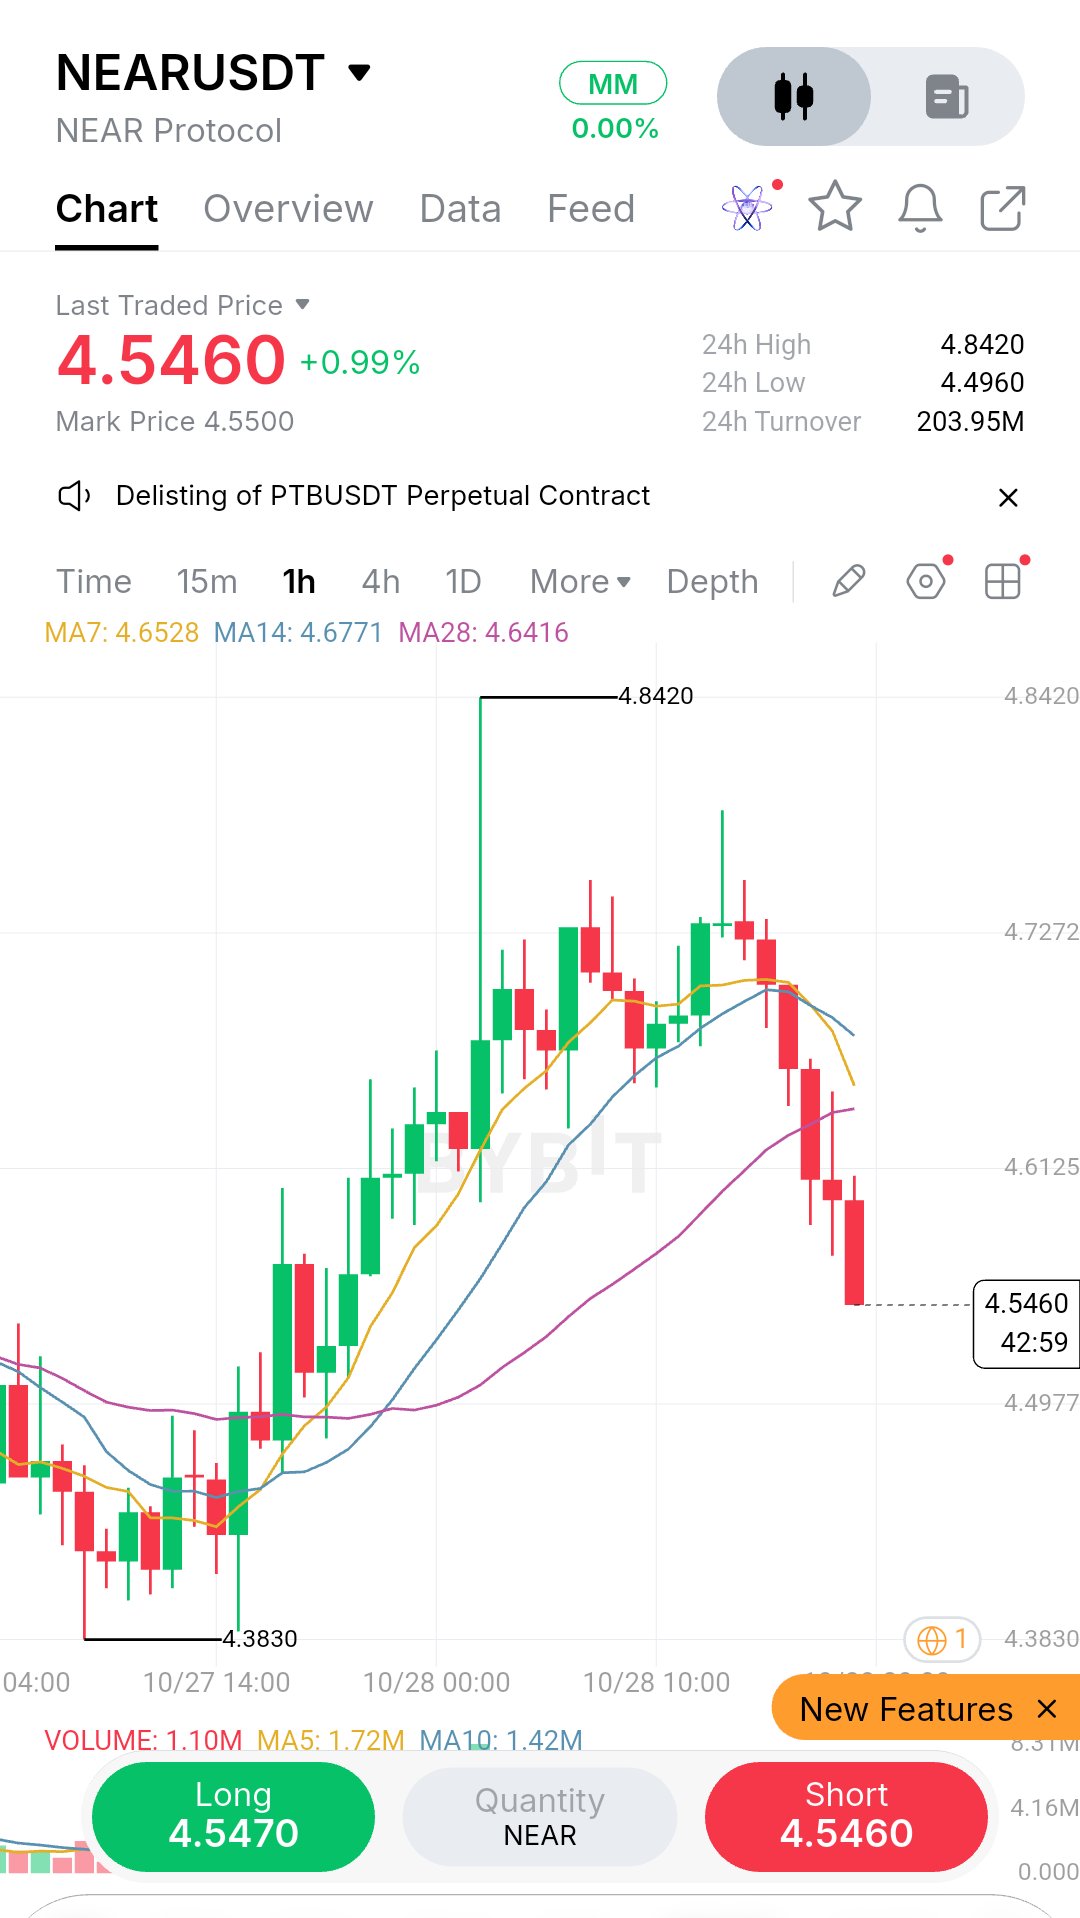
The move I’m paying attention to on $NEAR is the speed of the reversal from $4.8420. Buyers pushed price to a new visible high, but sellers have now erased much of that advance, and the latest candle is pressing toward the session low area. On the 1H chart, NEAR rallied from $4.3830 to $4.8420 before forming lower highs and accelerating downward. Price is now $4.5460, below MA7 at $4.6528, MA14 at $4.6771, and MA28 at $4.6416. That puts short-term momentum firmly under pressure, although the $4.4960 24H low is the next key area to watch. Volume is 1.10M, below MA5 at 1.72M and MA10 at 1.42M. Selling is clear in the candles, but volume has not expanded above its recent averages. I want a failed reclaim before committing to a short. My preferred setup is a conditional SHORT: Entry: $4.6000–$4.6500 after rejection Stop: $4.6900 TP1: $4.4960 TP2: $4.4400 TP3: $4.3830 R:R: Approximately 1.5R–3.7R from a $4.6250 entry. Invalidation: A sustained reclaim above $4.6900 cancels the short thesis. If TP1 hits, I’d consider taking partial profit and reducing risk. If NEAR drops without a retest, I won’t chase. The alternative is a reclaim of $4.6528 followed by a hold, which could signal stabilization. I’ve learned that after a sharp reversal, the best short is often the failed bounce—not the candle that has already fallen furthest. #ByXIMPACT $NEARUSDT
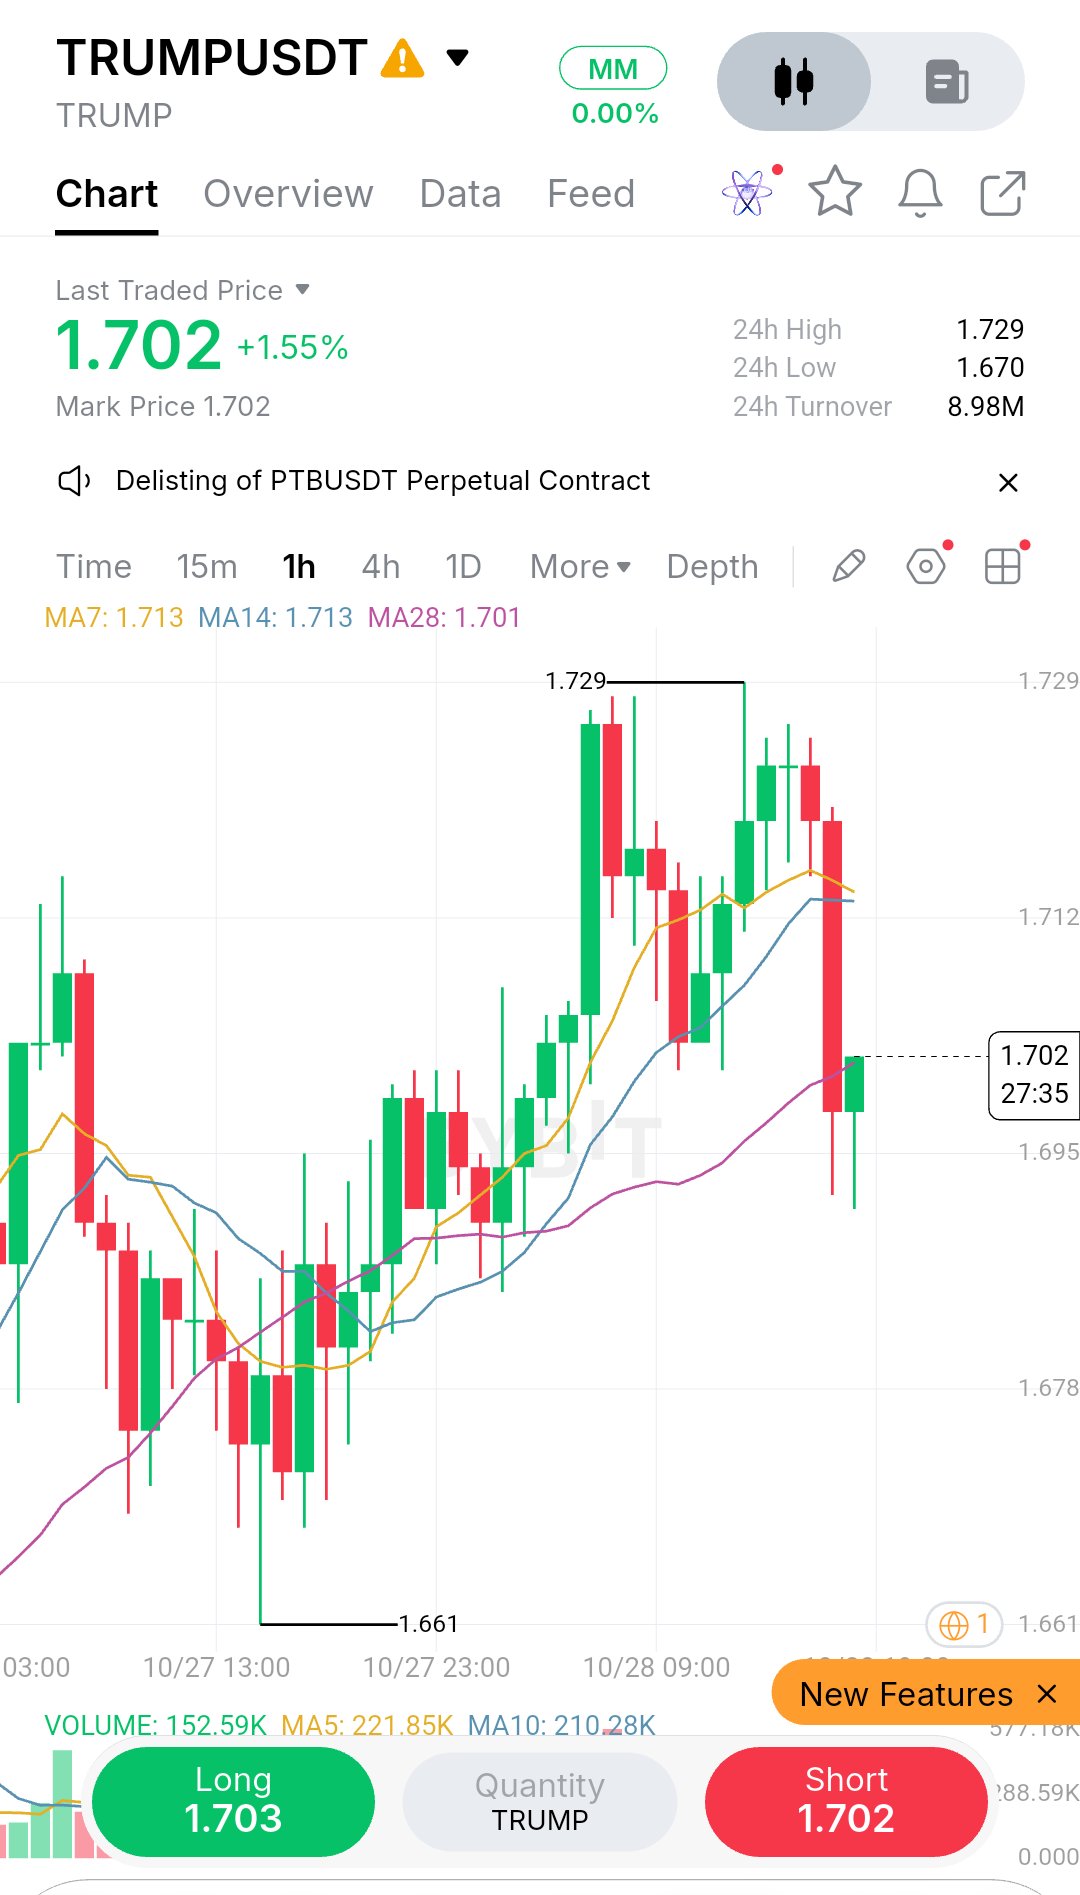
The sharp rejection from $1.729 is the detail I’m watching on $TRUMP. Buyers built a recovery, but the latest sell-off has erased much of that progress in a single 1H candle. The small bounce from the wick low is worth watching, but it is not confirmation that buyers are back in control. Price is now $1.702, up 1.55% over 24 hours. After recovering from $1.661, TRUMP rallied to $1.729 before forming lower highs and dropping sharply toward $1.692. Price is below MA7 and MA14, both at $1.713, while testing MA28 at $1.701. This is a critical decision area. Volume is 152.59K, below MA5 at 221.85K and MA10 at 210.28K. Selling pressure is visible, but the current rebound means I want confirmation before entering short. My preferred setup is a conditional SHORT: Entry: $1.708–$1.713 after rejection Stop: $1.721 TP1: $1.695 TP2: $1.678 TP3: $1.661 R:R: Approximately 1.1R–3.1R from a $1.710 entry. Invalidation: A sustained reclaim above $1.721 cancels the short thesis. If TP1 hits, I’d consider taking partial profit and reducing risk. If price falls without a retest, I won’t chase. The alternative is a firm defense of $1.701 followed by a reclaim of $1.713, which could create a recovery attempt toward $1.729. I’ve learned that a dramatic candle can distort judgment; I want the next retest to confirm direction before risking capital. #ByXIMPACT $TRUMPUSDT
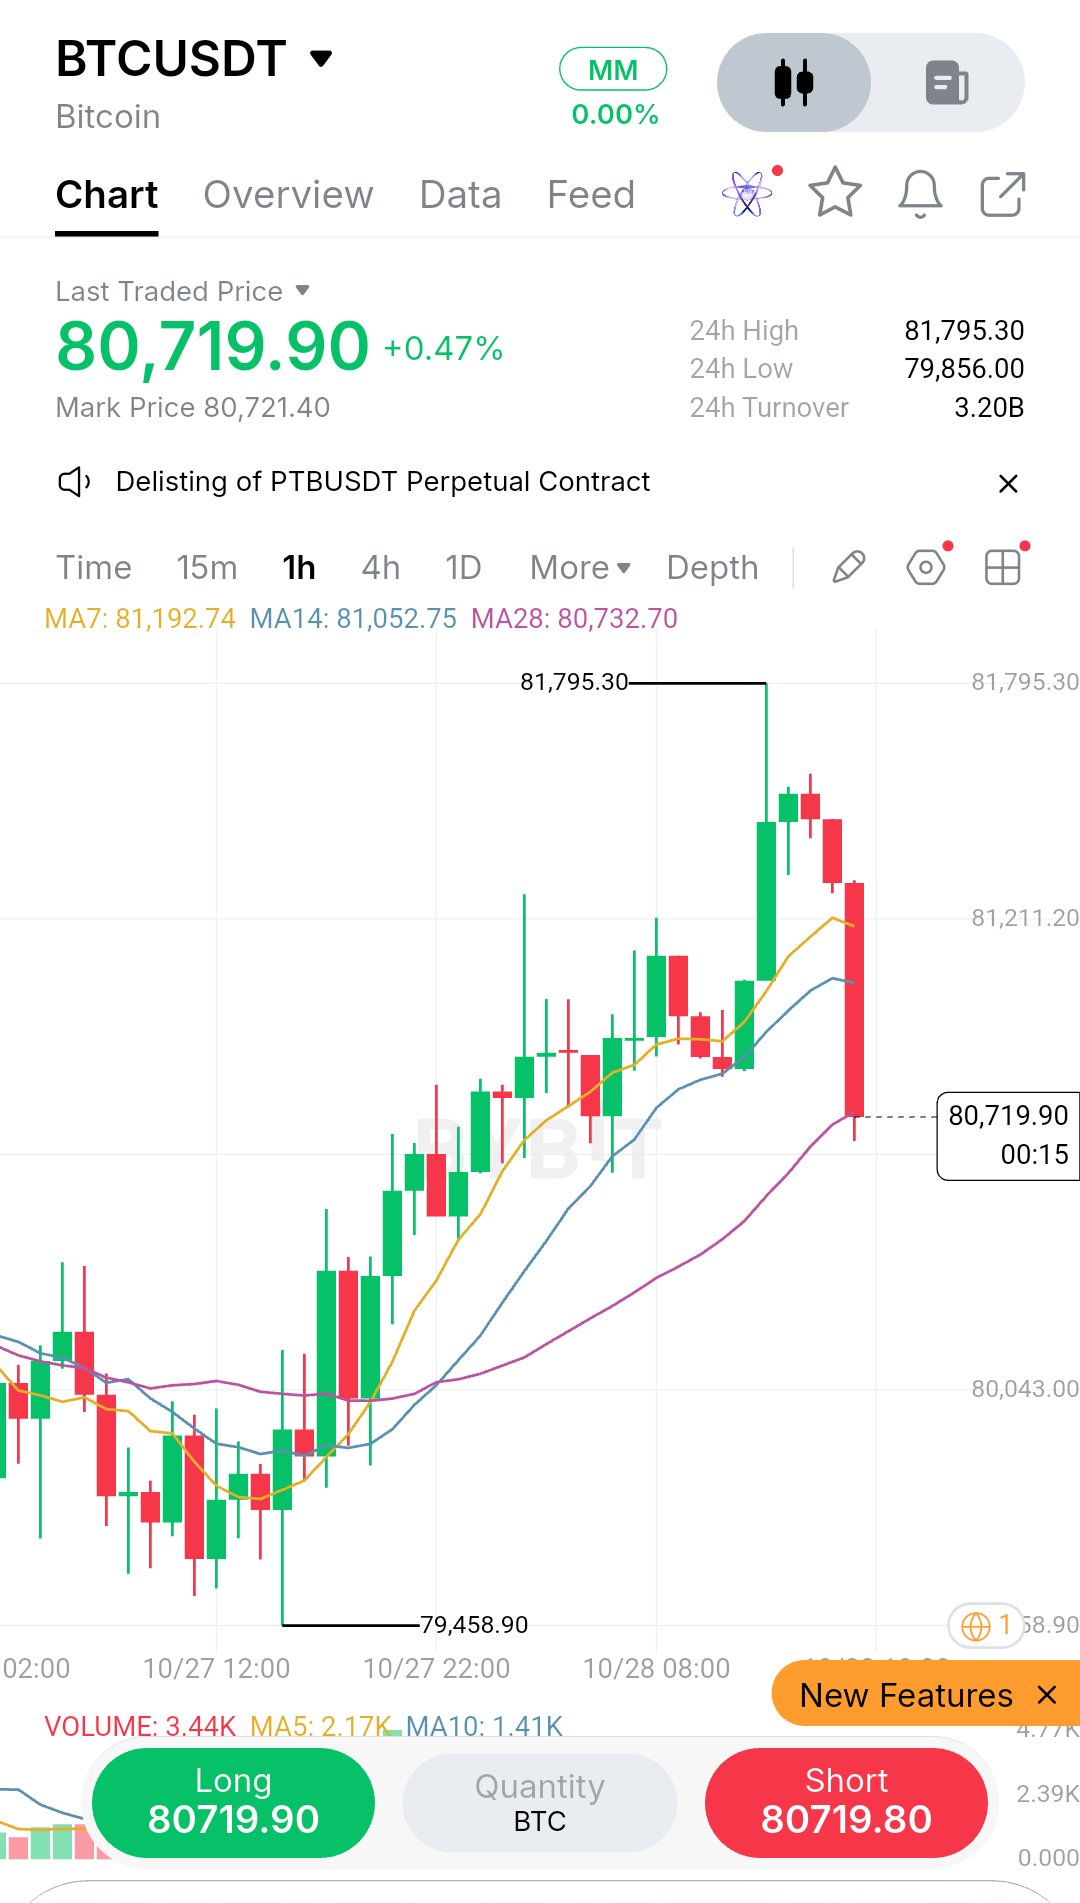
I’m paying more attention to BTC’s latest rejection than to the +0.47% daily gain. After climbing toward $81,795, price has reversed sharply, and the current candle is testing the area where the bullish structure needs to hold. On the 1H chart, BTC recovered from $79,458.90, built higher highs toward $81,795.30, and then suffered a strong sell-off from the local peak. Price is now $80,719.90, below MA7 at $81,192.74 and MA14 at $81,052.75, while testing MA28 at $80,732.70. That puts the recovery at a critical decision point. Volume is 3.44K, above MA5 at 2.17K and MA10 at 1.41K. The latest selling candle has meaningful participation, so I’m not treating this as an ordinary pullback. Still, one candle alone doesn’t confirm a full trend reversal. My preferred setup is a conditional SHORT: Entry: $80,850–$81,050 after a failed reclaim Stop: $81,350 TP1: $80,300 TP2: $80,043 TP3: $79,650 R:R: Approximately 1.3R–3.2R from an $80,950 entry. Invalidation: A sustained reclaim above $81,350 cancels the short thesis. If TP1 hits, I’d consider taking partial profit and reducing risk. If BTC falls without a retest, I won’t chase. The alternative is a defense of MA28 followed by a reclaim of $81,050, which could restore upward momentum. I’ve learned that the first sharp reversal can be deceptive; I want the retest to show whether sellers still control the level before committing. #ByXIMPACT $BTCUSDT
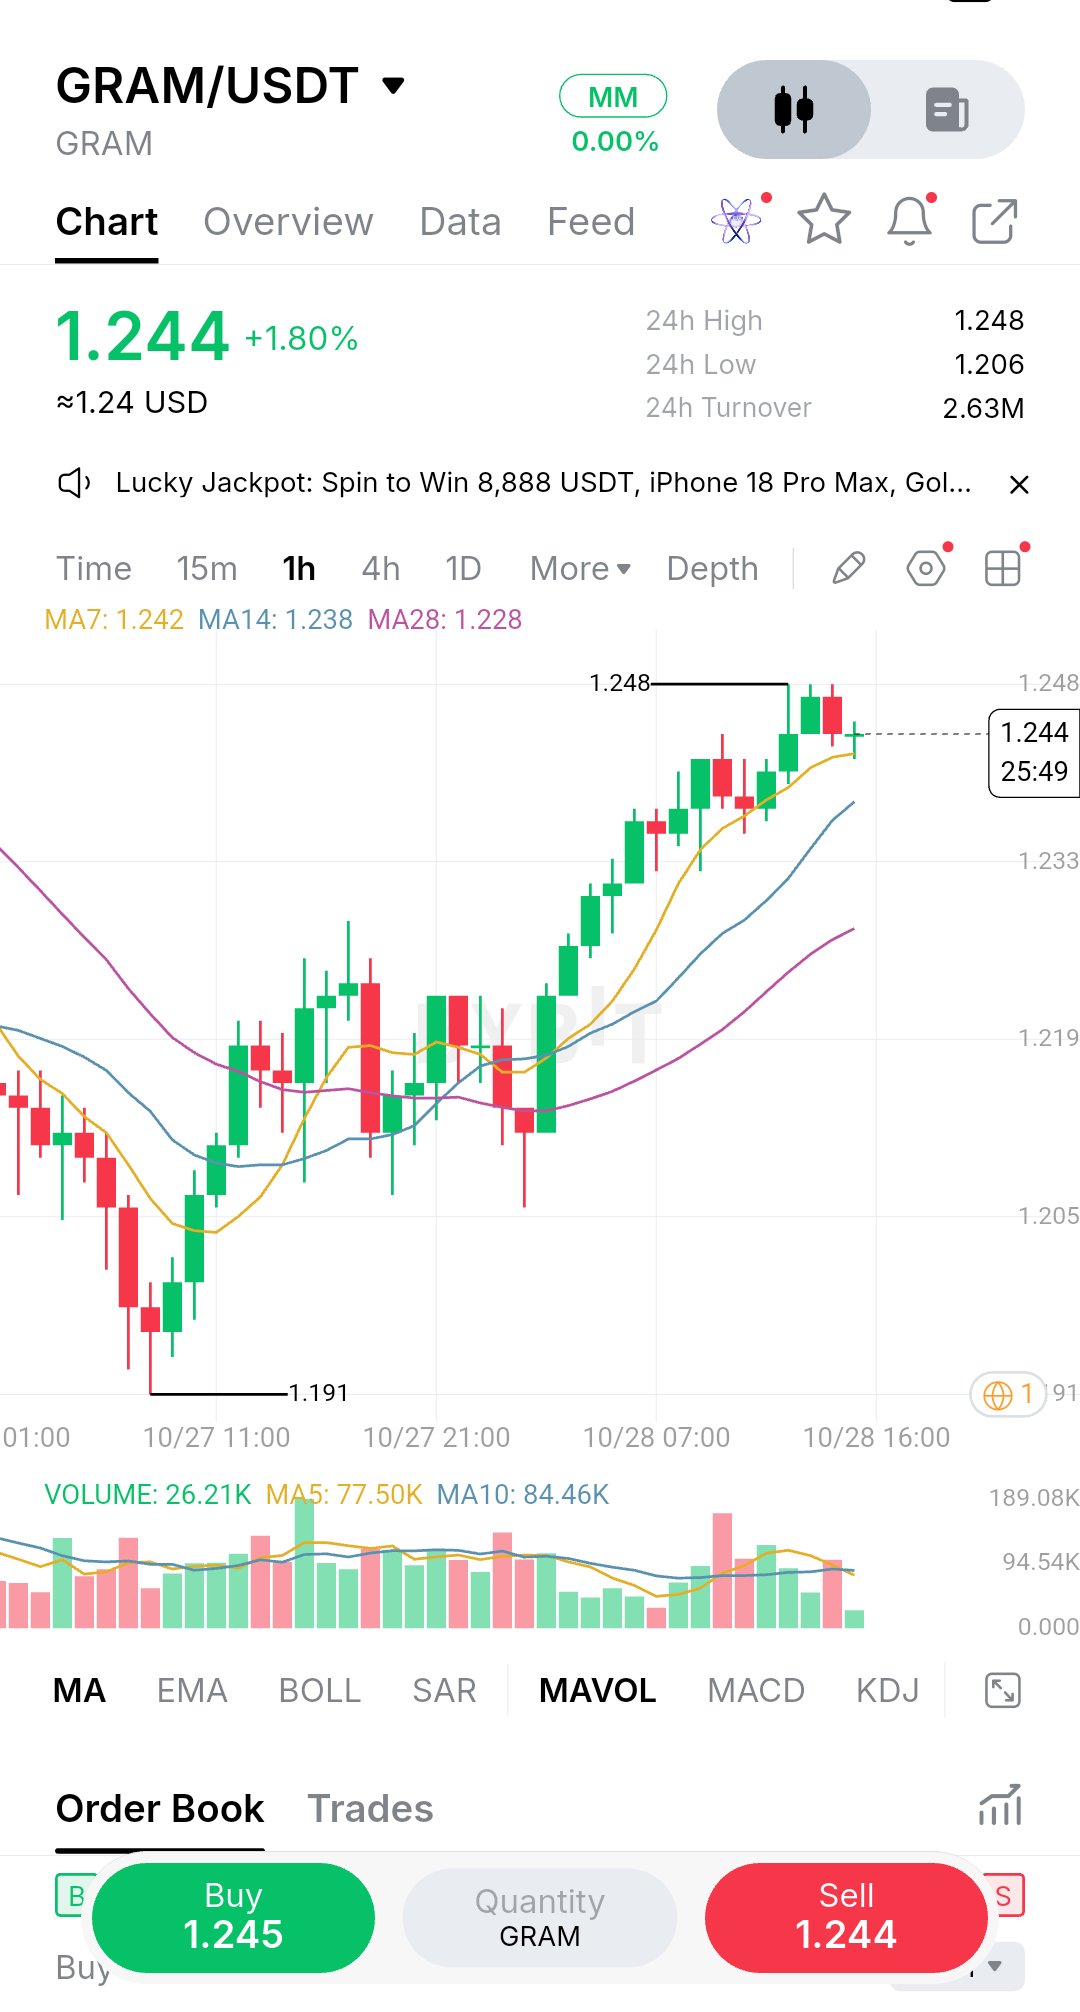
What stands out to me on $GRAM is the steady recovery from $1.191 into a series of higher highs and higher lows. Buyers have built a convincing 1H uptrend, but price is now testing $1.248 resistance, where chasing the move becomes risky. GRAM is trading at $1.244, up 1.80% over 24 hours. After recovering from the session low, price pushed through the $1.219 area and accelerated toward $1.248. The latest candles are holding near the high, suggesting buyers remain active, although a breakout is not confirmed yet. The moving averages support the bullish structure: MA7 is $1.242, MA14 is $1.238, and MA28 is $1.228. Price remains above all three. However, volume is 26.21K, well below MA5 at 77.50K and MA10 at 84.46K. Momentum is positive, but participation has cooled as price approaches resistance. I prefer a conditional LONG: Entry: $1.238–$1.242 after a successful retest Stop: $1.232 TP1: $1.248 TP2: $1.255 TP3: $1.265 R:R: Approximately 1:1 to 3.3R from a $1.240 entry. Invalidation: A sustained loss of $1.232 weakens the setup. If TP1 hits, I’d consider taking partial profit and reducing risk. If GRAM breaks higher without a retest, I won’t chase. A strong-volume break above $1.248 followed by a successful retest could support continuation. If resistance rejects price and $1.238 fails, I’d stand aside. I’d rather enter after support proves itself than confuse proximity to a high with confirmation. #ByXIMPACT $GRAMUSDT

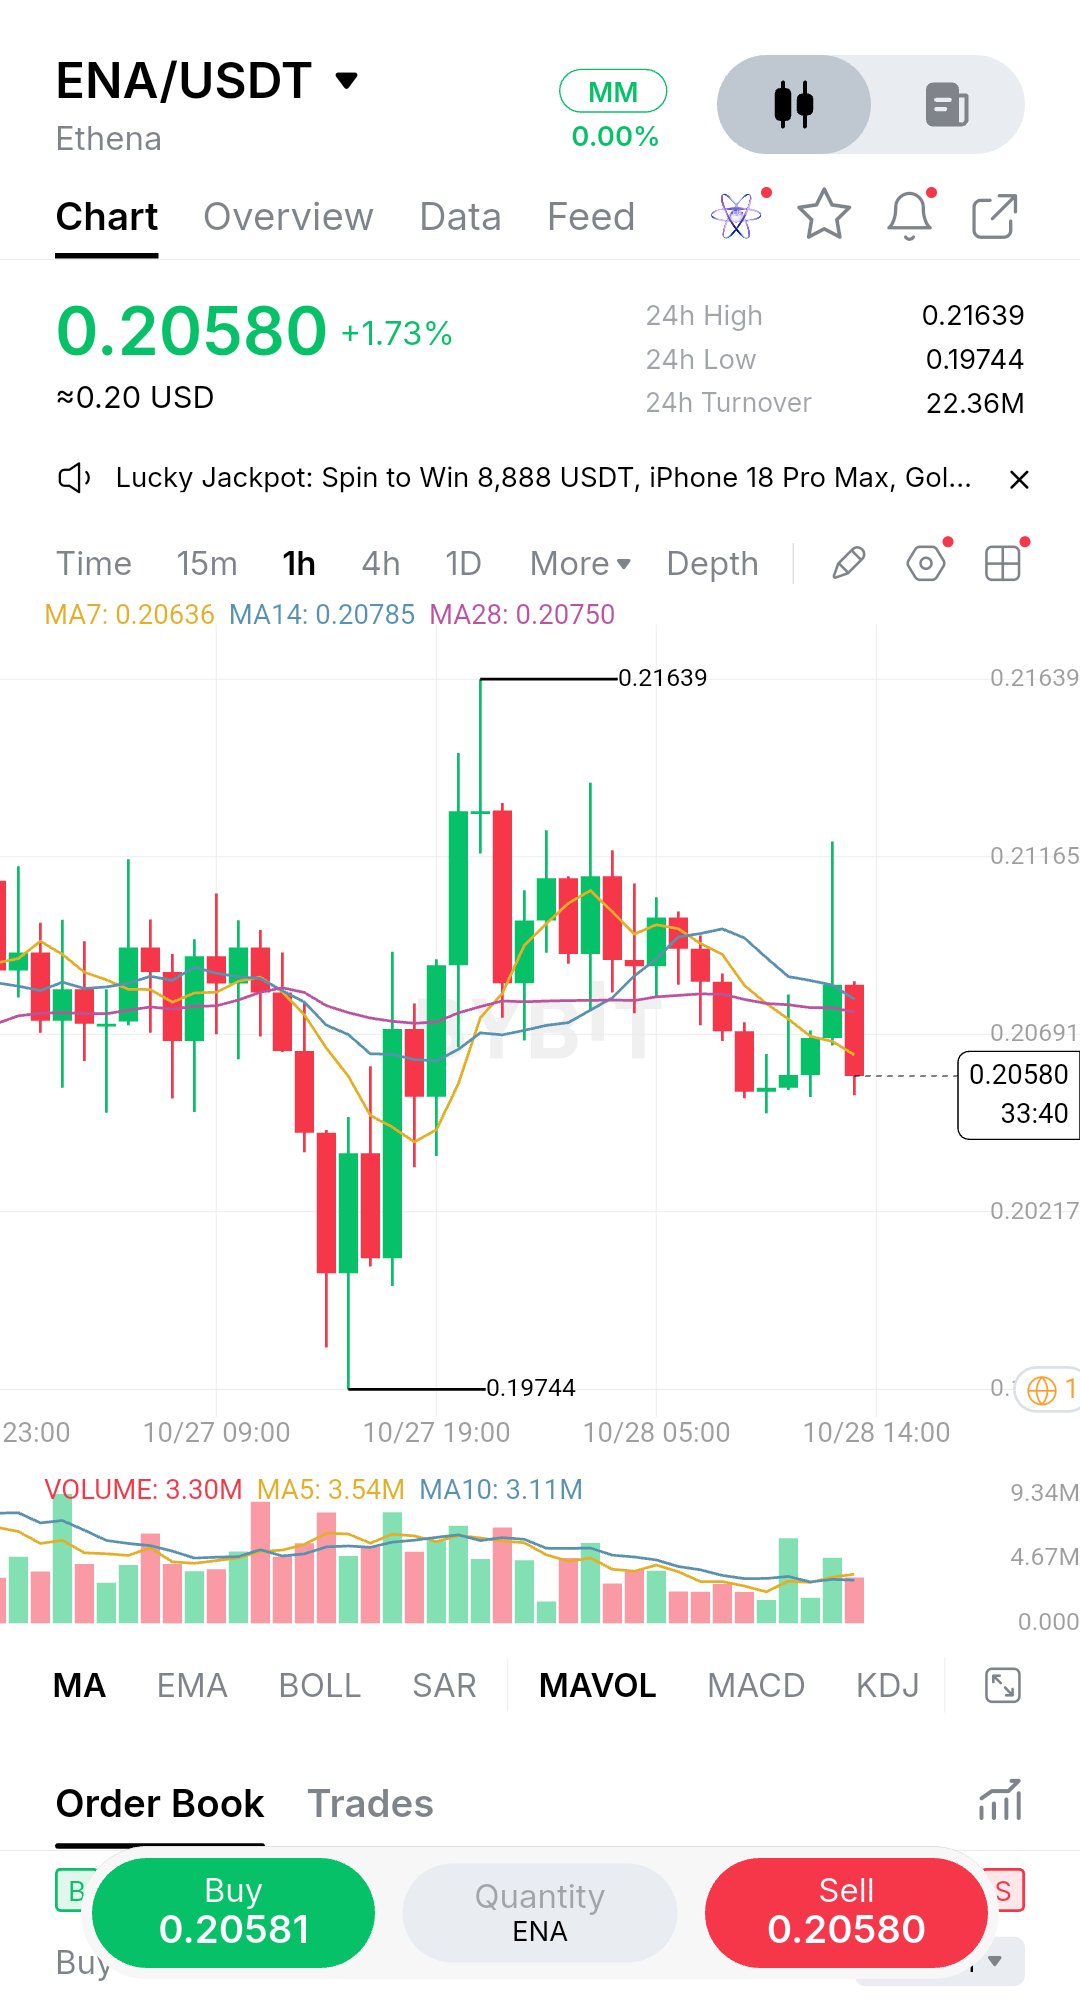
The detail that stands out to me on $ENA is the failed recovery after the sharp bounce from $0.19744. Buyers pushed price to $0.21639, but momentum faded, and the latest candle has slipped back below the moving-average cluster. I’m more interested in whether sellers can maintain that pressure than in the daily +1.73% gain. On the 1H chart, ENA rebounded strongly from $0.19744 before forming lower highs around $0.211–$0.213. Price is now $0.20580, below MA7 at $0.20636, MA14 at $0.20785, and MA28 at $0.20750. That weakens the short-term structure, although support near $0.20217 remains important. Volume is 3.30M, slightly below MA5 at 3.54M and above MA10 at 3.11M. Selling pressure is present, but not decisive enough to justify blindly entering short. My preferred setup is a conditional SHORT: Entry: $0.2068–$0.2078 after rejection Stop: $0.2095 TP1: $0.2040 TP2: $0.2022 TP3: $0.1974 R:R: Approximately 1.1R–3.8R from a $0.2073 entry. Invalidation: A sustained reclaim above $0.2095 cancels the short thesis. If TP1 hits, I’d consider taking partial profit and reducing risk. If ENA falls without a retest, I won’t chase. The alternative is a reclaim of $0.2079 with a successful hold, which could restore bullish momentum. I’ve learned that a failed bounce is only a trading opportunity when the next rejection confirms it—not simply because price has turned red. #ByXIMPACT $ENAUSDT
I’m impressed by how ETH has reclaimed momentum, but the latest push is running straight into the $2,388 resistance zone. I’d rather see whether buyers can defend a retest than buy after another strong green candle. On the 1H chart, ETH recovered from $2,297.57, built a sequence of higher lows, and pushed through the $2,342 area toward $2,388.12. Price is now $2,373.83, up 2.72% over 24 hours. The short-term structure favors buyers, but resistance is close and a rejection could trigger a pullback. The moving averages are bullishly aligned: MA7 at $2,359.05, MA14 at $2,354.23, and MA28 at $2,340.57. Price is above all three. Volume is 4.53K, above MA5 at 2.27K and MA10 at 2.16K, giving the latest push stronger participation than the recent average. My preferred setup is a conditional LONG: Entry: $2,355–$2,365 after a successful retest Stop: $2,342 TP1: $2,388 TP2: $2,405 TP3: $2,425 R:R: Approximately 1.3R–3.6R from a $2,360 entry. Invalidation: A sustained loss of $2,342 weakens the bullish structure. If TP1 hits, I’d consider taking partial profit and reducing risk. If ETH breaks higher without offering a retest, I won’t chase it. The alternative is a clean break above $2,388 followed by a successful retest, which could support continuation. My focus is not predicting the next candle; it’s making sure the level I trade actually holds before I risk capital. #ByXIMPACT $ETHUSDT

The key detail I’m watching on $LIT is the failed follow-through after its sharp rebound. Buyers pushed price toward $3.13, but sellers stepped back in, and the market has since slipped toward $3.03. That makes this a decision zone, not an obvious long. On the 1H chart, LIT fell to the $2.9655 low, recovered toward the $3.13 area, and then formed a sequence of lower highs. Price is now $3.0317, below MA7 at $3.0432 and MA14 at $3.0593, while sitting just below MA28 at $3.0393. The short-term recovery is losing strength. Volume is 49.77K, slightly below MA5 at 53.65K and MA10 at 54.33K. There is no strong volume confirmation behind the latest bounce, so I want sellers to prove they can defend resistance before considering a short. My preferred setup is a conditional SHORT: Entry: $3.0400–$3.0600 after rejection Stop: $3.0820 TP1: $3.0000 TP2: $2.9782 TP3: $2.9655 R:R: Approximately 1.3R–3.1R from a $3.05 entry. Invalidation: A sustained reclaim above $3.0820 cancels the setup. If TP1 hits, I’d consider taking partial profit and reducing risk. If LIT drops without a retest, I won’t chase. The alternative is a reclaim of $3.06 followed by a successful hold, which could revive the bullish case toward $3.0731 and higher. I’ve learned that after a failed rally, the retest often tells me more than the initial rejection. #ByXIMPACT $LITUSDT

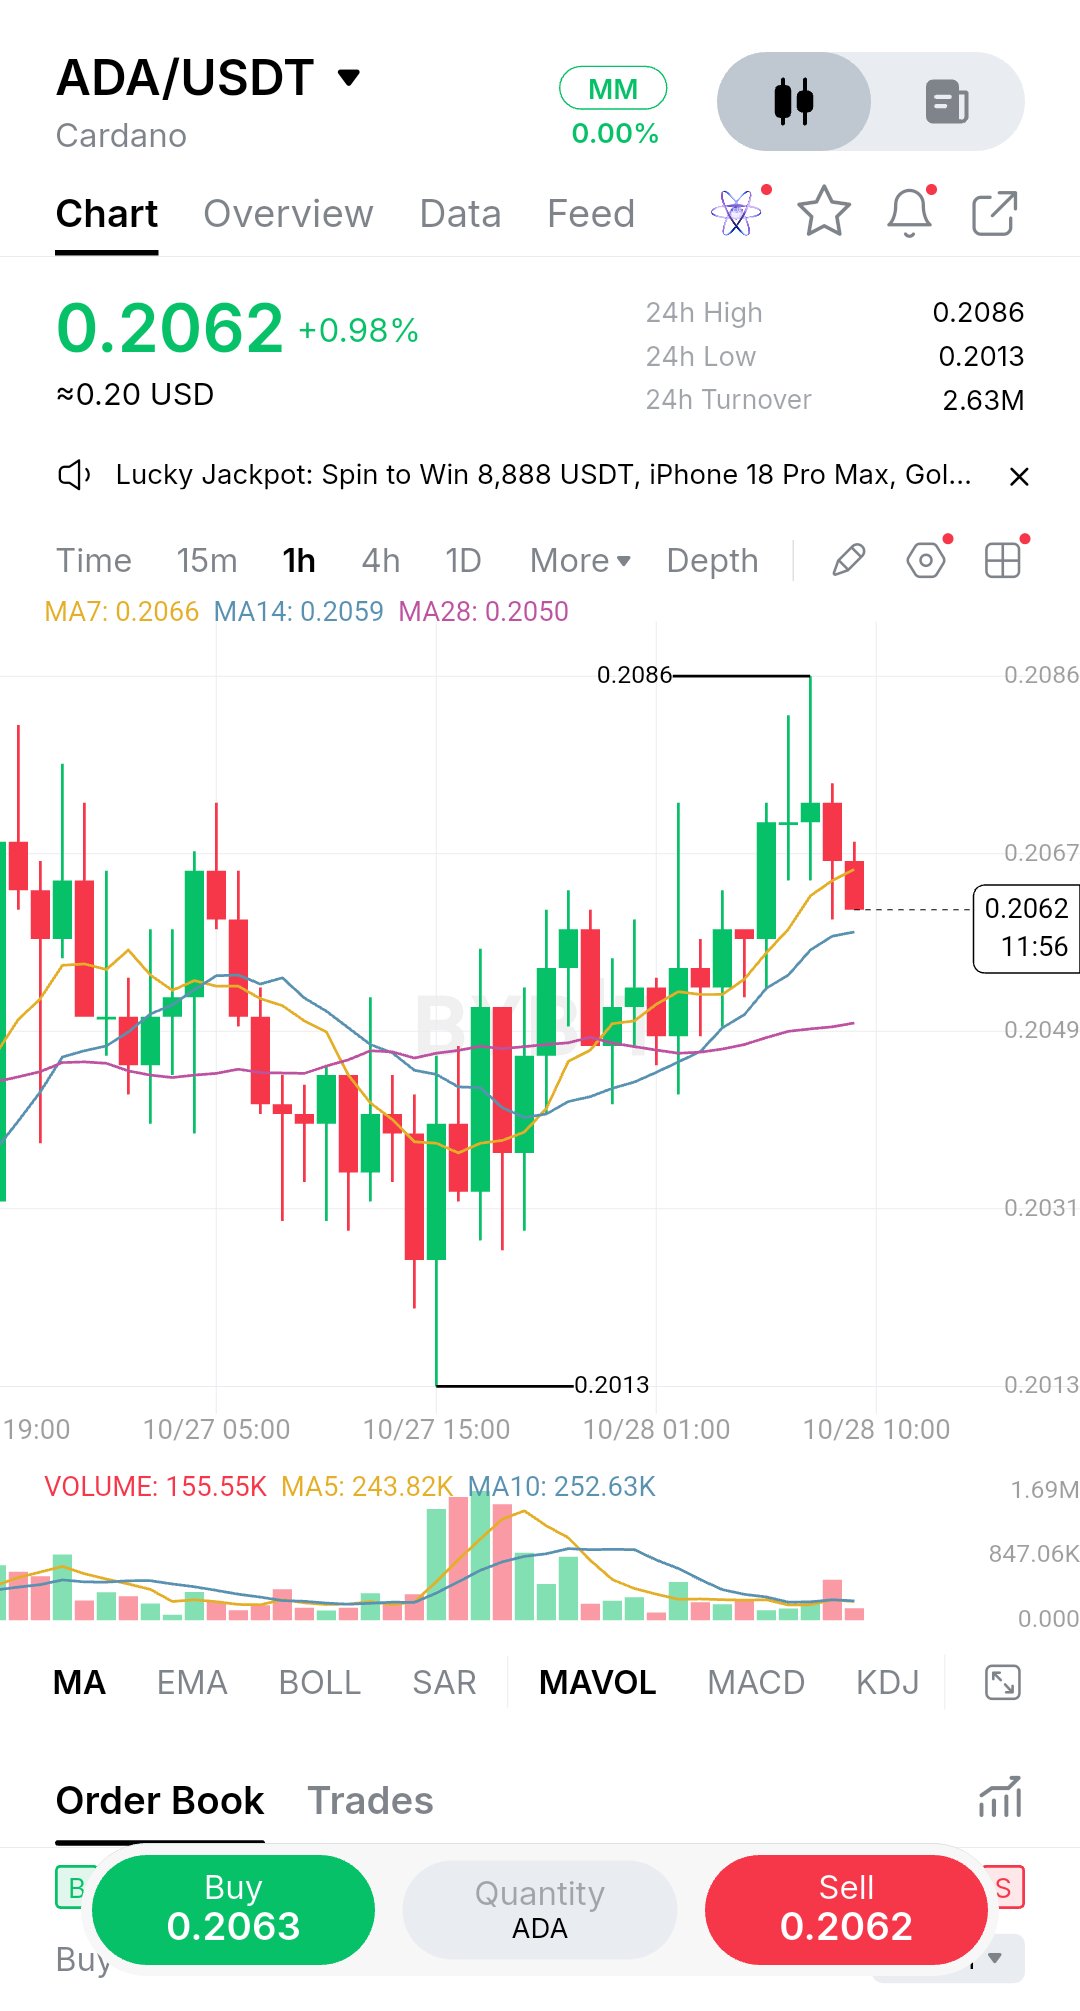
I’m watching whether $ADA can hold its moving-average reclaim after getting rejected near $0.2086. Buyers have improved the 1H structure, but the latest red candles suggest the market needs to prove that resistance has turned into support. ADA is trading at $0.2062, up 0.98%. Price recovered from the visible $0.2013 low, formed a series of higher lows, and pushed toward $0.2086 before pulling back. The recovery remains intact for now, but the immediate momentum has cooled. MA7 sits at $0.2066, MA14 at $0.2059, and MA28 at $0.2050. Price has slipped slightly below MA7 while remaining above MA14 and MA28. Volume is 155.55K, below MA5 at 243.82K and MA10 at 252.63K. That tells me the latest push lacks the participation needed to confidently chase a breakout. My preferred setup is a conditional LONG: Entry: $0.2055–$0.2060 after support holds Stop: $0.2045 TP1: $0.2075 TP2: $0.2086 TP3: $0.2100 R:R: Approximately 1.3R–3.6R from a $0.2057 entry. Invalidation: A sustained loss of $0.2045 weakens the recovery setup. If TP1 hits, I’d consider taking partial profit and reducing risk. If ADA breaks higher without a retest, I won’t chase it. A stronger-volume reclaim of $0.2067 would improve the bullish case. If $0.2050 fails instead, I’d step aside and watch whether price revisits the $0.2031 area. I’d rather trade confirmed support than assume every pullback is a buying opportunity. #ByXIMPACT $ADAUSDT
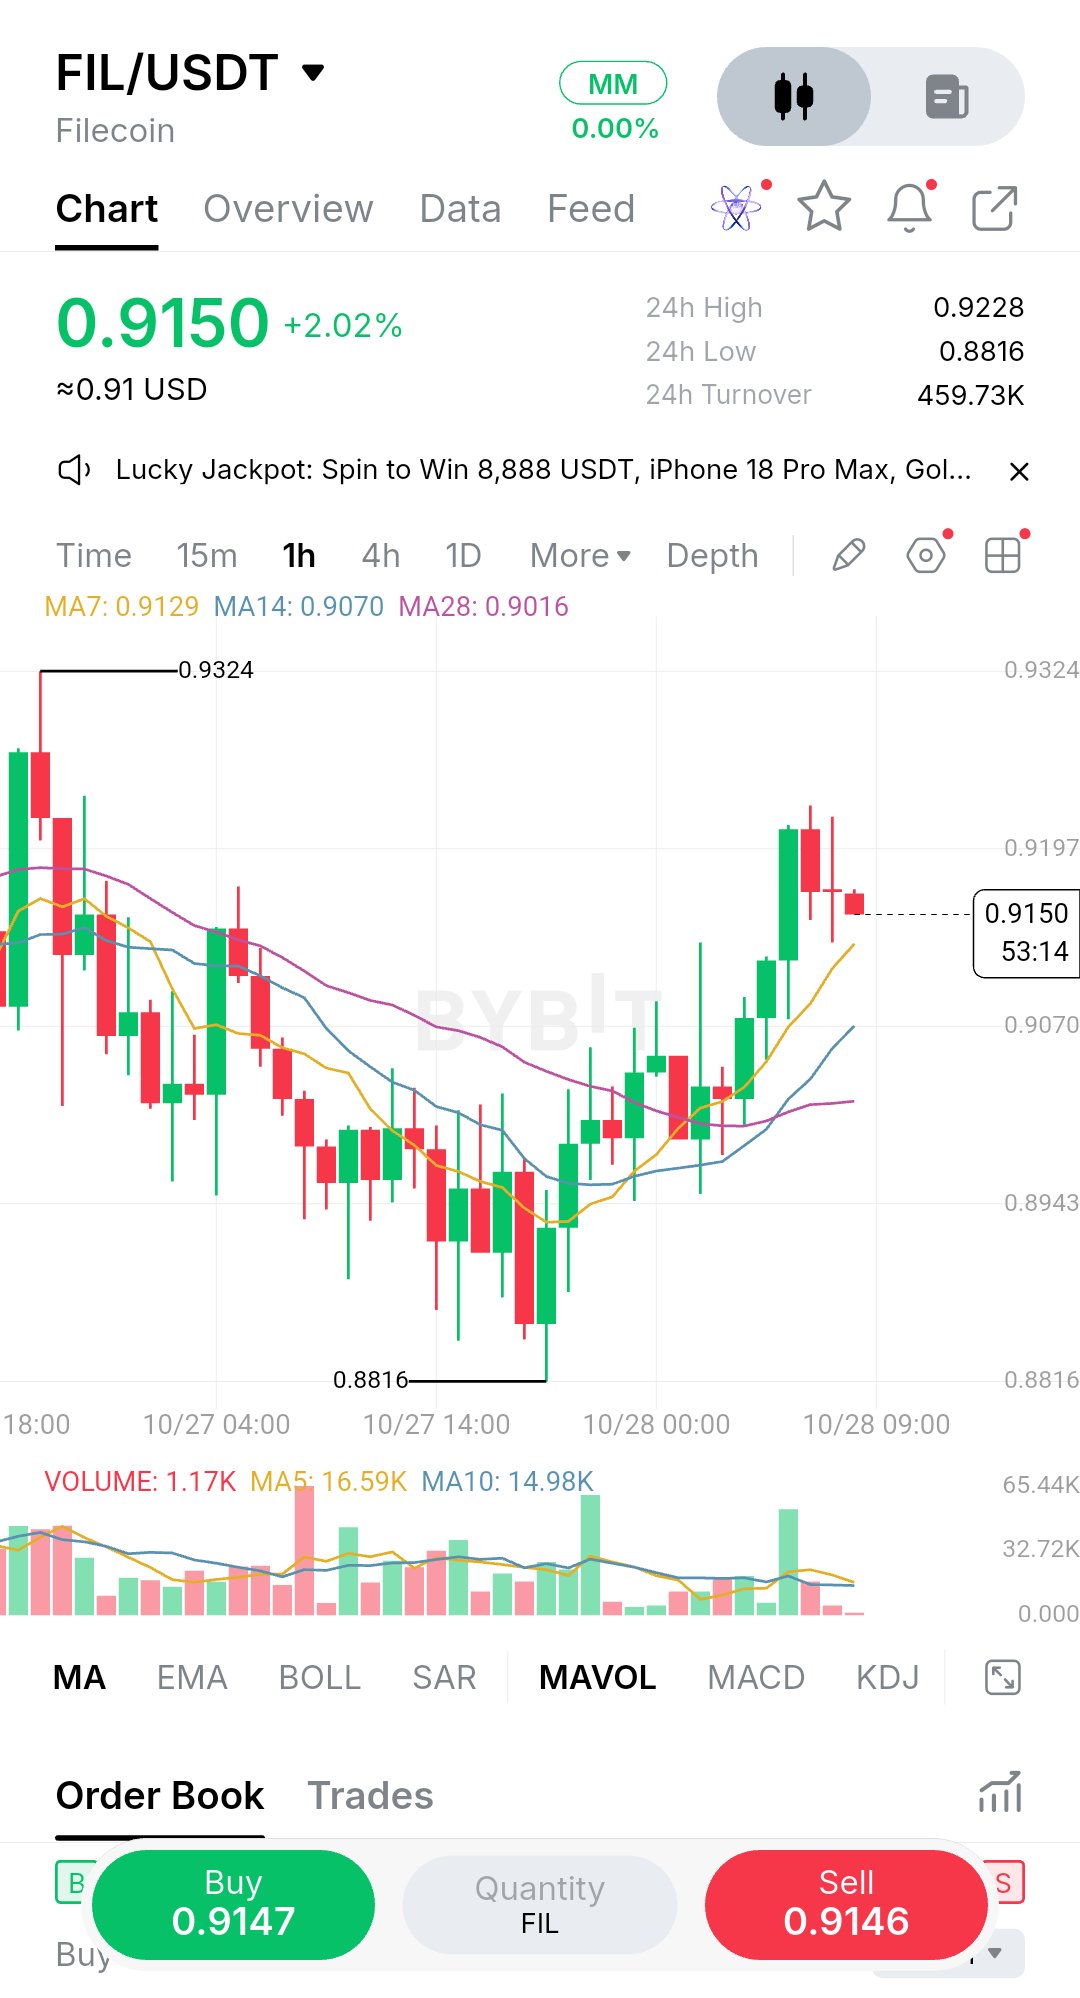
The detail I’m watching on $FIL is the rejection after its recovery toward $0.9197. Buyers have rebuilt the chart from the $0.8816 low, but the latest pullback raises a key question: can they defend the breakout area, or is momentum already fading? On the 1H chart, FIL moved from a sustained decline into a recovery, reclaimed the moving averages, and pushed toward resistance. Price is now $0.9150, up 2.02%, with the 24H high at $0.9228. The short-term structure favors buyers, but resistance remains close overhead. MA7 is $0.9129, MA14 is $0.9070, and MA28 is $0.9016. Their bullish alignment supports the recovery. However, current volume is only 1.17K versus MA5 at 16.59K and MA10 at 14.98K. The latest push has not maintained strong participation, so I would avoid chasing it. My preferred setup is a conditional LONG: Entry: $0.9090–$0.9120 after support holds Stop: $0.9040 TP1: $0.9197 TP2: $0.9228 TP3: $0.9324 R:R: Approximately 1.1R–3.1R from a $0.9100 entry. Invalidation: A sustained loss of $0.9040 weakens the recovery setup. If TP1 hits, I’d consider taking partial profit and reducing risk. If FIL rallies straight into resistance without a retest, I won’t chase. I’ve learned to pay as much attention to participation as price: a breakout is more convincing when buyers continue showing up after the first impulse. A stronger-volume reclaim of $0.9197 would improve the bullish case; rejection followed by a loss of $0.9070 would make me reconsider. #ByXIMPACT $FILUSDT
What catches my attention on $MNT is the sudden expansion out of a long, tight trading range. Buyers have taken control quickly, but the move is already approaching $0.53690 resistance, making an immediate entry difficult to justify. On the 1H chart, MNT established a base around $0.50600, spent hours consolidating near $0.513–$0.520, and then broke sharply higher. Price is now $0.53580, up 5.03% over 24 hours, just below the visible high of $0.53690. The moving averages have turned bullish: MA7 is $0.51864, MA14 is $0.51752, and MA28 is $0.51542. Price has stretched well above all three, confirming strong momentum but also increasing the risk of a pullback. Volume is 4.92M, compared with MA5 at 1.53M and MA10 at 929.94K. This breakout has meaningful participation. I prefer a conditional LONG after a retest rather than chasing the spike. Entry: $0.5290–$0.5320 after support holds Stop: $0.5240 TP1: $0.53690 TP2: $0.5420 TP3: $0.5480 R:R: Approximately 1:1 to 2.8R, depending on entry and target. Invalidation: A sustained move below $0.5240 cancels this setup. If TP1 hits, I’d consider taking partial profit and reducing risk. If MNT runs straight through resistance without a retest, I won’t chase it. The alternative is a failed breakout and a return below $0.5290, which would warn that momentum is fading. I’ve learned that the strongest candles often create the greatest temptation to enter late; I want the retest to prove buyers can defend the breakout first. #ByXIMPACT $MNTUSDT
