MIDAN
* Bybit Crypto Trader ⚡ | Daily Insights & Market Updates | Market research updates every day | FOLLOW ME FOR MORE INFO | (DYUR)😊💯✅️
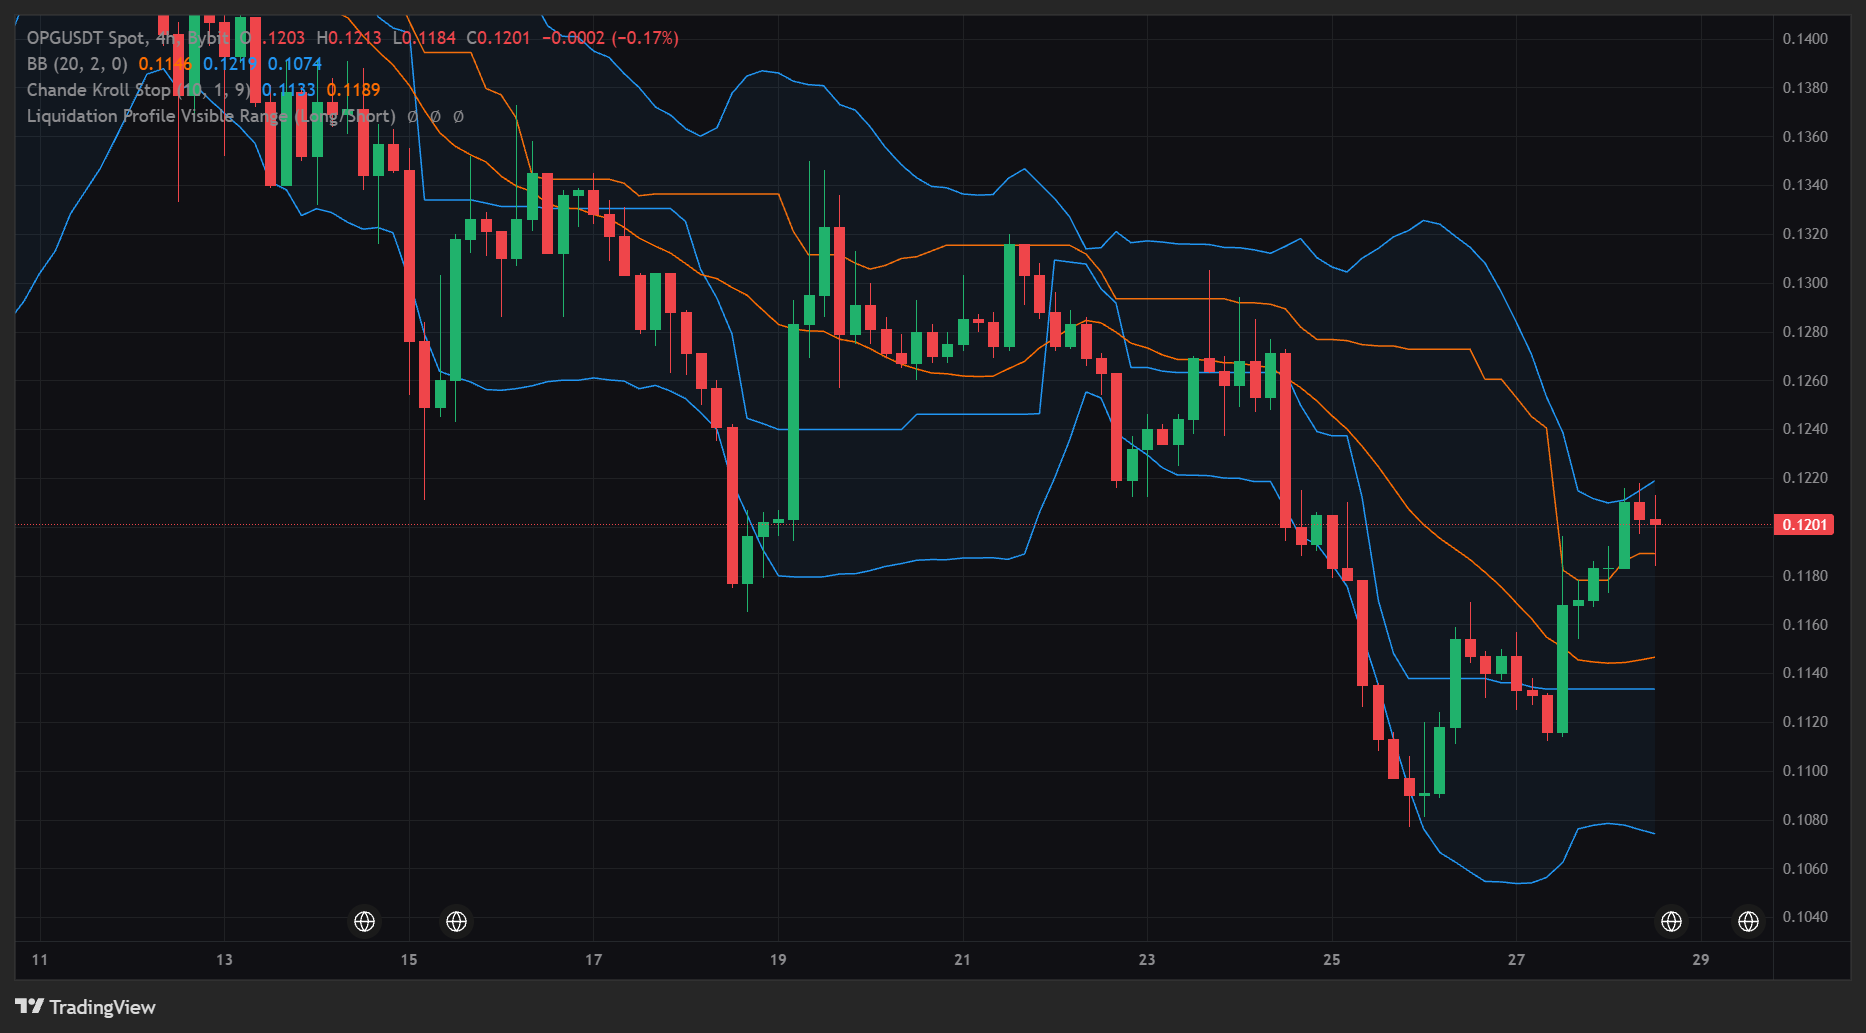
XAUT is holding near the $4,050 area after a recent push higher, and I am watching how price reacts around this level before making my next move. I don't chase short-term momentum. I prefer to wait for a clear pullback or a confirmed breakout. Looking at the latest market data, XAUT recently reached a high near $4,068 and pulled back toward the $4,047 area. Buyers are still defending the broader range, but the next move depends on whether price can reclaim the recent high or slips into another round of consolidation. Here is my read and how I am playing it: **The Cool-Off:** XAUT has eased back from its recent high, giving the market some time to digest the move. I want to see momentum stabilize before looking for another push higher. A small pullback is not automatically bearish, but I won't assume buyers are in control without confirmation. **The Support Floor:** I am watching the $4,020–$4,000 zone closely. This area could become an important short-term support region if buyers step in again. If price holds above it and starts forming higher lows, the bullish setup becomes more interesting. A clean break below this zone would make me more cautious. **The Trigger:** I am not entering blindly in the middle of the range. I want to see XAUT reclaim the $4,050 area with stronger buying volume, followed by a convincing move above $4,068. That would give me a clearer signal that buyers are ready to challenge the next resistance zone. **My Target:** If the breakout holds, my first area of interest is around $4,080, followed by $4,100 if momentum continues. If price fails to reclaim resistance and loses $4,000, I will step back and reassess rather than force a long trade. For me, the key is patience. XAUT can offer a different trading dynamic from highly speculative tokens because its price is linked to gold, but short-term volatility and sudden reversals are still possible. I am watching the support zone, waiting for confirmation, and keeping risk management ahead of any profit target. Would you rather buy a confirmed breakout in XAUT or wait for a deeper pullback? #ByXIMPACT #FOMCRateDecision $XAUTUSDT $BTCUSDT

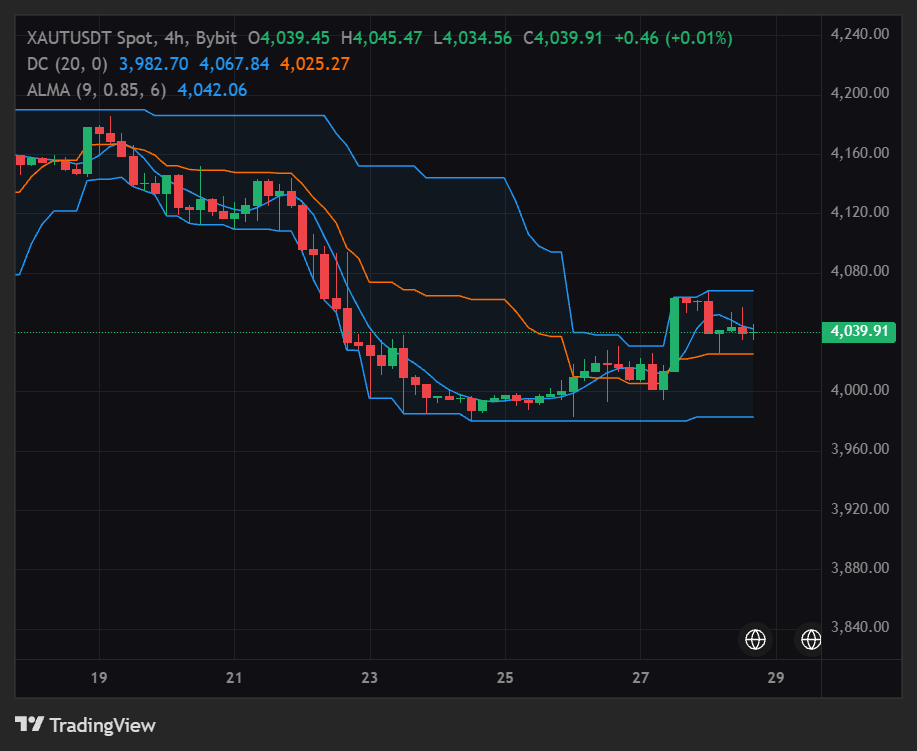
ENA is showing an interesting setup shoing 💥
ENA is showing an interesting setup as the market weighs Ethena's growing ecosystem against the potential impact of future token supply increases. The key question is whether buyers can maintain momentum or whether selling pressure will push the price back toward recent support. Recent market data placed ENA around $0.1995, with a 24-hour range of approximately $0.1961–$0.2251. This wide range highlights the volatility traders should consider before entering a position. However, these figures are reference data rather than verified live prices, so the current chart needs to be checked before trading. There is a fundamental development that makes ENA worth watching beyond its short-term price action. Ethena is building a synthetic-dollar ecosystem around USDe, a crypto-native asset designed to maintain its dollar peg through a hedging strategy rather than relying exclusively on traditional cash reserves. The protocol also offers related savings products and infrastructure for other stablecoin initiatives. But I keep coming back to one distinction: growth in USDe adoption does not automatically translate into buying pressure for ENA. The important question is how protocol revenue and ecosystem expansion create economic value for the token. Ethena announced changes in August 2026 aimed at ending future monthly investor unlocks and directing a substantial share of eligible protocol revenue toward ENA buybacks, subject to specified milestones and governance arrangements. These changes could strengthen the token's value proposition, but their actual impact depends on implementation and sustained protocol revenue. Token supply remains another important consideration. ENA has a maximum supply of 15 billion tokens, with approximately 13.4 billion reported in circulation. Additional scheduled releases could influence market liquidity and selling pressure. An unlock does not automatically mean tokens will be sold, but traders should monitor distribution changes alongside demand. On the technical side, the $0.1960–$0.2000 region is an important initial support reference based on the recent reported trading range. If buyers defend this area and reclaim $0.2100, the market could attempt a move toward $0.2200–$0.2250. A convincing breakout above $0.2250, supported by stronger volume, would improve the short-term bullish outlook. However, failure to hold $0.1960 could expose ENA to another move lower. My read is that ENA has a developing fundamental story, but price confirmation remains essential. For a conditional long setup, I would wait for a confirmed breakout above $0.2100, followed by a successful retest. Entry zone: $0.2100–$0.2130 after confirmation SL: $0.2010 TP1: $0.2200 TP2: $0.2250 TP3: $0.2350 These are illustrative trading levels, not verified live signals or guaranteed outcomes. Reassess them against the current chart before entering a trade. On the bearish side, a sustained break below $0.1960 would weaken the recovery thesis. If selling volume increases, I would avoid assuming that the first dip must produce a bounce. For now, I would not chase a sudden green candle. The better opportunity would come from a confirmed breakout or a clear defense of support. The bigger Ethena thesis is whether USDe adoption, protocol revenue, and token buyback mechanisms can create sustained demand for ENA. The ecosystem has meaningful potential, but lasting price strength will depend on execution, supply management, and buyers proving they can maintain control above resistance. #ByXIMPACT #USCPI $ENAUSDT $XAUTUSDT
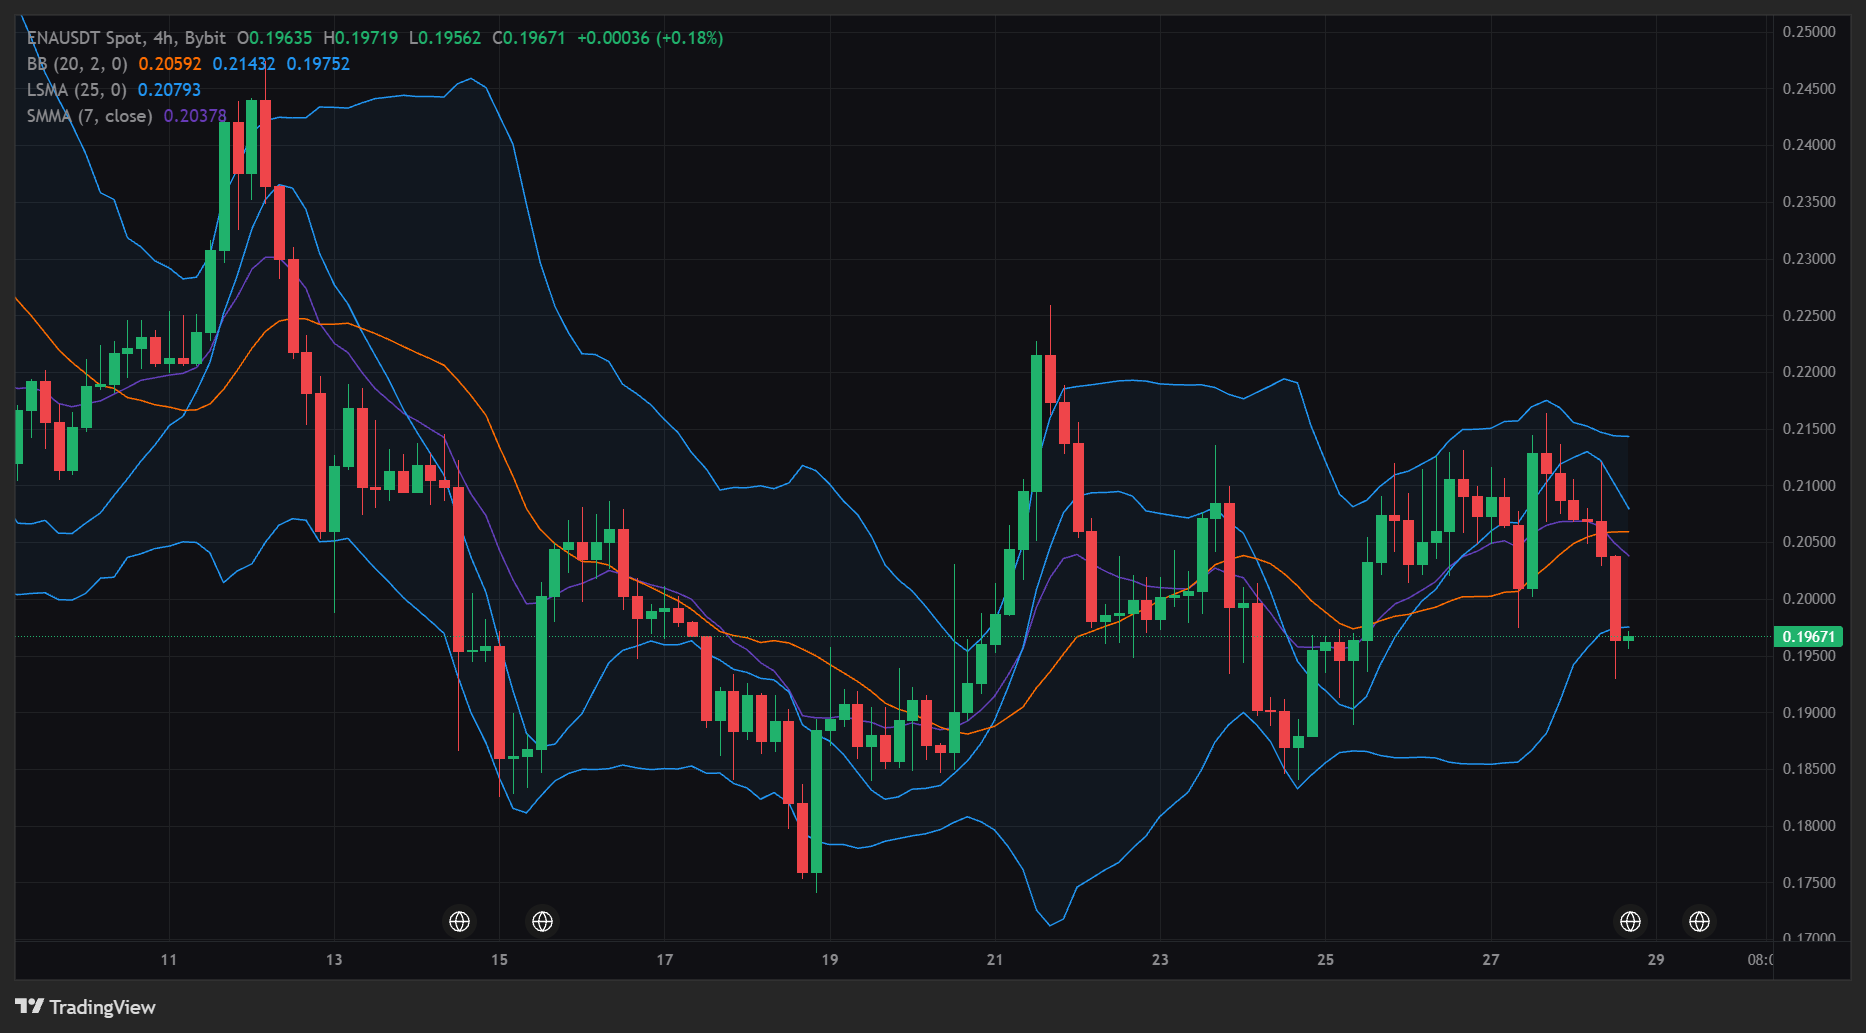
GRAM is showing an interesting short-term recovery, but the broader price structure suggests that buyers still have work to do before a stronger bullish reversal can be confirmed. GRAM is trading around $1.24, up approximately 2.76% over the past 24 hours, with a recent trading range of $1.21–$1.24. However, the token remains under pressure over the past week, indicating that the latest bounce may be an early recovery attempt rather than a confirmed trend change. There is a fundamental development that makes this recovery worth watching. The network is focused on connecting blockchain infrastructure with everyday digital applications through payments, decentralized finance, and applications accessible to a large user base. Its integration with Telegram provides a potential distribution advantage, allowing developers to build services that can reach users without requiring them to navigate complicated blockchain interfaces. But I keep coming back to one distinction: a large potential user base does not automatically translate into sustained buying pressure for GRAM. The important question is whether that reach generates consistent transactions, stronger liquidity, and meaningful demand for the token. Adoption needs to translate into measurable economic activity rather than simply creating a positive narrative around the ecosystem. The token economics also deserve attention. GRAM has approximately 2.8 billion tokens in circulation, while reported total supply stands near 5.27 billion. This difference matters because future changes in circulating supply can influence market liquidity and selling pressure. Staking and network participation may support demand, but investors still need to consider supply growth and the distribution of holdings. On the technical side, the market is attempting to stabilize around $1.24, but the next resistance area remains important. The $1.24–$1.25 region is the first level I would watch for a convincing breakout. A sustained move above this zone, supported by stronger trading volume, could open the door toward $1.28 and potentially $1.32. The $1.36 area would be a further upside reference if momentum continues to improve. On the downside, $1.21 is the first support level to monitor, followed by $1.19. A decisive break below these areas would weaken the recovery structure and suggest that sellers remain in control. My read is that GRAM is showing signs of short-term strength, but the market needs confirmation before the recovery can be treated as a sustainable bullish move. For a conditional long setup, I would wait for a confirmed breakout above $1.25, followed by a successful retest. Entry zone: $1.245–$1.255 after confirmation SL: $1.21 TP1: $1.28 TP2: $1.32 TP3: $1.36 These are illustrative trading levels based on the recent price range, not guaranteed outcomes. The setup should be reassessed against the live chart before entry. On the bearish side, a sustained move below $1.19 would weaken the bullish scenario and increase the risk of further downside. A strong recovery above $1.25 would improve the short-term outlook, particularly if supported by rising spot volume. For now, I would avoid chasing the recovery without confirmation. The better opportunity would come from seeing buyers reclaim resistance and successfully defend it as support. The bigger GRAM thesis is whether its ecosystem can convert accessibility and network development into sustained economic demand. The price is showing some improvement, but lasting strength will depend on real adoption, healthy liquidity, and buyers demonstrating that they can maintain control above key resistance. #ByXIMPACT #FOMCRateDecision $GRAMUSDT $XANUSDT
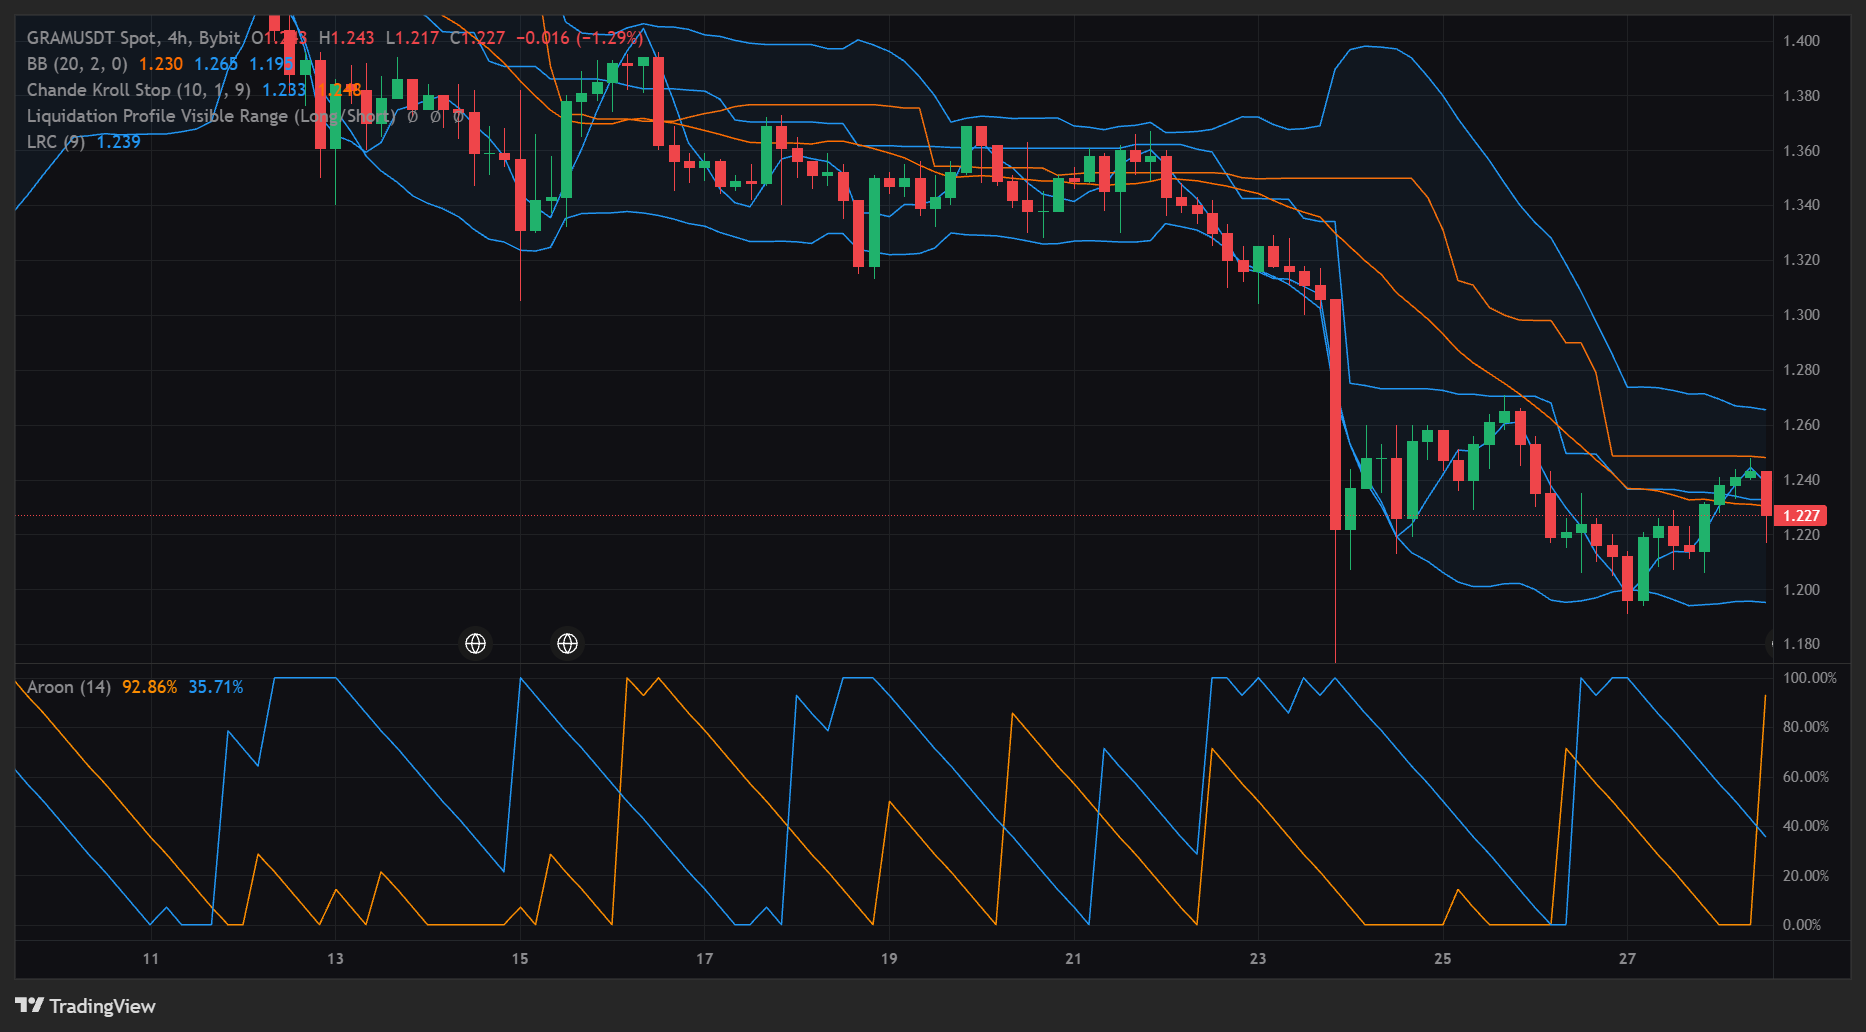
OPG is showing an interesting short-term recovery: buyers have pushed the price higher, but the market still needs to prove that this momentum can develop into a sustained move rather than another temporary bounce. Recent market data places OPG around $0.119–$0.120, with a positive 24-hour move despite a weaker performance over the previous seven days. This suggests that short-term buyers are returning, although the broader structure still requires confirmation. The key question now is whether OPG can break above nearby resistance or whether sellers will use the recovery to take profits. There is a fundamental development that makes this token worth watching beyond its immediate price action. OpenGradient is building decentralized infrastructure for artificial intelligence, focusing on running and verifying AI model inference. The idea is to make AI computation more transparent and verifiable through blockchain-based infrastructure. As demand for AI applications grows, networks offering reliable computational services could become increasingly relevant. But I keep coming back to one distinction: growth in AI adoption does not automatically translate into buying pressure for OPG. The project needs to demonstrate that real usage creates meaningful demand for its network and token. Developer adoption, computational demand, and sustainable ecosystem activity matter more than the AI narrative alone. Without a clear connection between network usage and token utility, market enthusiasm can fade even when the underlying technology continues developing. The token economics add another layer to the analysis. OPG has a total supply of 1 billion tokens, with allocations covering ecosystem development, the foundation, contributors, investors, staking rewards, liquidity, and airdrops. These allocations can support long-term development, but token distribution also matters when assessing potential selling pressure. An important detail is that approximately 9.13 million OPG tokens were scheduled to unlock on October 21, 2026. The market should distinguish between scheduled releases and actual selling: an unlock does not mean every token will immediately enter circulation or be sold. On the technical side, OPG is attempting to recover, but resistance remains important. The $0.1200–$0.1220 area is the first region I would watch. A convincing breakout above this zone, supported by stronger volume, could open the door toward $0.1260 and potentially $0.1300. On the downside, $0.1150 is an initial reference, followed by the $0.1100 region if selling pressure increases. My read is that OPG has an interesting AI infrastructure narrative, but the next move depends on whether buyers can maintain momentum above resistance. For a conditional long setup, I would wait for a confirmed breakout and successful retest. Entry zone: $0.1200–$0.1220 after confirmation SL: $0.1160 TP1: $0.1260 TP2: $0.1300 TP3: $0.1350 These are illustrative trading levels, not verified live chart signals. They should be reassessed against current price action and volume before entry. On the bearish side, a decisive break below $0.1150 would weaken the recovery thesis and increase the risk of a move toward $0.1100. A sustained move above $0.1220 would strengthen the bullish scenario. For now, I would avoid chasing the first green candle. The better opportunity would come from a confirmed breakout or a clear defense of support. The bigger OpenGradient thesis is whether verifiable AI infrastructure can generate sustainable network usage and meaningful token demand. The narrative is promising, but lasting market strength will depend on adoption, token economics, and buyers proving they can defend higher prices. #ByXIMPACT #NewFinancialPlatform $OPGUSDT $DIAMUSDT
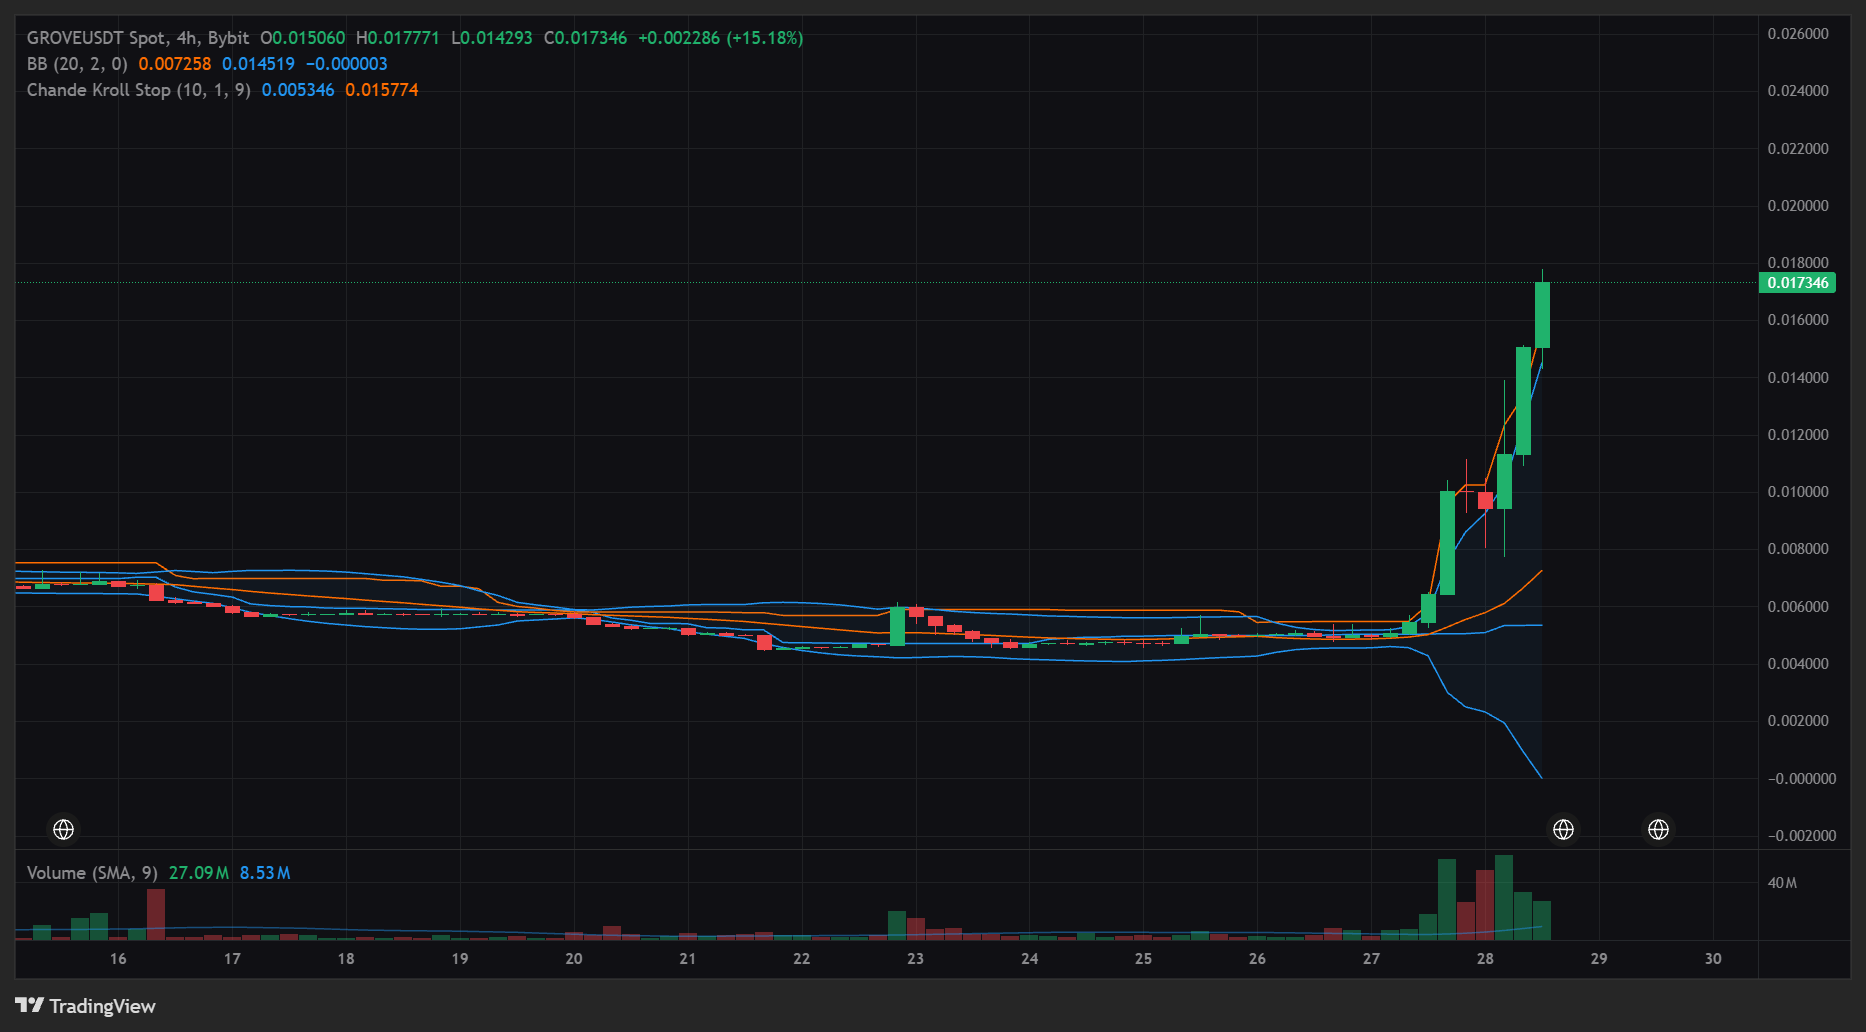
GROVE is showing an aggressive change in short-term behavior. After trading near $0.00497, the token surged toward $0.01530 before pulling back sharply. This type of move attracts attention, but it also raises an important question: is the market establishing a higher trading range, or are early buyers beginning to take profits? Market reports on October 28 placed GROVE near $0.00989 following an intraday rally that exceeded 200%. The retreat from the peak suggests that sellers are becoming active at higher prices. The key question now is whether buyers can defend $0.0100 and rebuild momentum. There is a fundamental development that makes this move more interesting than a purely speculative rally. Grove is positioning itself around institutional credit allocation and tokenized real-world assets within the Sky ecosystem. Its infrastructure is designed to direct stablecoin liquidity into credit strategies, including institutional lending. This gives the project a more specific economic purpose beyond short-term market speculation. Grove has also reported significant institutional lending capacity. Its financing arrangements include a warehouse lending facility established with Galaxy, supporting institutional borrowers through structured credit strategies. But I keep coming back to one distinction: lending growth does not automatically create buying pressure for GROVE. The important question is whether protocol activity translates into sustainable token demand and meaningful value capture. Without a clear connection between ecosystem growth and token utility, the underlying business can expand while the token remains vulnerable to speculative trading. The token economics add another layer to the analysis. GROVE has a reported total supply of 10 billion tokens. Circulating supply, liquidity depth, future distribution, and large-holder activity are important factors when evaluating whether the market can maintain its recent valuation. On the technical side, the breakout has created an important decision point. The $0.0100 area is the first level I would watch. Holding above it could help stabilize the recent move. Above the current trading region, resistance around $0.0120–$0.0130 needs to be reclaimed before a stronger recovery becomes convincing. The previous high near $0.01530 remains the major upside reference. My read is that GROVE has attracted substantial attention, but the market must now prove that this interest can translate into sustained demand. For a conditional long setup, I would wait for a move above $0.0120 with stronger volume, followed by a successful retest. Entry zone: $0.0120–$0.0125 after confirmation SL: $0.0105 TP1: $0.0135 TP2: $0.0144 TP3: $0.0153 These are illustrative levels based on the reported price structure, not verified live prices. Extreme volatility and slippage should be considered before entering a trade. On the bearish side, a decisive break below $0.0100 could expose the $0.0080 region. A sustained recovery above $0.0130 would weaken that immediate downside scenario. For now, I would avoid chasing the initial surge. A token rising more than 200% intraday can reverse just as quickly, especially when liquidity is limited. The bigger Grove thesis is whether institutional credit activity can create sustainable economic value for the token. The project has an interesting narrative, but the chart still needs to prove that demand can survive profit-taking and maintain a higher trading range. #ByXIMPACT #TradFiPerpOptions24/7 $GROVEUSDT $LAVAUSDT
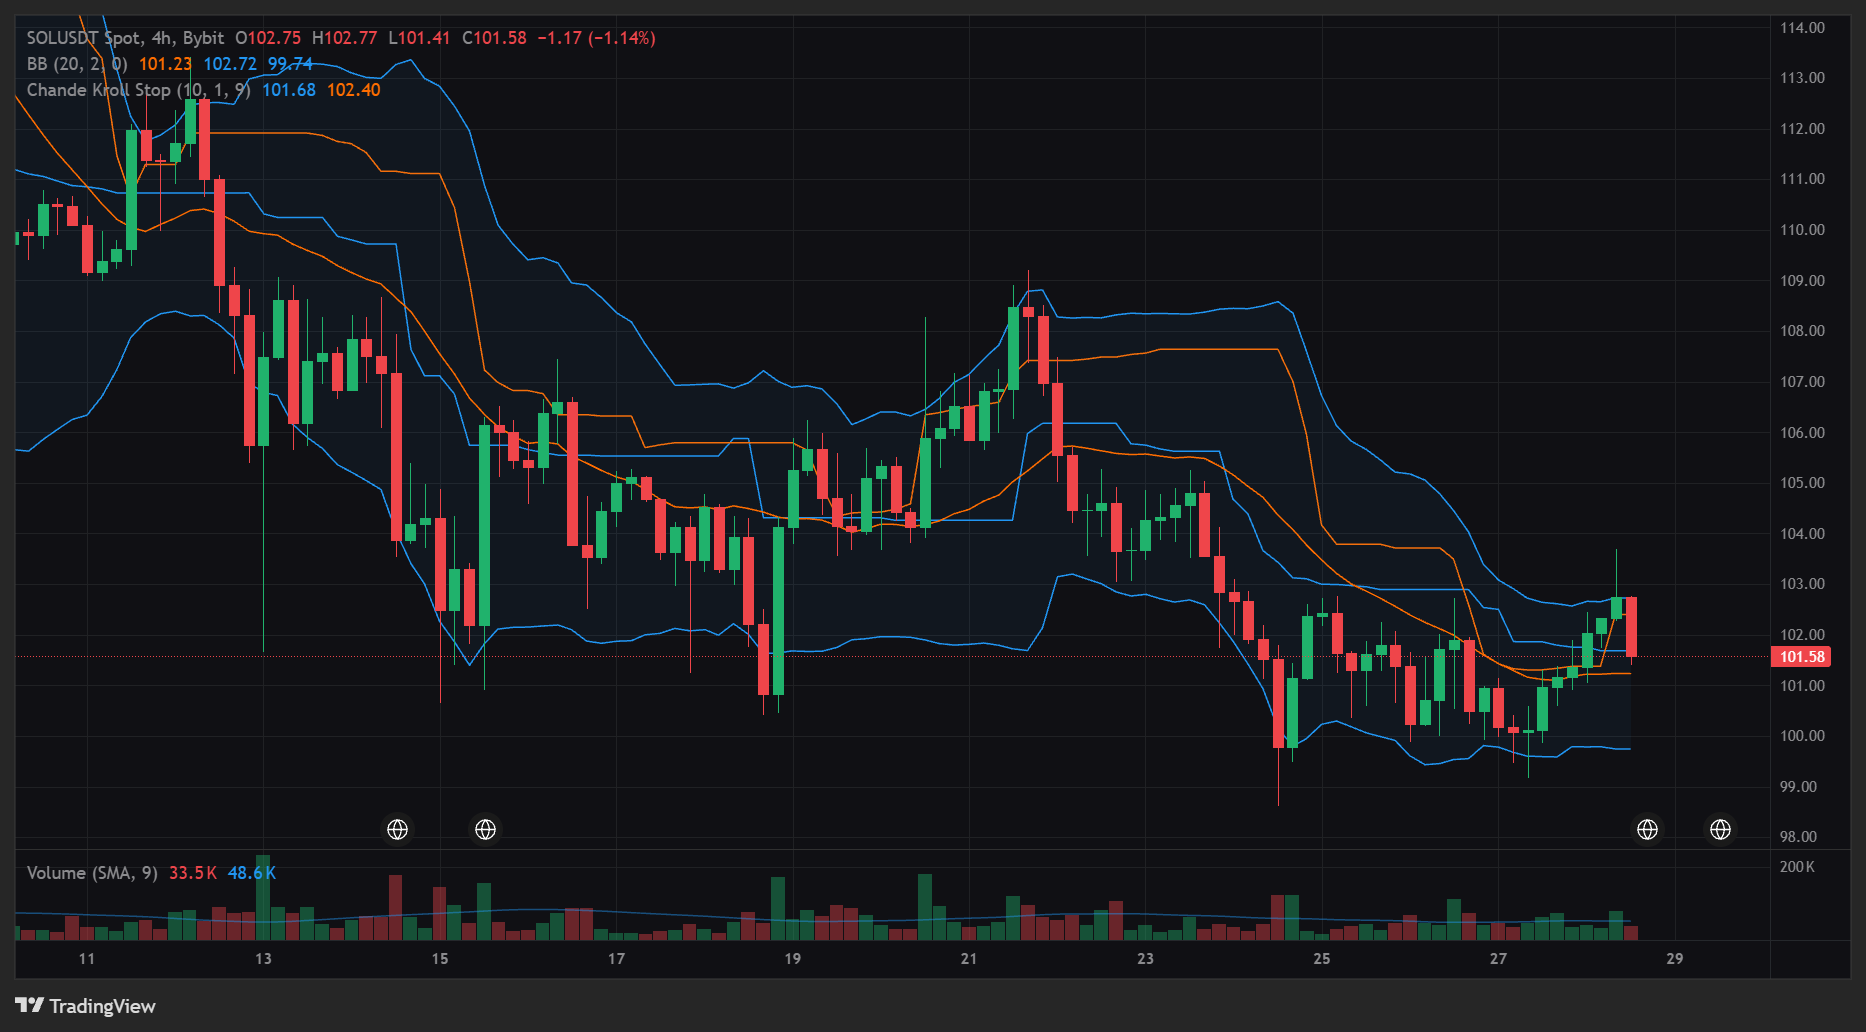
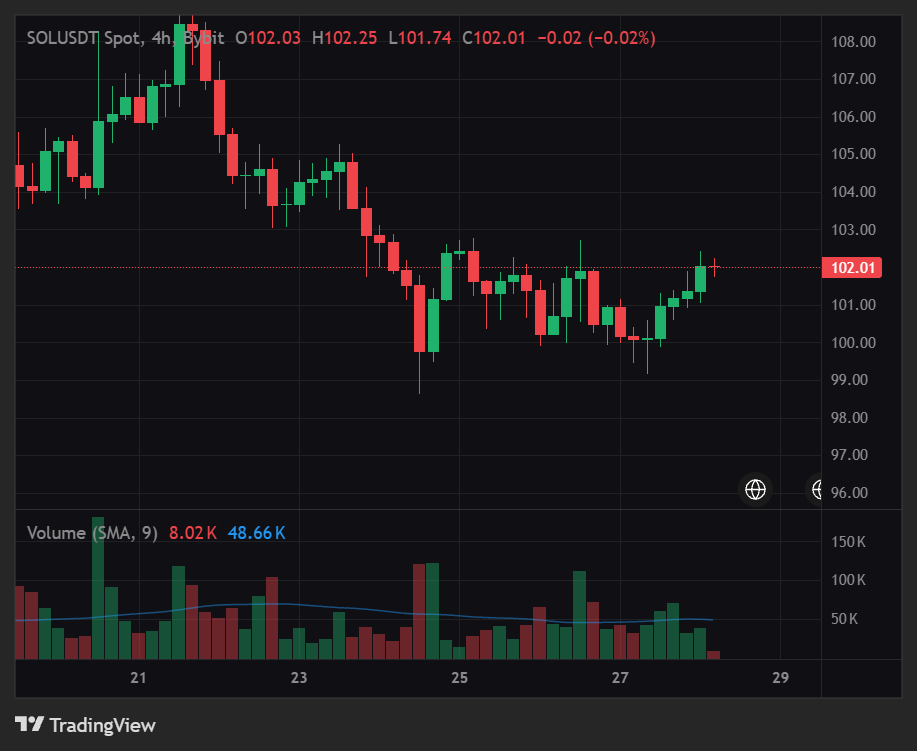
Solana is showing a market structure that deserves attention: the price is attempting to stabilize around $100, but the recovery still lacks the confirmation needed to call it a sustained bullish reversal. Recent market data placed SOL near $101.26 on October 28, with the token holding close to the psychologically important $100 level. The recent seven-day decline suggests that the current recovery is happening within a broader period of weakness. The question now is whether buyers can establish a stronger base or whether sellers will push the price toward the next support zone. There is a fundamental development that makes the current situation more interesting than a simple price rebound. Solana activated its Alpenglow consensus upgrade on October 21, targeting transaction finality of approximately 150 milliseconds compared with roughly 12.8 seconds under the previous system. Faster confirmation could make the network more attractive for trading applications, payments, and financial products that depend on quick settlement. But I keep coming back to one distinction: better network performance does not automatically translate into buying pressure for SOL. The real test is whether improved infrastructure attracts sustained economic activity. Higher transaction demand, deeper liquidity, and growing usage across decentralized finance and stablecoin applications would provide a stronger foundation for the token. Without that connection, a major technical upgrade can improve the network without immediately changing the market's valuation of SOL. Institutional demand also deserves attention. Recent reports indicate that US spot Solana ETFs experienced several consecutive weeks of net outflows during October. This suggests that institutional demand has weakened compared with the stronger inflow period seen earlier. ETF flows can change quickly, so I would not treat a short period of withdrawals as proof that long-term interest has disappeared. However, sustained outflows would make it harder to build a convincing bullish case. There is another risk worth watching: activity across the broader Solana ecosystem does not always benefit SOL equally. The network can support trading applications, stablecoins, and decentralized financial products, but the token's performance still depends on market demand, liquidity conditions, and investor positioning. Even when network activity remains healthy, SOL can struggle if capital rotates toward Bitcoin or moves out of riskier assets. On the technical side, the $100 area is the first important reference point. Recent market reporting identified $98.51 as a key support level following the October 24 low. If SOL continues to defend the $100 region and buyers reclaim nearby resistance, the market could attempt a stronger recovery. However, a break below $98.51 would weaken the stabilization thesis and expose the possibility of another move lower. My read is that SOL is approaching a decision point where price stability matters more than short-term optimism. For a conditional long setup, I would wait for SOL to reclaim the $103 area with stronger buying volume, followed by a successful retest. That would provide better confirmation than entering simply because the price is trading near $100. Entry zone: $102.50–$103.50 after confirmation SL: $99.80, below the reclaimed area TP1: $106.00 TP2: $109.00 TP3: $113.00 These are illustrative trading levels rather than verified live chart levels. They should be reassessed against the current price, resistance structure, and volatility before any trade is considered. On the bearish side, a decisive break below $98.51 would weaken the recovery scenario. If selling pressure continues, I would watch the $95–$96 area as a possible next reference zone rather than assuming the market must immediately bounce. A sustained recovery above $103 would weaken the immediate bearish scenario, particularly if accompanied by stronger spot volume and improving broader market sentiment. For now, I would avoid chasing a small recovery without confirmation. The more attractive setup would come from seeing whether buyers can reclaim resistance and then defend it as support. The bigger Solana thesis is not simply whether the network can process transactions faster. It is whether infrastructure improvements can translate into lasting demand, deeper liquidity, and sustainable economic activity while institutional interest recovers. SOL still has a meaningful ecosystem story, but the market needs to confirm that story through price action and sustained demand. Until then, patience and disciplined risk management remain more important than trying to predict the next breakout. #ByXIMPACT #MakeYourMove $SOLUSDT $BTCUSDT
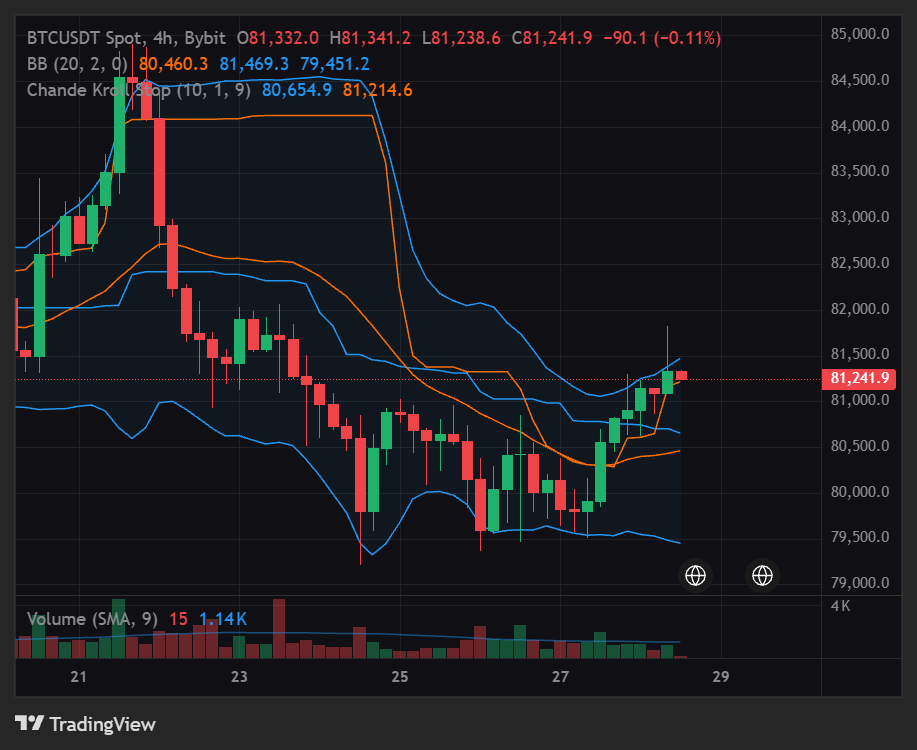
Bitcoin is showing a cautious recovery after slipping below $80,000, but the latest price action suggests that buyers still need to prove they can turn this rebound into a sustained move higher. BTC was trading around $80,947 in the early hours of October 28, recovering from a recent low near $79,500. The market has managed to reclaim the $80,000 level, but resistance around $81,400–$82,000 remains important. The question now is whether buyers can build enough momentum to push Bitcoin out of its recent consolidation or whether sellers will use the recovery as another opportunity to exit. There is a fundamental development that makes this recovery more interesting than a purely technical bounce. Institutional demand is showing some signs of returning. On October 26, US spot Bitcoin ETFs recorded approximately $110.3 million in net inflows after two consecutive sessions of substantial withdrawals. Preliminary figures for October 27 also indicated another day of positive flows, although the final totals needed confirmation. This suggests that institutional buyers may still be willing to support Bitcoin at lower prices, but the consistency of that demand remains important. But I keep coming back to one distinction: ETF inflows on a single day do not automatically confirm a broader bullish reversal. Bitcoin needs sustained spot demand to absorb selling pressure and establish a stronger base. If inflows continue while price holds above support, the recovery becomes more convincing. If institutional demand fades and buyers cannot reclaim resistance, the market may remain vulnerable to another downside move. The macroeconomic environment adds another layer to the analysis. The Federal Reserve's October 28 decision is a major event for the market. Interest-rate expectations, Treasury yields, and the US dollar can all influence demand for risk assets such as Bitcoin. A less restrictive outlook could support a recovery, while a more hawkish message could put pressure on prices. With the decision approaching, traders should be prepared for volatility in either direction rather than assuming that the current bounce will continue. Bitcoin's exchange flows also deserve attention. Recent reporting indicated that approximately 14,942 BTC left exchanges on a net basis on October 27, the largest daily net outflow in five weeks according to Santiment. This could indicate reduced immediately available selling supply, although exchange withdrawals alone cannot confirm that investors are accumulating for the long term. On the technical side, Bitcoin is showing early signs of stabilization, but the recovery still needs confirmation. The price has moved back above $80,000 after testing lower levels, while the $79,200–$79,500 region remains an important support area. The next challenge is the $81,400–$82,000 resistance zone. A sustained move above this area could improve short-term momentum and open the door toward $82,500–$84,000. However, a brief move above resistance would not be enough on its own. I would want to see a convincing candle close, stronger spot volume, and a successful retest before treating the move as a confirmed breakout. My read is that Bitcoin is attempting to stabilize, but the market is approaching a decision point where both macroeconomic developments and actual buying pressure could determine the next move. For a conditional long setup, I would look for a confirmed breakout above $82,000, followed by a successful retest with buyers defending the reclaimed level. Entry zone: $81,800–$82,200 after confirmation SL: $80,700, below the breakout area TP1: $83,500 TP2: $84,500 TP3: $86,000 These are illustrative trade levels based on the recent market structure, not verified live execution prices. The setup should be reassessed against the current chart before entry, particularly around the Federal Reserve announcement. On the bearish side, a decisive break below $79,200 would weaken the recovery thesis and expose the $77,500–$78,000 area. If Bitcoin loses support while selling volume increases, I would be cautious about treating every dip as a buying opportunity. For now, I would avoid chasing a green candle just because BTC has reclaimed $80,000. The more attractive setup would come from either a confirmed breakout above resistance or a clear defense of support followed by a stronger recovery. The bigger Bitcoin story is not simply whether the price can bounce after a decline. It is whether institutional demand can remain consistent while macroeconomic uncertainty puts pressure on risk appetite. ETF flows, the Federal Reserve's outlook, and the market's response around $82,000 will help determine whether this recovery has room to develop into something more durable. Bitcoin is showing signs of stabilization, but confirmation matters more than optimism. Until buyers establish a stronger position above resistance, protecting capital and waiting for a clearer setup remain the more disciplined approach. #ByXIMPACT #WSOT2026 #IMPACTbyTrade $BTCUSDT $GRAMUSDT
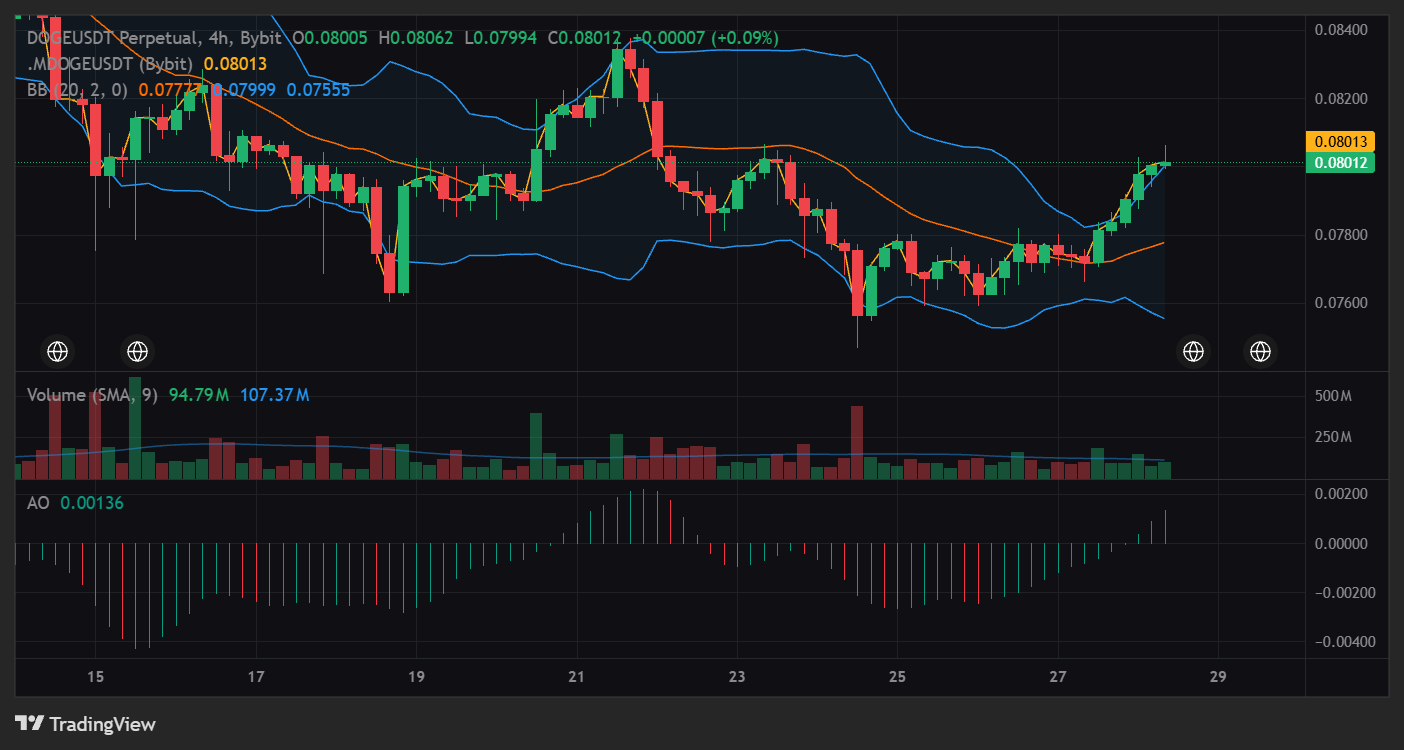
DOGECOIN AT A CRITICAL TURNING POINT! While traders wait for the next meme coin rally, Dogecoin is struggling to build a convincing recovery. DOGE/USDT is trading around $0.08, with buyers looking for a way to regain control after continued selling pressure. The key question is whether this area can support a rebound or whether sellers will push the price toward fresh lows. THE BULLISH NEWS Dogecoin continues to attract attention because of its established community, broad market recognition, and growing integration across crypto platforms. However, recent market weakness highlights the importance of actual buying demand rather than social media excitement alone. With meme coins remaining sensitive to Bitcoin's direction and overall risk appetite, traders need confirmation before assuming a sustained reversal. KEY LEVELS TO WATCH Above $0.085: a confirmed breakout could open the way toward $0.090–$0.095. Between $0.080 and $0.085: possible consolidation as buyers attempt to establish support. Below $0.080: renewed selling pressure could bring $0.075 and $0.070 into focus. Recent market data places DOGE near $0.08, with the broader market still showing weakness. A sustained move above nearby resistance would strengthen the recovery scenario, while a breakdown below support could extend the bearish structure. These levels are technical reference points, not guaranteed targets. Trading strategy Long setup: Consider an entry only after a confirmed breakout above $0.085 and a successful retest. Potential targets: $0.090, followed by $0.095. Invalidation: A failed breakout followed by a move below $0.082 would weaken the immediate bullish setup. Determine the actual stop-loss from your entry price and risk limit. Short setup: A confirmed breakdown below $0.080 could create a move toward $0.075 and $0.070. Wait for a clear breakdown and follow-through instead of reacting to a single bearish candle. Risk warning: DOGE is a volatile cryptocurrency with an uncapped maximum supply and ongoing issuance. Market sentiment, large transactions, derivatives liquidations, and sudden Bitcoin movements can cause sharp price swings in either direction. Avoid oversized positions and protect your capital. Bitcoin's direction, meme coin demand, trading volume, and broader market liquidity could determine Dogecoin's next major move. Don't chase a bounce just because the price looks cheap. Wait for confirmation, manage your risk, and trade the chart rather than the hype. Can DOGE reclaim $0.085 and move toward $0.095, or will sellers push it below $0.080? #ByXIMPACT #WSOT2026 #AnthropicS1Filing #IMPACTbyTrade $DOGEUSDT
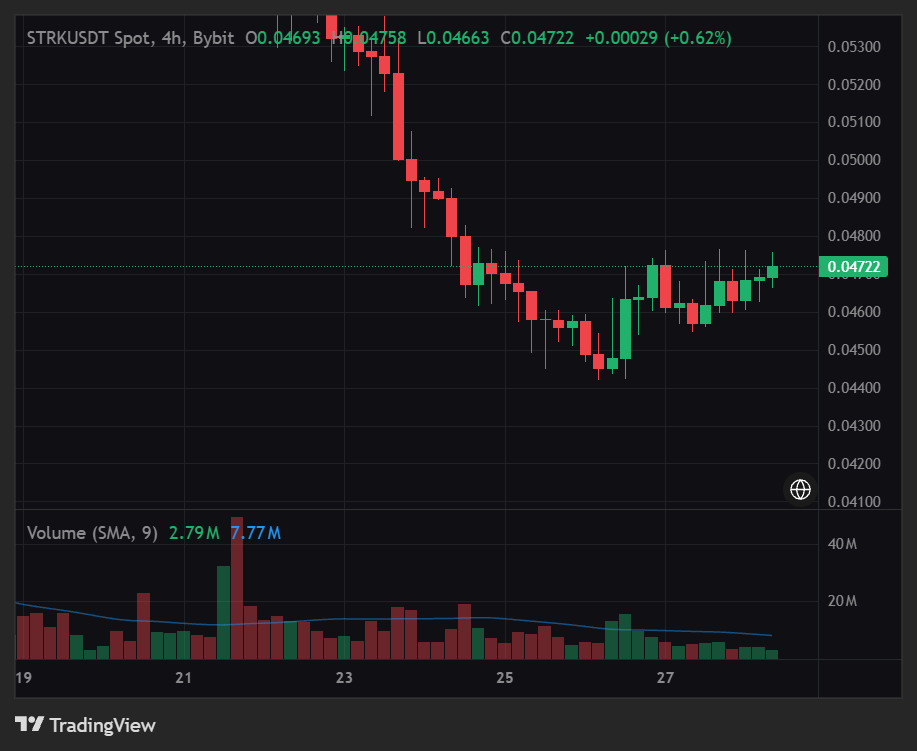
Activity analysis on $STRKUSDT We are seeing an interesting situation on the hourly chart. We can see the price dropping locally but the volumes are consistently high (rel vol = 2.49881). Is this aggressive selling or is it hidden accumulation by a large player? Let’s look at the key figures: Support: 0.04552 – This is a key support level. If this is respected then the bullish scenario is viable. Resistance: 0.04735 – Breakout and consolidation above this level will present a potential recovery. VWAP: 0.0464173 – This is the key level between bulls and bears. RSI: 50.3801 – On the hourly chart, this shows a neutral position and signs of stabilisation. Interpretation Bears: Increasing volumes in a downtrend traditionally indicate that sellers are dominating the market. However, if the price is confidently above the VWAP (0.0464173) on increasing volumes then this thesis is no longer valid. It indicates that bulls are dominating. Selling climax: High volumes indicate that we are in an accumulation phase. Large capital is accumulating positions from panicking weak hands. This interpretation is supported by the stabilisation of the RSI. However, if the price breaks below support (0.04552) on decreasing volumes then this is immediately invalidated. Trading Plan Long: Price is consolidating above VWAP (0.0464173) with heavy volumes. Expect price to test resistance (0.04735). Short/risk management: Price breaks below support (0.04552) with no signs of a buyback. This indicates a strong bear momentum is forming. Revaluation trigger: #WSOT2026 Response to resistance zone (0.04735). #AnthropicS1Filing #IMPACTbyTrade #ByXIMPACT
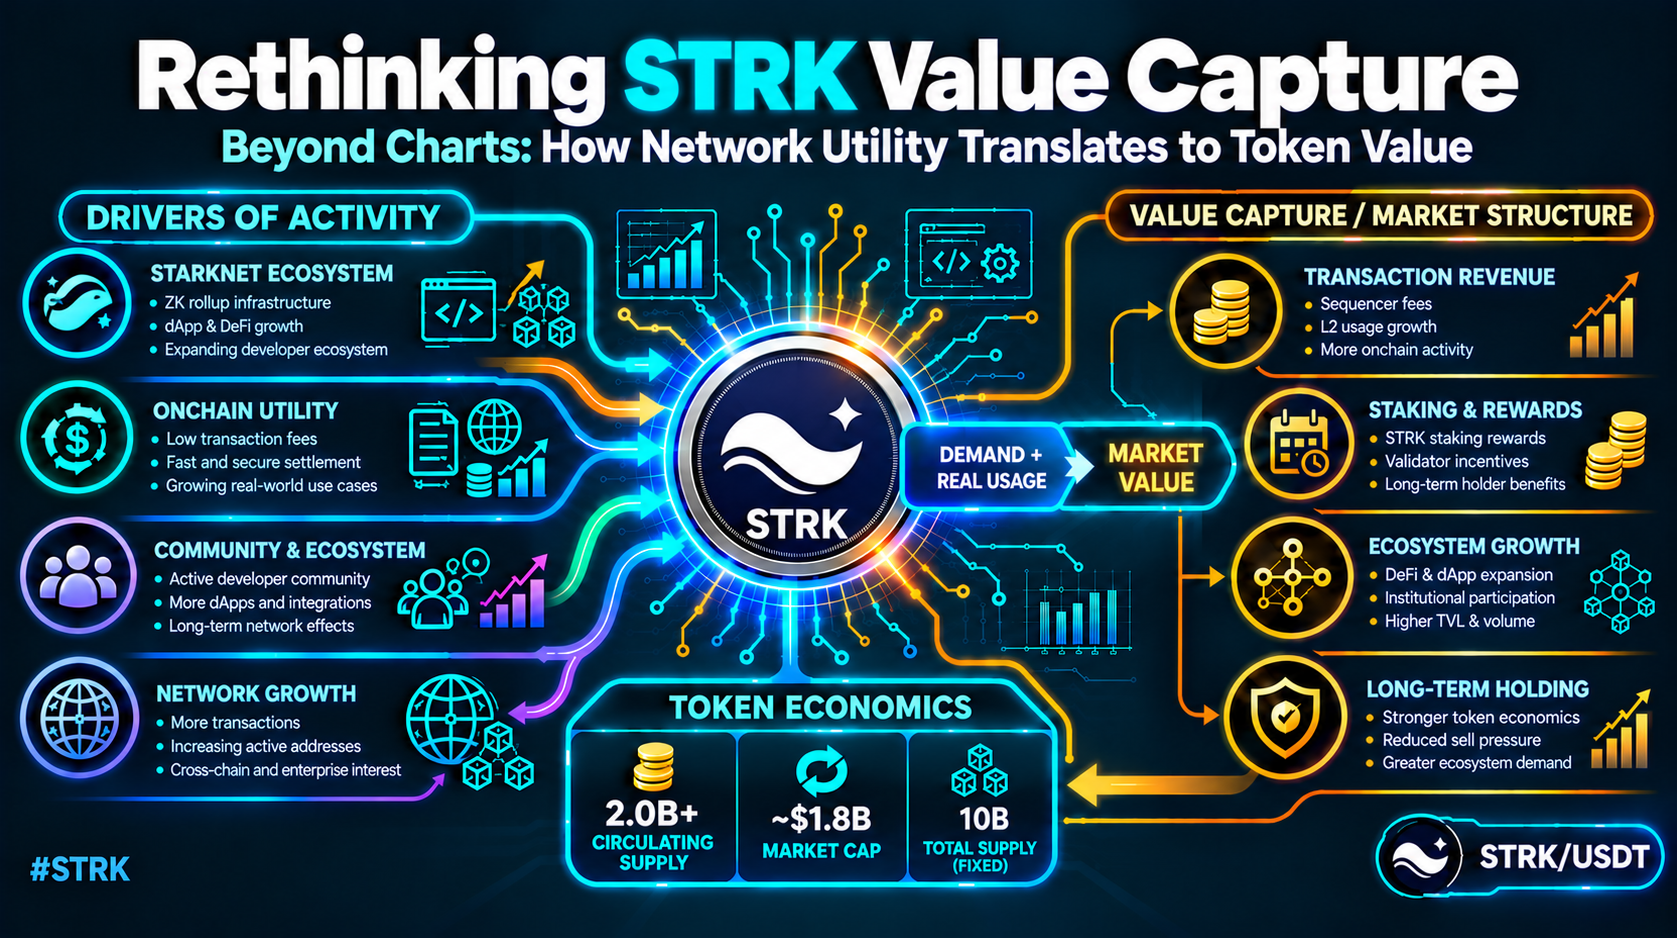
NEAR: Can Buybacks Outpace New Supply? NEAR’s real question is no longer network growth. It is how much of that growth translates into demand. 1. Intents generates meaningful revenue Recent DefiLlama data shows NEAR Intents generated $6.31 million in fees and $2.16 million in protocol revenue over 30 days. That creates a source of market-buying demand. 2. Revenue is not the same as verified buybacks The reported $7.24 million in holders’ revenue should not automatically be treated as $7.24 million of confirmed token purchases. Actual purchase amounts and timing require on-chain verification. Bought tokens are also not necessarily burned. 3. Issuance remains part of the equation A governance proposal seeks to reduce NEAR’s annual issuance rate from 2.5% to 1.6%. If approved and implemented this could reduce supply pressure. Until then it remains a proposal—not a completed change. 4. Price structure shows a recovery, not a confirmed breakout At the time of the Bybit chart snapshot NEAR traded at $4.735: - MA7: $4.656 - MA14: $4.850 - MA28: $4.943 - 24h /low: $4.804 / $4.391 Price is above MA7 but below MA14 and MA28. That suggests a short-term rebound while the broader moving-average structure still needs confirmation. My conclusion: $NEARUSDT has a revenue-to-buyback mechanism but the key question is how much NEAR is actually purchased relative, to new issuance. Strong activity alone does not guarantee appreciation. What I’m watching: verified buyback transactions, the issuance vote outcome and whether price can reclaim MA14 and MA28. #ByXIMPACT $NEARUSDT

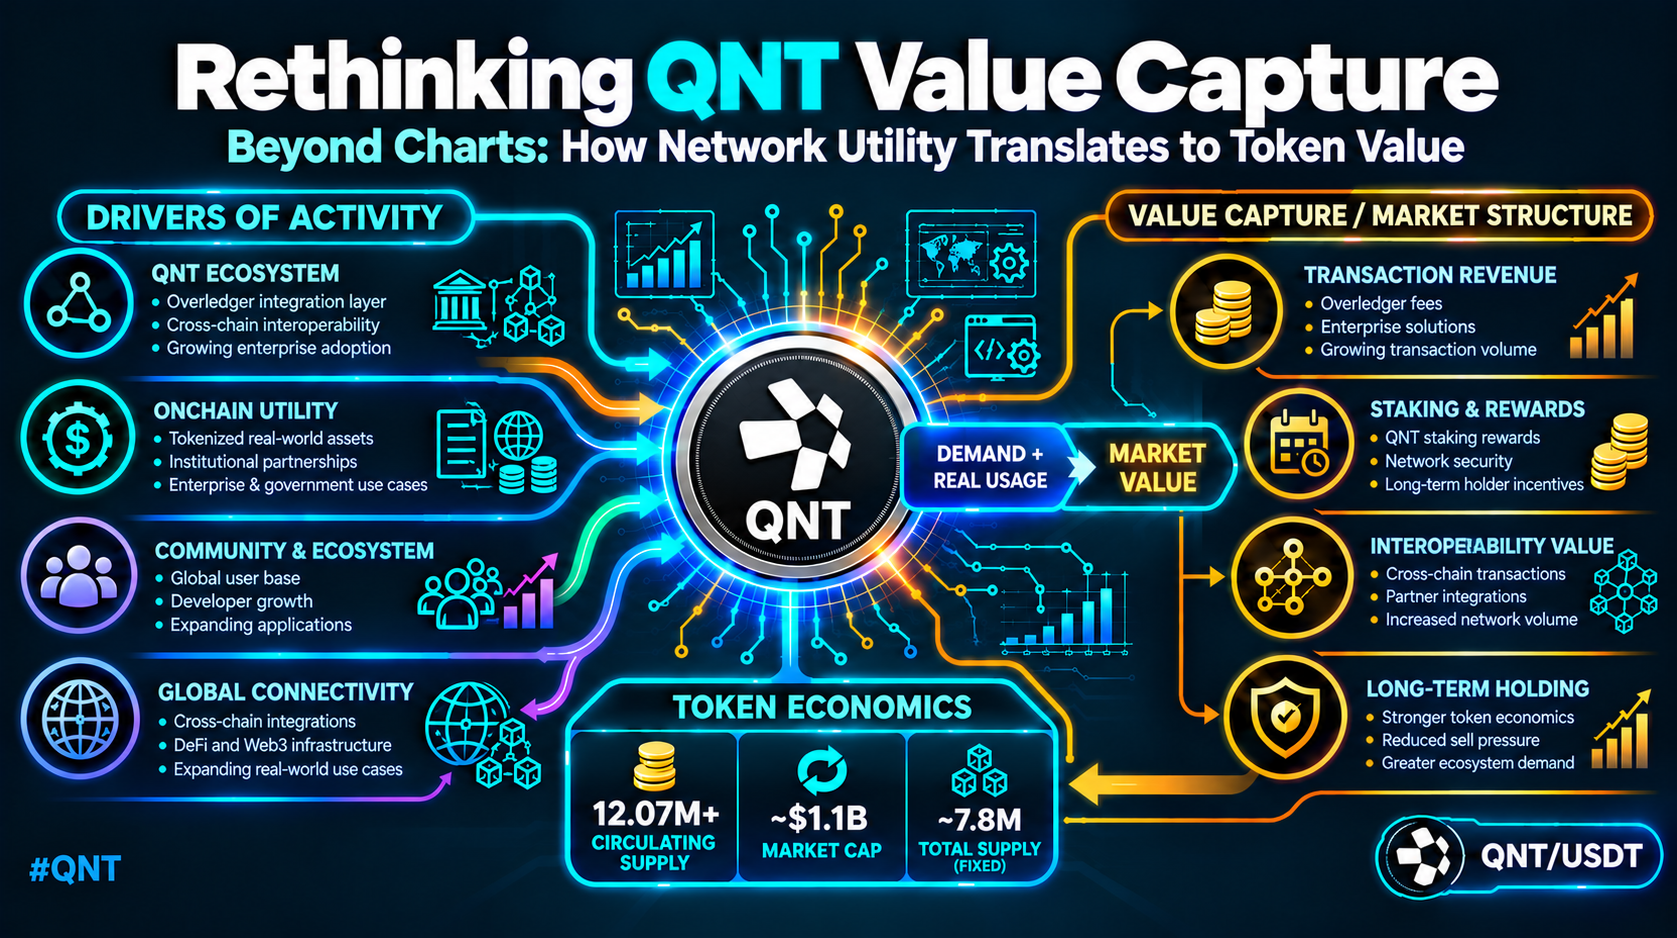
$QNTUSDT is trading around the $207 area after rebounding from the $173-$177 support zone, and I'm watching $214 closely. What caught my attention is the strength of this recovery despite weakness across parts of the broader crypto market. However, after such a sharp rally, the next challenge is proving that buyers can sustain momentum rather than allowing the move to fade into another correction. Quant's institutional adoption story remains a major catalyst. The Clearing House selected Quant to support its On-Chain Money Initiative, which aims to facilitate the movement and settlement of tokenized bank deposits. The network is targeting institutional access in the first half of 2027, giving the market a concrete milestone to watch. These developments strengthen Quant's long-term positioning in financial infrastructure, but there is an important distinction: institutional adoption of Quant's technology does not automatically guarantee sustained buying demand for QNT. The market still needs evidence that adoption, token utility and investor demand can reinforce one another. The price action adds another layer. QNT recently surged above $200 after recovering from its October lows, but the rally has encountered resistance around $214-$215. With a relatively limited circulating supply, buying pressure can produce sharp moves in either direction. That creates opportunity, but it also increases the risk of volatility if momentum weakens. **Key figures** $207 - Recent price area $214-$215 - Immediate resistance zone $200 - Key psychological support $173-$177 - Major downside support zone $251 - Potential upside resistance $373 - September swing-high area Bullish confirmation: QNT holds above $200, breaks $215 with stronger spot volume, and establishes the former resistance as support. That would improve the recovery structure and open the possibility of a move toward $230-$251. Bearish confirmation: QNT fails to break $214-$215 and loses $200. That would suggest the recovery is losing momentum and could bring $185-$190 into focus, with $173-$177 becoming important if selling pressure accelerates. I'm not treating the institutional narrative or the recent rally as an automatic buy signal. For QNT, the stronger setup comes when buyers defend support, spot volume confirms the breakout, and price action begins to validate the longer-term adoption story. #ByXIMPACT #AnthropicS1Filing #WSOT2026 $QNTUSDT
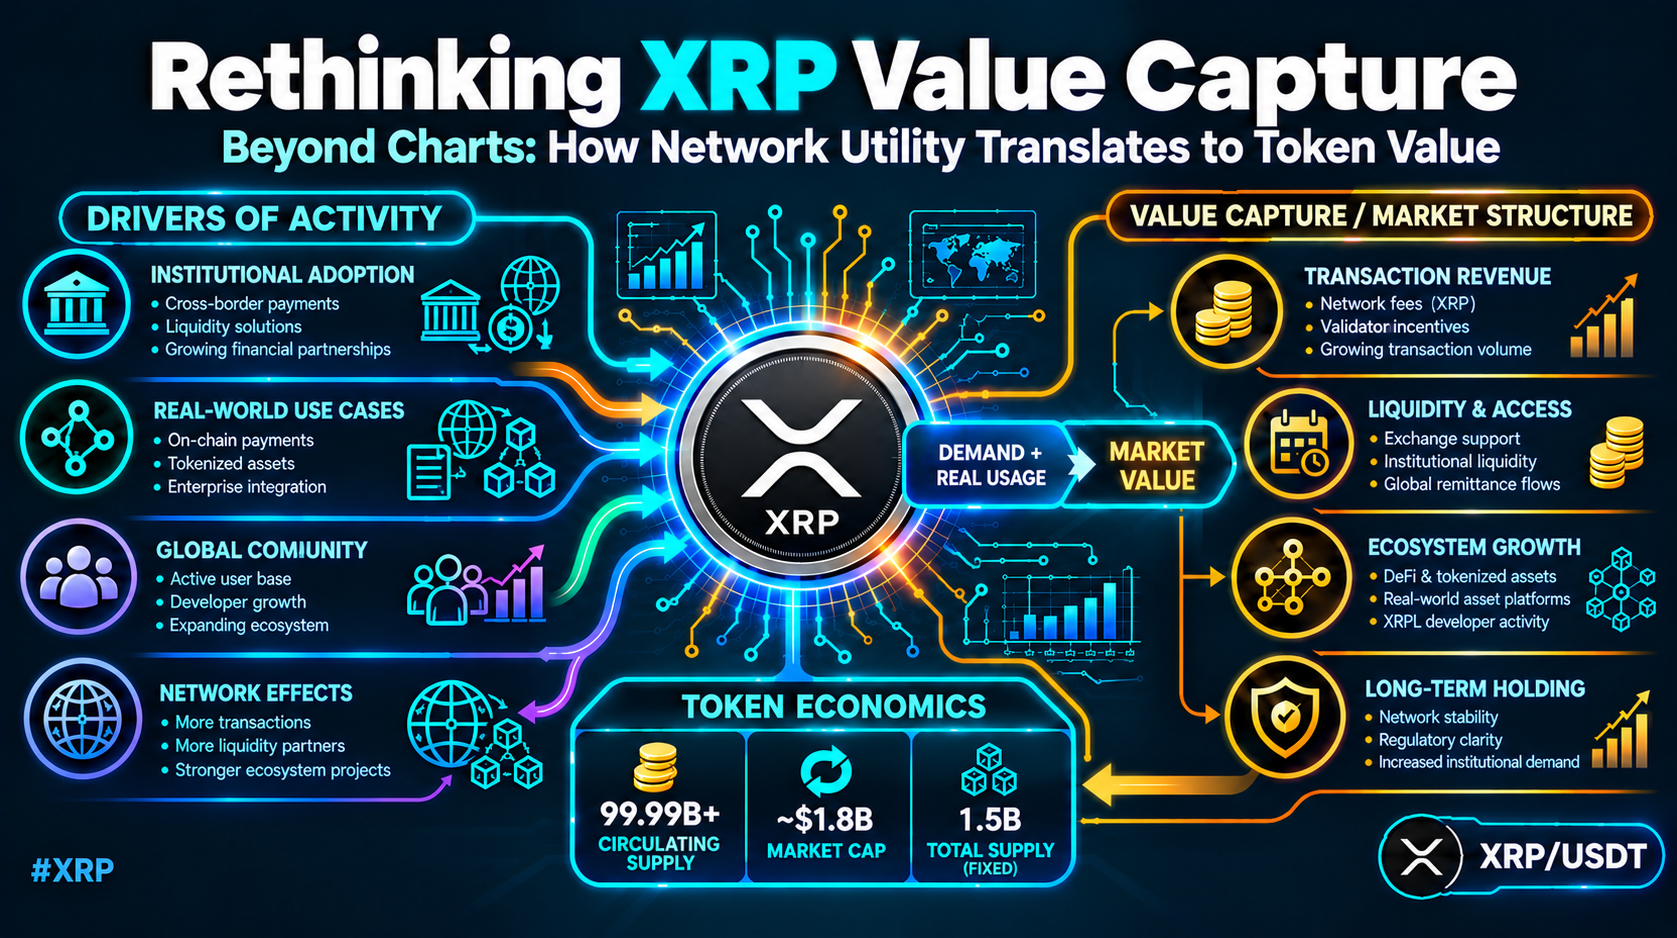
XRP AT A CRITICAL TURNING POINT! While traders wait for the next major crypto move, XRP is attempting to build a recovery after defending the $1.30 support area. XRP/USDT is trading near $1.33, with buyers trying to maintain upward momentum. The key question is whether XRP can break through nearby resistance or whether sellers will push the price back toward support. THE BULLISH NEWS Ripple received final approval for its national trust bank from the US Office of the Comptroller of the Currency on October 26, 2026. This is an important regulatory development for Ripple's institutional strategy, although it does not automatically guarantee increased demand for XRP. Traders should separate progress in Ripple's business from actual buying pressure in the XRP market. KEY LEVELS TO WATCH Above $1.35: a confirmed breakout could open the way toward $1.38–$1.40. Between $1.30 and $1.35: possible consolidation as buyers and sellers compete for control. Below $1.30: renewed selling pressure could bring $1.29 and $1.28 into focus. Recent market data places XRP near $1.33, with $1.309 acting as an important short-term pivot and $1.349 as nearby resistance. Holding above support would keep the recovery scenario alive, but the broader trend still needs confirmation. Trading strategy Long setup: Consider an entry only after a confirmed breakout above $1.35 and a successful retest. Potential targets: $1.38, followed by $1.40. Invalidation: A failed breakout followed by a move below $1.33 would weaken the immediate bullish setup. Determine the actual stop-loss from your entry price and risk limit. Short setup: A confirmed breakdown below $1.30 could create a move toward $1.29 and $1.28. A sustained break below $1.28 would further weaken the structure and could expose lower support zones. Risk warning: XRP remains a volatile crypto asset. Regulatory developments, Bitcoin's direction, derivatives positioning, liquidity, and broader market sentiment can quickly change the outlook. Avoid oversized positions and always define your risk before entering a trade. The Federal Reserve's policy decision, institutional developments, XRP market demand, and broader crypto liquidity could determine the next major move. Don't chase the bounce. Wait for confirmation, protect your capital, and trade the chart rather than the hype. Can XRP break above $1.35 and move toward $1.40, or will sellers push it back below $1.30? #WSOT2026 #AnthropicS1Filing #IMPACTbyTrade #MyByXTake #ByXIMPACT $XRPUSDT
# MNT AT A CRITICAL TURNING POINT! While traders search for the next altcoin opportunity, Mantle is approaching another important moment. MNT/USDT remains sensitive to broader market sentiment, trading activity, and demand around key technical levels. Buyers need to establish control above resistance to strengthen the recovery, while a failure to hold support could invite another wave of selling. THE BULLISH NEWS Mantle continues to develop its Ethereum-compatible ecosystem, with a focus on decentralized finance, liquidity, and scalable blockchain infrastructure. Its ecosystem and treasury resources remain important parts of the broader investment narrative. However, ecosystem development does not automatically translate into immediate token-price appreciation. Traders should monitor actual network activity, liquidity, and market demand alongside the chart. KEY LEVELS TO WATCH Above the recent swing high: a confirmed breakout could open the way toward the next resistance zone and strengthen bullish momentum. Around the nearest support: buyers may attempt to stabilize price and build a base for recovery. Below support: renewed selling pressure could push MNT toward lower demand zones and weaken the current structure. The exact support, resistance, and breakout levels should be confirmed using the latest MNT/USDT chart rather than relying on unverified price estimates. Trading strategy Long setup: Consider an entry only after a confirmed breakout above the latest swing high and a successful retest. Potential targets: The next resistance zone, followed by the subsequent major swing high. Invalidation: A failed breakout followed by a move below the reclaimed support would weaken the bullish setup. Determine the actual stop-loss from your entry price and risk limit. Short setup: A confirmed breakdown below established support could create a downside opportunity toward the next demand zone. Wait for confirmation instead of reacting to a single bearish candle. Risk warning: MNT is a volatile crypto asset. Changes in Bitcoin's direction, market liquidity, token supply, and broader altcoin sentiment can quickly change the outlook. Use appropriate position sizing and avoid risking more than you can afford to lose. Mantle ecosystem adoption, DeFi activity, liquidity conditions, token supply dynamics, and the broader crypto market could determine MNT's next major move. Don't chase the move. Wait for confirmation, protect your capital, and trade the chart rather than the hype. Can MNT break above its recent swing high and extend the recovery, or will sellers push it back toward support?#ByXIMPACT $MNTUSDT

SOLANA AT A CRITICAL TURNING POINT! While traders wait for the next major move in the crypto market, Solana is approaching an important decision point. SOL/USDT remains sensitive to Bitcoin's direction, market liquidity, and demand across the broader altcoin sector. Buyers need to reclaim resistance to strengthen the recovery, while another rejection could bring renewed selling pressure. THE BULLISH NEWS Solana continues to attract attention because of its fast transaction processing, low transaction costs, and growing ecosystem of decentralized applications. Activity across DeFi, decentralized exchanges, and on-chain trading can support demand for the network. However, ecosystem growth alone does not guarantee an immediate price increase, and broader market conditions remain important. KEY LEVELS TO WATCH Above the recent swing high: a confirmed breakout could open the way toward the next resistance zone and strengthen bullish momentum. Around the nearest support: buyers may attempt to establish a base and prepare for another recovery. Below support: continued selling pressure could push SOL toward lower demand zones and weaken the short-term structure. The exact support, resistance, and breakout levels should be confirmed using the latest SOL/USDT chart rather than relying on unverified price estimates. Trading strategy Long setup: Consider an entry only after a confirmed breakout above the latest swing high and a successful retest. Potential targets: The next resistance zone, followed by the subsequent major swing high. Invalidation: A failed breakout followed by a move below the reclaimed support would weaken the bullish setup. Determine the actual stop-loss from your entry price and risk limit. Short setup: A confirmed breakdown below established support could create a downside opportunity toward the next demand zone. Wait for price confirmation rather than reacting to a single bearish candle. Risk warning: SOL remains a volatile crypto asset. Sudden Bitcoin movements, liquidations, changing liquidity, and shifts in market sentiment can quickly invalidate a trading setup. Use appropriate position sizing and avoid risking more than you can afford to lose. Bitcoin's direction, Solana network activity, DeFi demand, institutional interest, and overall market liquidity could determine SOL's next major move. Don't chase the move. Wait for confirmation, protect your capital, and trade the chart rather than the hype. Can SOL break above its recent swing high and continue recovering, or will sellers push it back toward support? #ByXIMPACT $SOLUSDT
DIGITAL GOLD AT A CRITICAL TURNING POINT! While crypto traders watch Bitcoin and altcoins, gold is fighting to maintain its recovery. XAUT/USDT moved back above $4,000 after testing lower levels, with the latest market data showing a recovery toward $4,060. Buyers are returning, but the big question is whether this rebound can continue or sellers will regain control. THE BULLISH NEWS Gold remains in focus as investors assess Federal Reserve policy, inflation risks, and geopolitical uncertainty. XAUT represents one troy ounce of gold held in a London Good Delivery bar, providing tokenized exposure to the precious metal. However, the token's market price can differ from the underlying gold benchmark, and a recovery in gold does not guarantee continued upside. KEY LEVELS TO WATCH Above $4,065: a confirmed breakout could open the way toward $4,100–$4,125. Between $4,000 and $4,065: possible consolidation as buyers and sellers compete for control. Below $4,000: renewed selling pressure could bring $3,975 and $3,950 into focus. Reuters reported on October 27 that a stronger US dollar and elevated Treasury yields pressured gold ahead of the Federal Reserve decision. Traders are also watching inflation data and the central bank's policy outlook. These macroeconomic factors could determine whether gold extends its recovery or faces another pullback. Trading strategy Long setup: Consider an entry only after a confirmed breakout above $4,065 and a successful retest. Potential targets: $4,100, followed by $4,125. Invalidation: A failed breakout followed by a move below $4,040 would weaken the immediate bullish setup. Determine the actual stop-loss from your entry price and risk limit. Short setup: A confirmed breakdown below $4,000 could create a move toward $3,975 and $3,950. Wait for a clear breakdown and follow-through rather than entering on a single bearish candle. Risk warning: XAUT is backed by physical gold, but exchange liquidity, spreads, custody arrangements, redemption conditions, and market-price deviations can still create losses. Gold-backed does not mean risk-free. The US dollar, Treasury yields, Federal Reserve signals, inflation expectations, and geopolitical developments could determine gold's next major move. Don't chase the rebound. Wait for confirmation, protect your capital, and trade the chart rather than the hype. Can XAUT break above $4,065 and move toward $4,100, or will sellers push it back below $4,000? #ByXIMPACT #IMPACTbyTrade #MyByXTake $XAUTUSDT

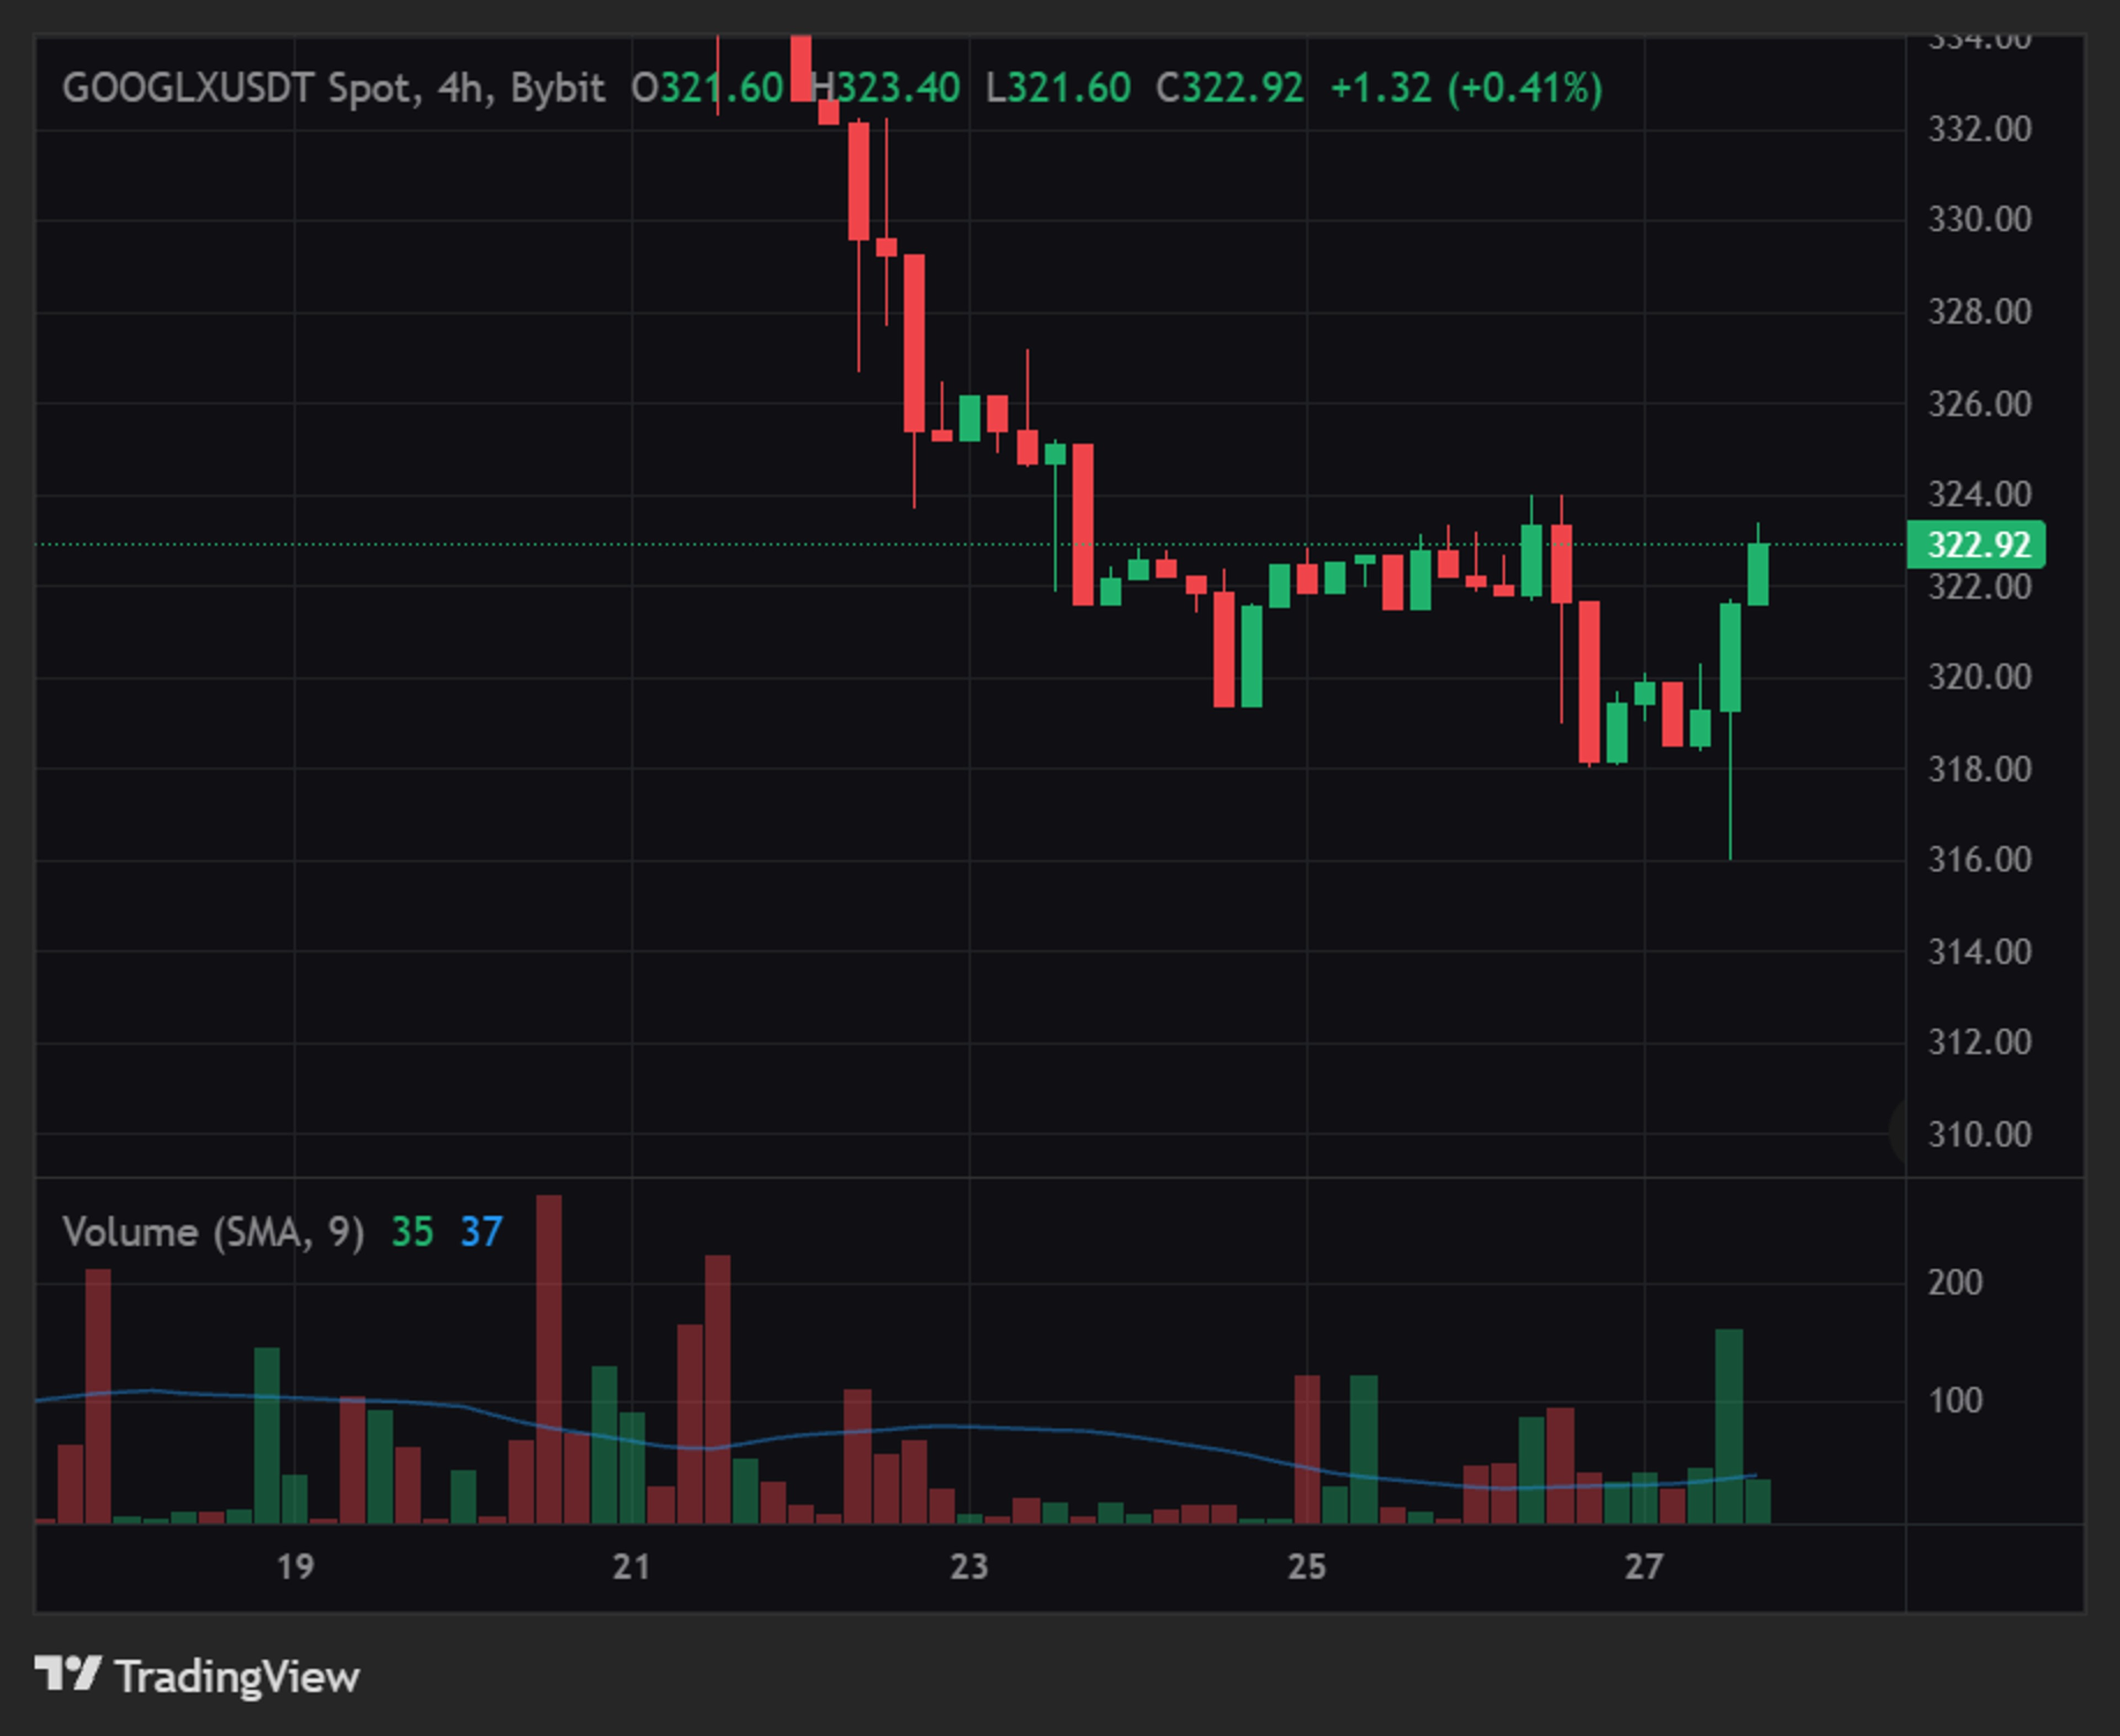
GOOGLX/USDT AT A CRITICAL TURNING POINT! While traders search for the next opportunity in crypto, tokenized exposure to major technology stocks is also worth watching. GOOGLX/USDT offers market exposure linked to Alphabet, Google's parent company, making its direction closely connected to technology-sector sentiment. The key question is whether buyers can establish a stronger recovery or sellers will maintain control. THE BULLISH NEWS Alphabet continues to benefit from its position in digital advertising, cloud computing, and artificial intelligence. AI development and cloud demand remain important factors for its long-term growth outlook. However, strong business fundamentals do not guarantee short-term price gains, and traders should watch Alphabet's share-price movements, earnings expectations, and broader market conditions. KEY LEVELS TO WATCH Above the recent swing high: a confirmed breakout could signal further recovery toward the next resistance zone. Around the nearest support: buyers may attempt to stabilize price and build a stronger base. Below support: selling pressure could increase, potentially opening the way toward lower demand zones. The exact support, resistance, and breakout levels should be confirmed using the latest GOOGLX/USDT chart rather than relying on unverified price estimates. Trading strategy Long setup: Consider an entry only after a confirmed breakout above the latest swing high and a successful retest. Potential targets: The next resistance zone, followed by the subsequent major swing high. Invalidation: A failed breakout followed by a move below the reclaimed support would weaken the bullish setup. Determine the actual stop-loss from your entry and risk limit. Short setup: A confirmed breakdown below established support could create a downside opportunity toward the next demand zone. Wait for confirmation instead of reacting to a single bearish candle. Risk warning: GOOGLX is a tokenized stock-related asset, not a conventional cryptocurrency. Its price may be influenced by Alphabet shares, trading liquidity, spreads, issuer arrangements, and platform-specific conditions. Check the token's underlying structure and trading terms before opening a position. Alphabet's AI investments, cloud business, advertising revenue, earnings outlook, and broader technology-sector sentiment could determine its next direction. Don't chase the move. Wait for confirmation, protect your capital, and trade the chart rather than the hype. Can GOOGLX break above its recent swing high and continue recovering, or will sellers push it back toward support? #ByXIMPACT #WSOT2026 #AnthropicS1Filing #IMPACTbyTrade #MyByXTake $GOOGLXUSDT

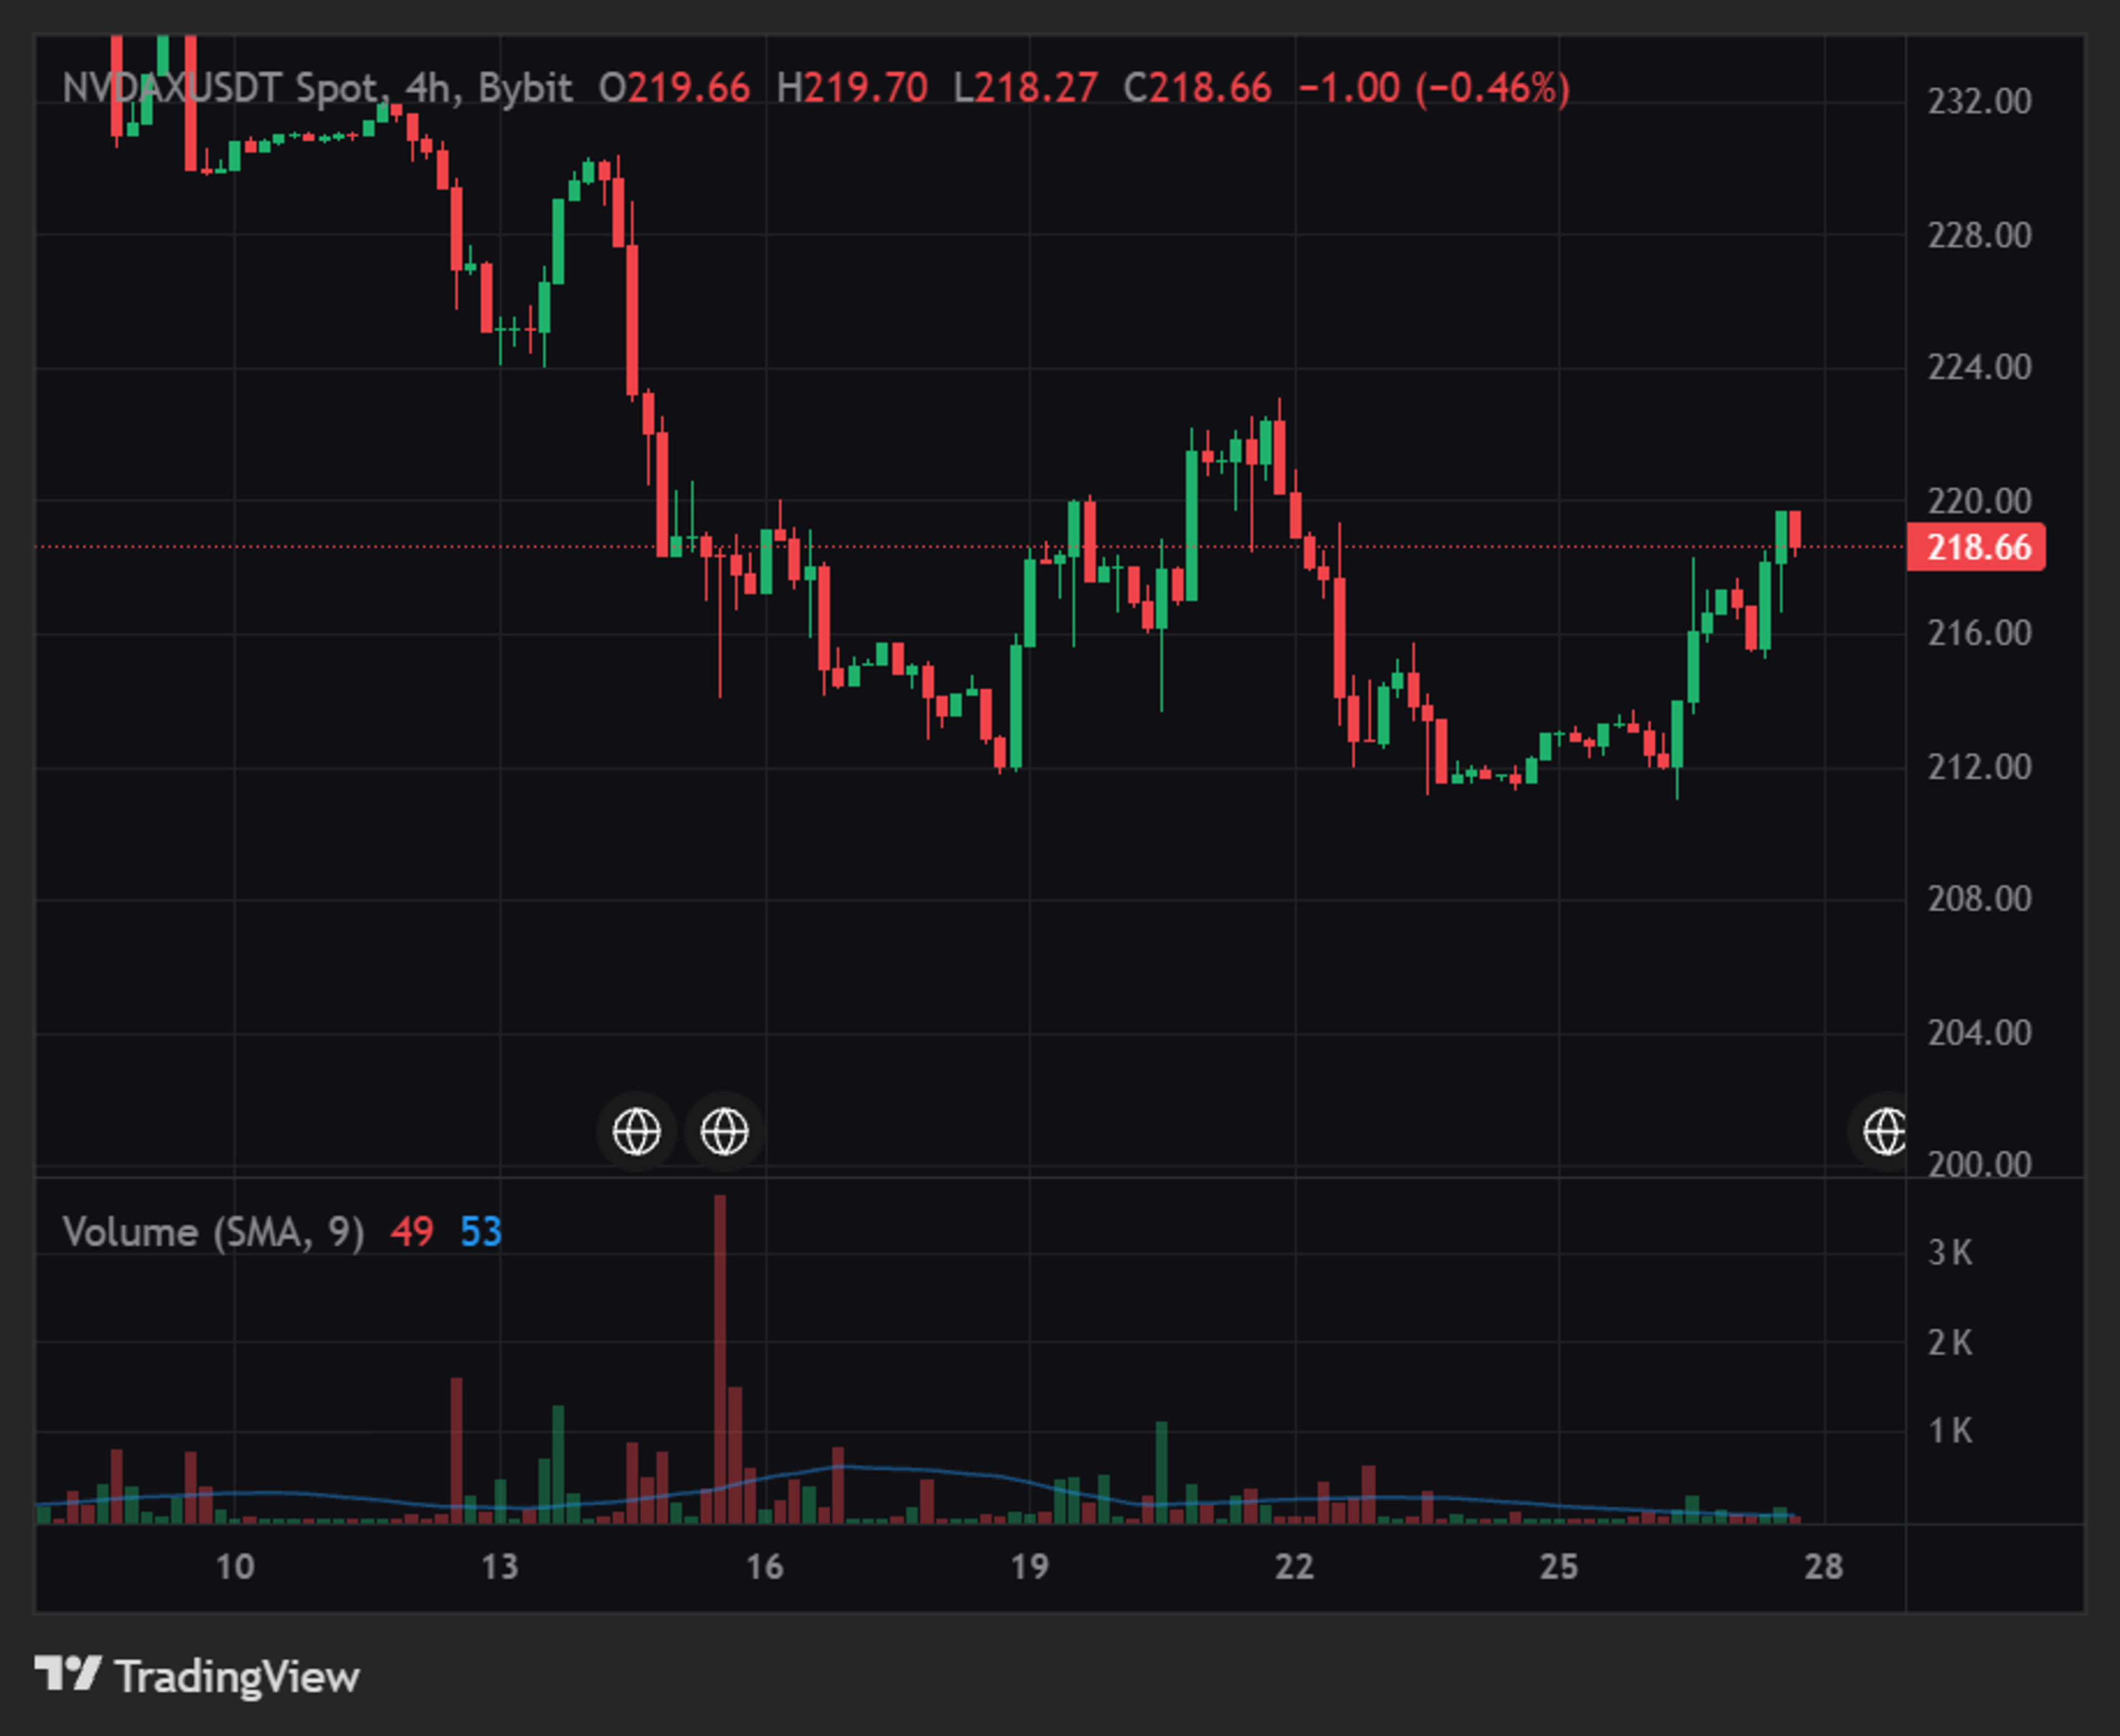
NVDAX/USDT AT A CRITICAL TURNING POINT! While traders watch the AI and semiconductor sectors, tokenized Nvidia exposure remains closely tied to movements in the traditional stock market. NVDAX/USDT could present opportunities when price confirms its next direction, but the key is identifying whether buyers can sustain momentum or sellers regain control. THE BULLISH NEWS Nvidia remains a major player in AI computing, data centers, and advanced semiconductor technology. Continued demand for AI infrastructure is an important long-term factor for Nvidia's business, although company growth does not guarantee short-term gains for NVDAX. Traders should watch Nvidia's share-price movements, earnings outlook, and broader technology-sector sentiment for potential direction. KEY LEVELS TO WATCH Above $217.60: a confirmed breakout could open the way toward $220–$225. Between $211 and $217.60: price may consolidate while buyers and sellers compete for control. Below $211: selling pressure could bring $208 and $205 into focus. NVDAX recently traded around $216.27, with a reported 24-hour range of $211.23–$217.60. The token remains below its October all-time high near $242.89, making the $220 area an important recovery checkpoint. These levels are technical reference points, not guaranteed targets. Trading strategy Long setup: Consider an entry only after a confirmed breakout above $217.60 and a successful retest. Potential targets: $220, followed by $225. Invalidation: A failed breakout followed by a move below $215 would weaken the immediate bullish setup. Set the actual stop-loss according to your entry price and risk limit. Short setup: A confirmed breakdown below $211 could create downside opportunities toward $208 and $205. Wait for confirmation rather than entering on a single bearish candle. Risk warning: NVDAX is a tokenized stock asset linked to Nvidia shares, not a conventional cryptocurrency. Its price can be affected by equity-market hours, liquidity, trading spreads, issuer-related risks, and differences between trading platforms. Always check the terms of the specific token before trading. Nvidia's AI demand, semiconductor industry developments, earnings expectations, US interest rates, and broader technology-sector sentiment could influence the next major move. Don't chase the breakout. Wait for confirmation, manage your risk, and protect your capital instead of trading on hype. Can NVDAX break above $217.60 and move toward $225, or will sellers push it back below $211? #ByXIMPACT #WSOT2026 #AnthropicS1Filing #IMPACTbyTrade #MyByXTake $NVDAXUSDT

TSLAX/USDT AT A CRITICAL TURNING POINT! While traders watch the technology sector, Tesla's tokenized stock is showing signs of a potential recovery. TSLAX/USDT has moved back toward the $393 area after recent volatility, with buyers now looking to extend the rebound. The key question is whether this momentum can hold or sellers will step in again. THE BULLISH OUTLOOK TSLAX provides tokenized exposure to Tesla's stock price, connecting traditional equity market movements with blockchain-based trading. Recent price action shows a rebound from the $350 area toward $393, suggesting buyers have returned after the previous decline. However, sustained upside will depend on Tesla's stock performance, market sentiment, and continued buying pressure. KEY LEVELS TO WATCH Above $396: potential continuation toward $400–$410. Between $385 and $396: possible consolidation before the next directional move. Below $385: sellers could push the price toward $375 and $370. A break below $370 would weaken the recovery structure and bring the $360 area into focus. Recent historical data shows TSLAX closing near $393 on October 26, following a strong recovery from the previous session. These levels are technical reference points, not guaranteed price targets. Trading strategy Long setup: Consider an entry only after a confirmed breakout above $396 and a successful retest of that level. Potential targets: $400, followed by $405–$410. Invalidation: A failed breakout followed by a move below $390 would weaken the immediate bullish setup. Set your stop-loss according to your entry and risk tolerance. Short setup: A confirmed breakdown below $385 could open the way toward $375 and $370. Wait for a clear rejection or breakdown confirmation rather than entering during random price fluctuations. Risk warning: TSLAX is a tokenized stock asset, not a conventional cryptocurrency. Its price can be affected by Tesla shares, broader equity market conditions, trading liquidity, and differences between trading venues. Tokenized assets may also carry additional issuer, redemption, and market-access risks. Tesla's financial performance, electric vehicle demand, technology developments, interest rates, and overall investor sentiment could determine the next major move. Don't chase the rebound. Wait for confirmation, manage your position size, and protect your capital before looking for the next opportunity. Can TSLAX break above $396 and continue toward $410, or will sellers push it back below $385? #ByXIMPACT #IMPACTbyTrade $TSLAXUSDT


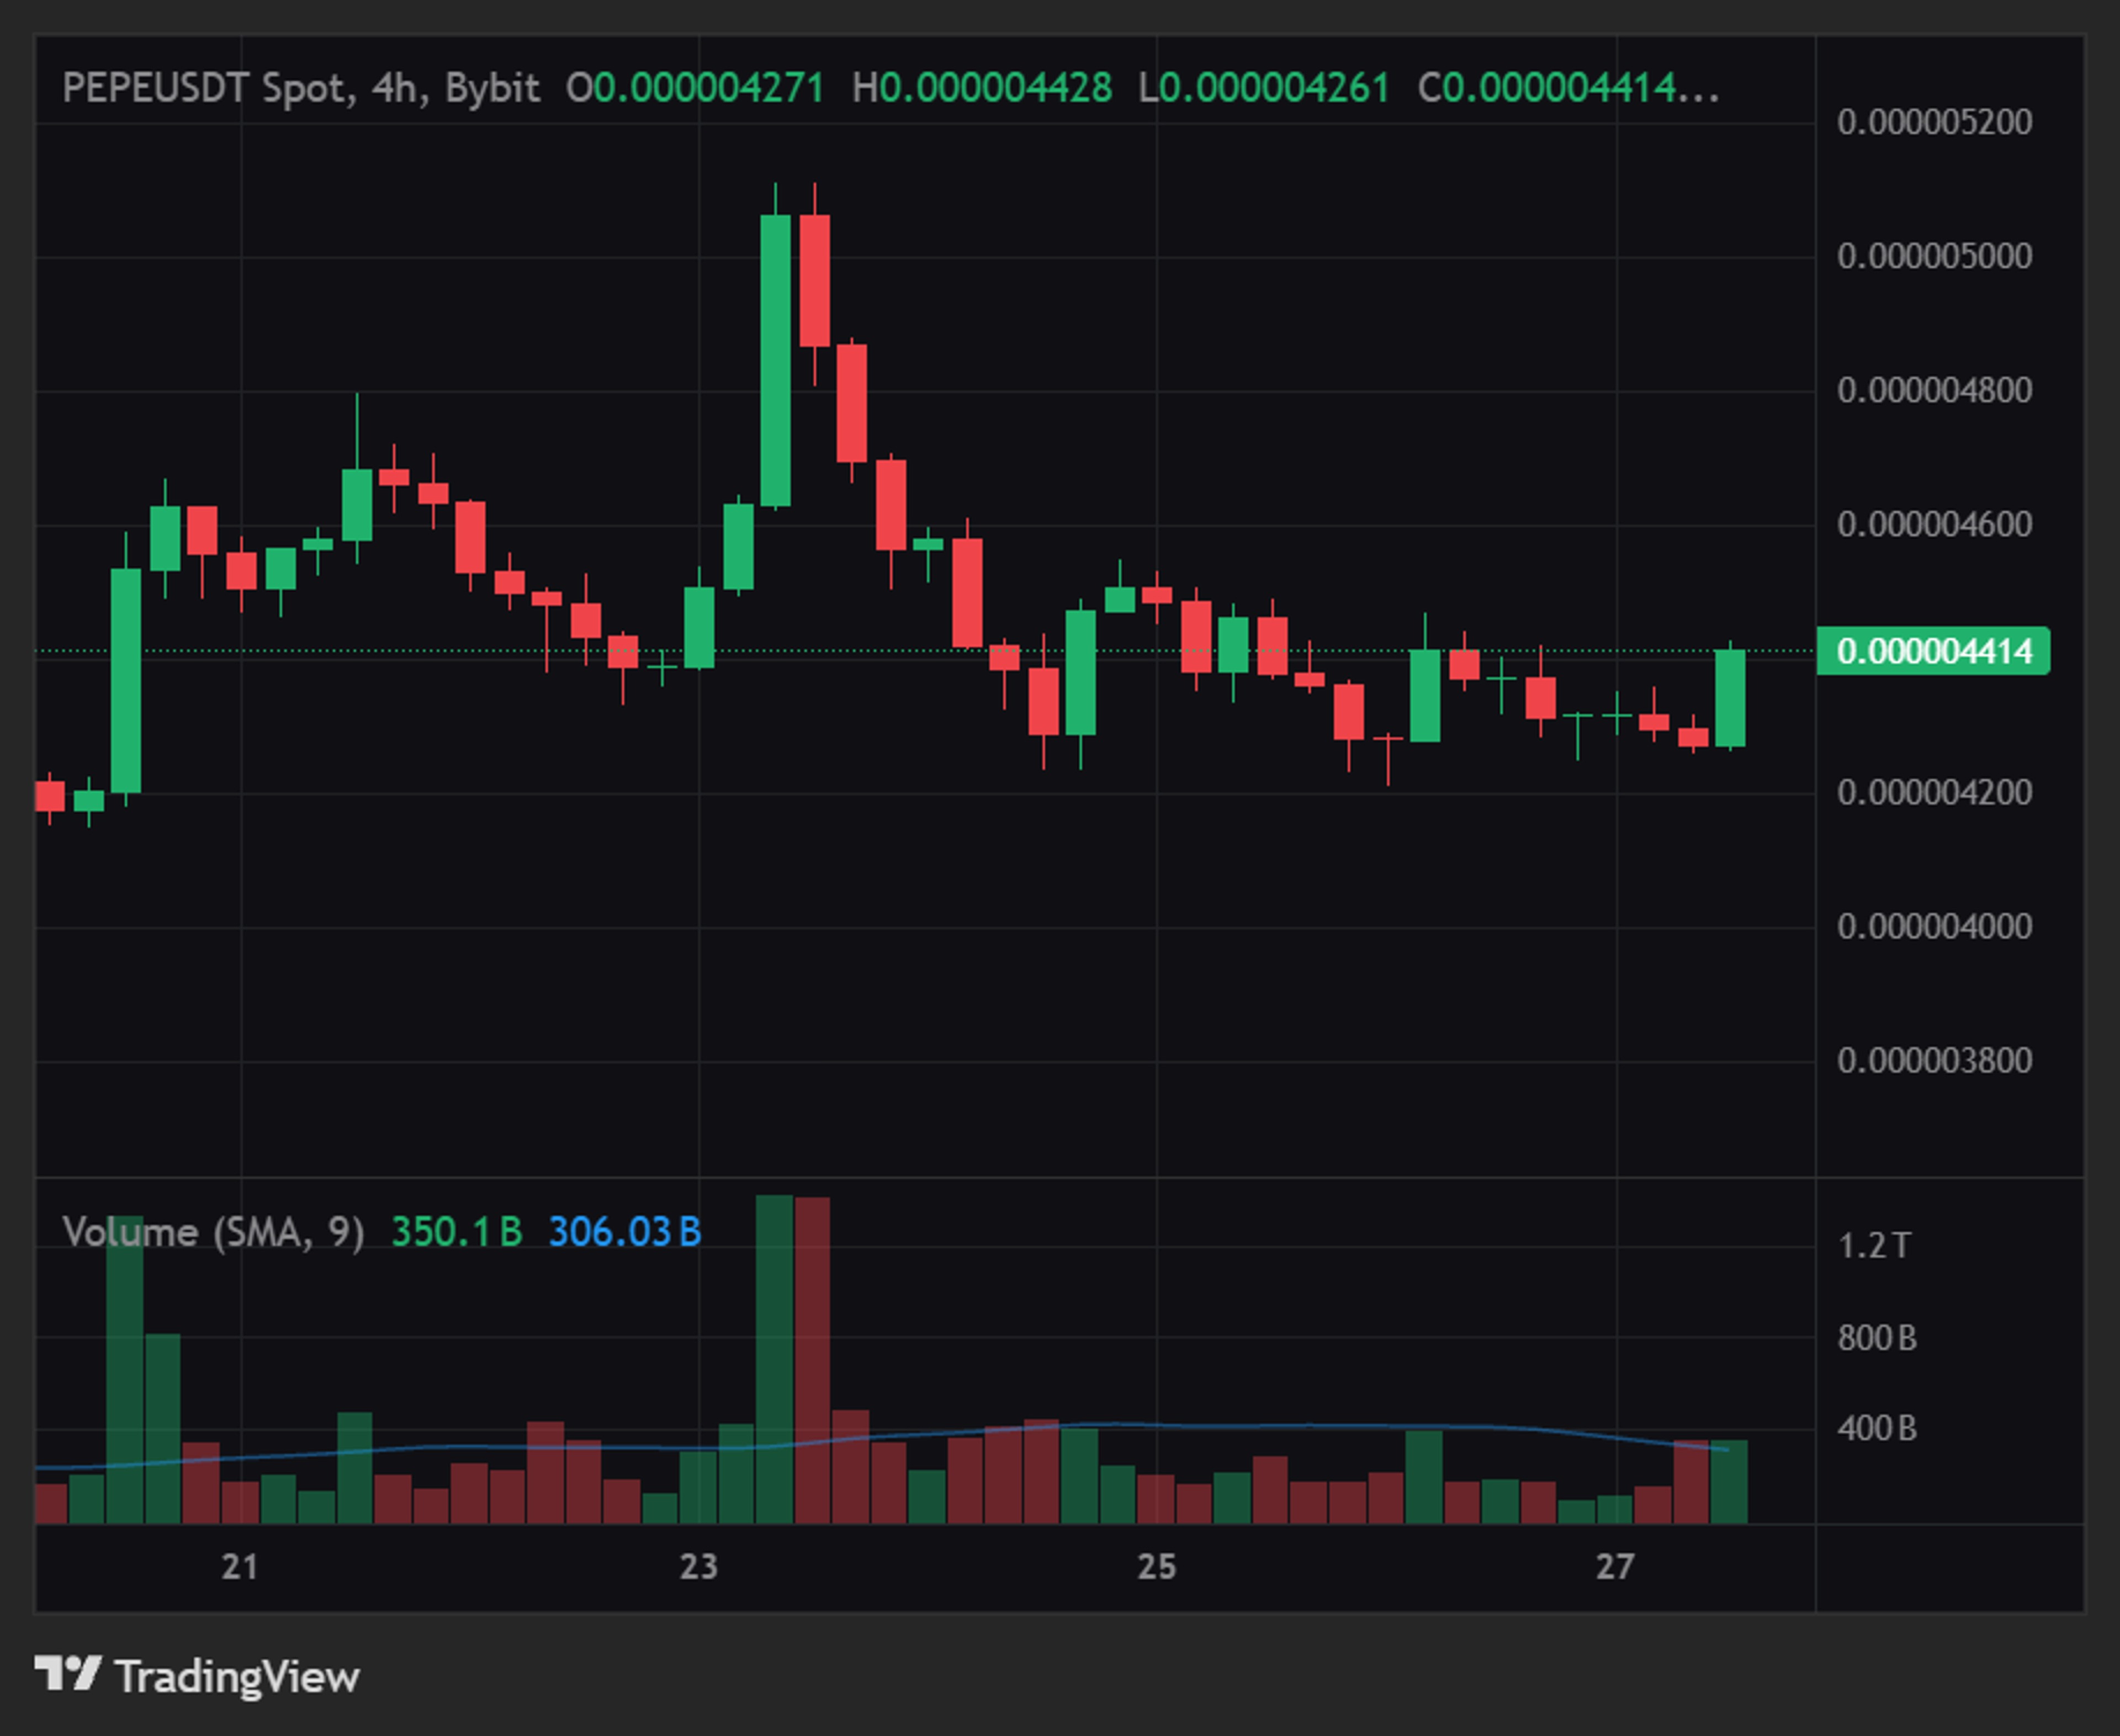
BYX RISK MANAGEMENT — PEPE/USDT Exchange: Bybit Timeframe: 1D (Daily) Current price: $0.00000431 24-hour change: -2.71% 🔍 1. Technical Analysis From the latest available market data: MA7: Not verified MA14: Not verified MA28: Not verified Resistance 1: $0.00000441 Resistance 2: $0.00000456–$0.00000472 Support 1: $0.00000421 Support 2: $0.00000409 Major support: Around $0.00000394 Trend: Bullish on the daily timeframe, with short-term uncertainty 📊 PEPE is trading near $0.00000431 after a recent pullback. The daily trend remains positive, but the market is showing mixed signals across shorter timeframes. Resistance around $0.00000441 is the first important level to watch. A confirmed breakout could attract additional buyers, while rejection may push the price toward $0.00000421 or lower. The key question is whether buyers can defend the current support zone and regain short-term momentum. 🎯 2. Trade Setups 🔴 Scenario A: SHORT Consider only if the price rebounds and gets rejected near resistance. | Parameter | Price | |---|---| | Potential entry | $0.00000441–$0.00000456 | | Stop-loss | $0.00000468 | | Take-profit 1 | $0.00000421 | | Take-profit 2 | $0.00000409 | | Take-profit 3 | $0.00000394 | Wait for bearish confirmation before entering. A rejection followed by a lower high would strengthen the short setup. 🟢 Scenario B: LONG Consider only if the price breaks resistance and holds above it. | Parameter | Price | |---|---| | Confirmation zone | Above $0.00000441 | | Stronger confirmation | Above $0.00000456 | | Take-profit 1 | $0.00000472 | | Take-profit 2 | $0.00000511 | | Take-profit 3 | $0.00000536 | | Stop-loss | Below the confirmed breakout retest low | Wait for a confirmed breakout and successful retest before entering. A brief move above resistance without follow-through could become a false breakout. 🛡️ 3. Risk Management Follow these rules: 1. Risk only 1% of your trading capital on a single trade. 2. Always use a stop-loss and calculate your position size before entering. 3. Avoid high leverage, especially when trading volatile meme coins like PEPE. 4. Aim for a risk-to-reward ratio of at least 1:2. 5. If the price remains between $0.00000421 and $0.00000441 without confirmation, consider waiting. 📌 BYX Final Verdict Current bias: Cautiously bullish on the daily timeframe. ⚠️ My recommendation: WAIT for confirmation. PEPE's daily trend remains positive, but immediate resistance could limit further upside. A clean breakout above $0.00000441 would improve the bullish setup, while a breakdown below $0.00000421 could expose lower support levels. This analysis uses the latest available market data, not a live trading chart. The MA7, MA14, and MA28 values have not been independently verified. These are conditional scenarios, not guaranteed trading signals. #ByXIMPACT $PEPEUSDT
BTC is hovering around $79,800 after slipping below $80,000, but the real question is whether buyers can reclaim resistance or if another wave of selling will push price toward lower support. Bitcoin is trading near $79,800, with recent price action showing difficulty maintaining levels above $80,000. The market remains under pressure after failing to sustain its latest recovery. The $80,000-$80,800 area is the first major recovery zone, while $79,300-$79,400 is an important nearby support area. A clean break in either direction could determine the next short-term move. The technical picture remains mixed. Bitcoin is trading below several short-term trend indicators, suggesting sellers still have some control over the immediate structure. Momentum readings are also relatively weak, although the broader trend has not completely broken down. A recovery above $80,800 would improve the short-term outlook, while a sustained move below $79,300 could expose deeper support near $78,000 and potentially $75,500. Derivatives positioning adds another layer of risk. Positive funding and renewed leveraged positioning suggest that traders are still looking for a bounce. However, when bullish positions build while price struggles to recover resistance, the market can become vulnerable to long liquidations. A recovery supported by genuine spot demand would be more convincing than a move driven mainly by leverage. **Key figures** $79,800 - Current price area $80,000-$80,800 - First recovery zone $79,300-$79,400 - Immediate support $82,000-$83,400 - Higher resistance zone $78,000 - Next major downside level $75,500 - Deeper support if selling accelerates Bullish confirmation: Reclaim $80,800 and hold above it with stronger buying activity. That would open the way toward $82,000-$83,400. Bearish confirmation: Lose $79,300 and fail to recover it. That would increase the risk of a move toward $78,000, with $75,500 becoming relevant if selling pressure intensifies. Bitcoin is approaching a decision point where support must hold and buyers need to prove they can absorb selling pressure. The decisive signal is whether BTC can reclaim resistance with sustained demand or whether leveraged positioning and continued selling push the market into another leg lower. #ByXIMPACT $BTCUSDT