Crypto Rule
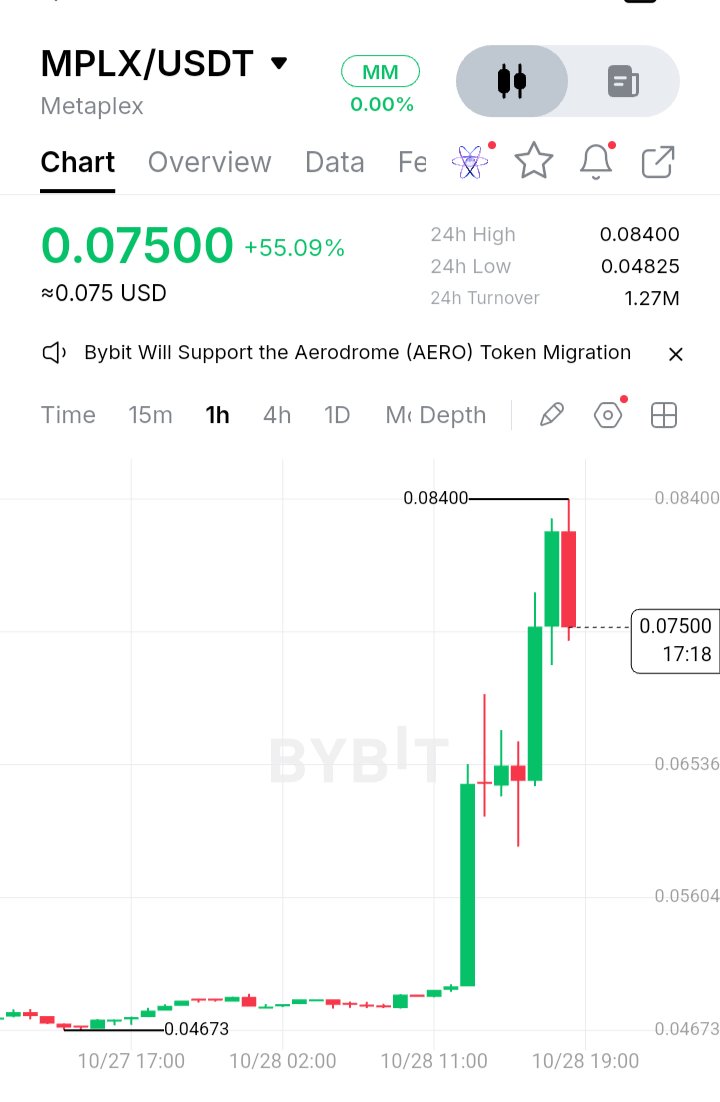
$MPLXUSDT EXPLOSIVE 55% RALLY! CAN BULLS BREAK HIGHER? MPLX (Metaplex) is showing powerful bullish momentum, trading near $0.07500, up 55.09%. The 1H chart shows a sharp breakout from the $0.047 area toward $0.08400, followed by profit-taking. Bulls have made an impressive move, but the latest rejection signals that volatility could remain elevated. The next move depends on whether buyers can defend the breakout zone. 📊 VIP Trading Levels - Support: $0.07000–$0.06536 - Major Support: $0.05604 - Resistance: $0.08000–$0.08400 - Next Bullish Targets: $0.09000, then $0.09500 - Bearish Risk: Losing $0.06536 could expose $0.05604. 🎯 Trading Outlook: A confirmed breakout above $0.08400 could open the door to further upside. If support fails, a deeper correction is possible. Avoid chasing the pump; wait for confirmation and manage risk carefully. #WSOT2026 #SKHynixEarningsBeat #AnthropicS1Filing #IMPACTbyTrade #MyByXTake
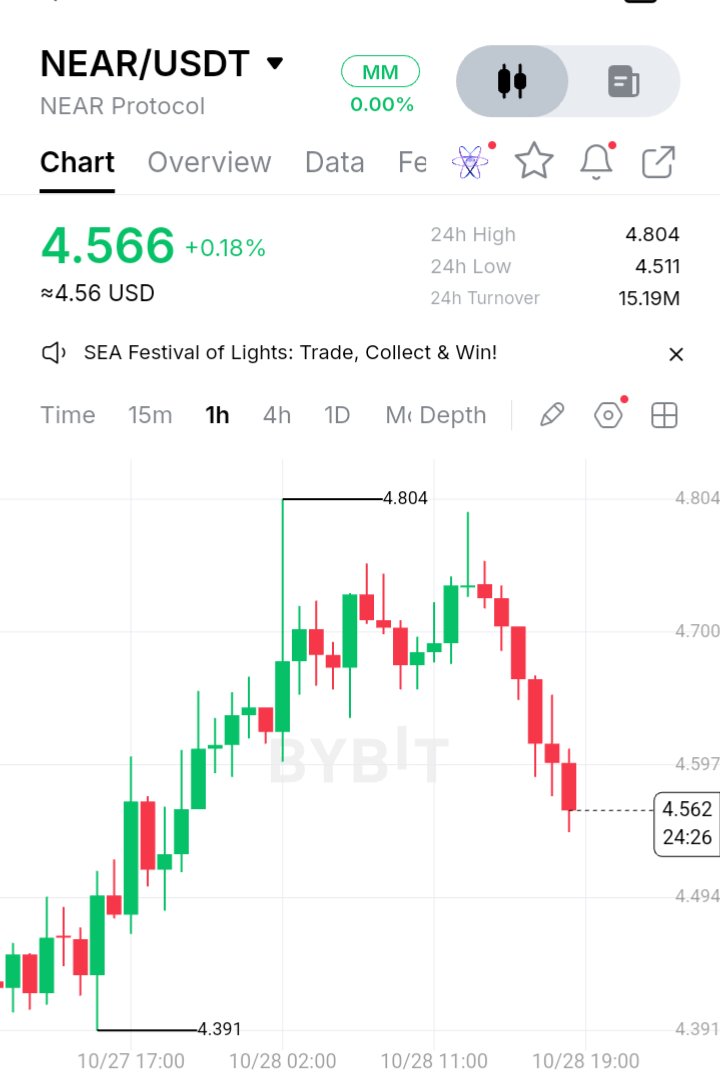
$NEARUSDT BEARS STRIKE BACK! WILL BUYERS DEFEND SUPPORT? NEAR Protocol is trading around $4.566 as selling pressure intensifies on the 1H chart. After rallying from $4.391 to a high of $4.804, the price faced rejection and has now pulled back sharply. Bears are gaining short-term momentum, making the current support zone crucial for the next move. 📊 VIP Trading Levels - Support: $4.511–$4.494 - Major Support: $4.391 - Resistance: $4.597–$4.650 - Major Resistance: $4.700–$4.804 - Next Bullish Targets: $4.700, then $4.804 - Bearish Target: A confirmed breakdown below $4.494 could expose $4.391. 🎯 Trading Outlook: A strong bounce above $4.597 may signal recovery. However, losing support could extend the correction. Wait for candle confirmation and manage risk carefully. #WSOT2026 #SKHynixEarningsBeat #AnthropicS1Filing #IMPACTbyTrade #MyByXTake
🇺🇸 BREAKING: US TREASURY MOVES FORWARD WITH CRYPTO REGULATION —WITH OR WITHOUT CONGRESS $BTCUSDT U.S. Treasury Secretary Scott Bessent says the government will push forward on crypto regulation even without new legislation from Congress. Speaking at Ripple’s Swell conference on October 27, Bessent indicated that the Treasury would bring the SEC and CFTC together to address regulatory gaps and establish clearer rules for the digital asset industry. The move follows the Senate’s failure to advance the CLARITY Act in September. 📌 Why This Matters: 🔹 Greater regulatory clarity for crypto businesses. 🔹 Better coordination between the SEC and CFTC. 🔹 Potentially improved confidence among institutional investors. 🔹 Continued efforts to address banking access for crypto companies. ⚠️ The Catch: Agency-led rules may be easier for future administrations to reverse than legislation passed by Congress. The Big Picture: Washington is signaling that crypto regulation will continue, even as lawmakers remain divided. The key question is whether these efforts can deliver lasting legal certainty for the market. #WSOT2026 #AnthropicS1Filing #IMPACTbyTrade #MyByXTake #MidtermsMarketWatch


$FUSDT FUSDT is trading around 0.003012 on the 1H chart after a strong recovery from the 0.002913 low. Buyers pushed the price toward 0.003064, but resistance triggered a pullback. The next move will depend on whether buyers can defend nearby support and regain momentum. 📊 Key Technical Levels - Support: 0.003000–0.002988 - Resistance: 0.003026–0.003064 - Next Bullish Target: 0.003080, followed by 0.003100 - Downside Risk: A breakdown below 0.002988 could expose 0.002950. Trading Outlook: A confirmed breakout above 0.003064 could attract fresh buying pressure. However, losing support may extend the correction. Watch for candle confirmation before entering. Stay disciplined, manage risk, and let price action lead the trade. $FUSDT #WSOT2026 #AnthropicS1Filing #IMPACTbyTrade #MyByXTake #MidtermsMarketWatch

$MNTUSDT VIP MARKET SIGNAL | MNT/USDT MNT is facing strong selling pressure after rejecting the $0.53970 high! Price is now trading near $0.52240, showing a short-term bearish pullback after a sharp bullish rally. Traders should watch the key support zone closely for the next move. Current Price: $0.52240 Support 1: $0.52000 Support 2: $0.51250 Resistance 1: $0.53130 Resistance 2: $0.53970 Bearish Scenario: A breakdown below $0.52000 could open the way toward $0.51250. Bullish Scenario: Reclaiming $0.53130 with strong buying volume could push MNT toward $0.53970. #WSOT2026 #AnthropicS1Filing #IMPACTbyTrade #MyByXTake #MidtermsMarketWatch

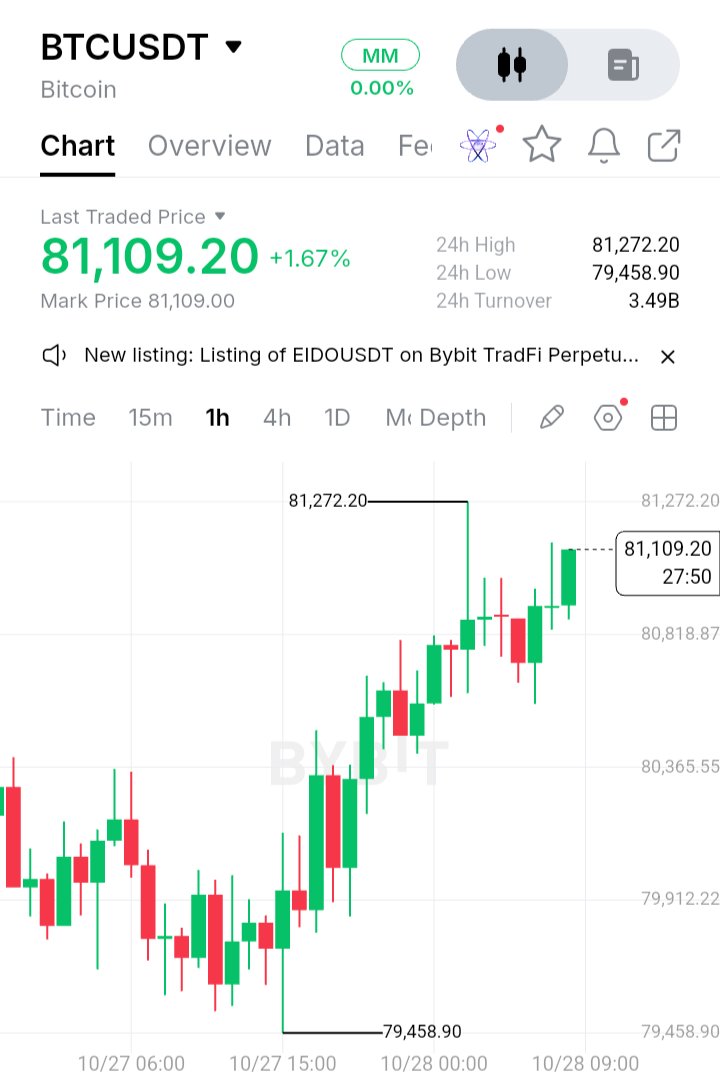
$BTCUSDT — VIP Market Signal Update Bitcoin is trading at $81,109.20, up 1.67% on the displayed 24-hour data. The 1-hour chart shows a strong recovery from $79,458.90, with buyers pushing price toward the recent high of $81,272.20. Support Levels: $80,818.87, followed by $80,365.55. Major visible support is near $79,458.90. Resistance: $81,272.20 is the immediate breakout level. Bullish Entry Condition: Wait for a 1-hour candle to close above $81,272.20. A successful retest would strengthen the breakout setup. Next Target: Further upside may follow a confirmed breakout, but the next target cannot be reliably determined from this screenshot alone. Risk: Rejection at resistance could trigger a pullback. Watch price confirmation before acting. #WSOT2026 #AnthropicS1Filing #MyByXTake #Bybit8thAnniversary #ByXIMPACT
$SOLUSDT VIP SIGNAL UPDATE Current Price: $101.85 Market Bias: Bullish, but breakout confirmation is still required. Entry Conditions: 1. Breakout Entry: Watch for a 1-hour candle to close clearly above $102.04. A successful retest of this level as support would provide stronger confirmation of bullish continuation. 2. Pullback Entry: Monitor the $101.32–$100.60 support zone. Look for a bullish reversal signal before considering an entry; support is not guaranteed to hold. Resistance: $102.04 Support: $101.32, $100.60 Invalidation: A sustained move below $100.60 would weaken the short-term bullish setup. The chart alone does not establish a reliable stop-loss level. Risk Management: Avoid entering solely because price is rising. Wait for candle confirmation and assess the risk-to-reward ratio before acting. #WSOT2026 #AnthropicS1Filing #IMPACTbyTrade #MyByXTake #MidtermsMarketWatch

$PEPEUSDT Strong Bullish Momentum After a Sharp Breakout is trading at 0.000004882 USDT, up 13.56% on the displayed 24-hour market data. The 1-hour chart shows a strong bullish move, with price breaking above the previous consolidation zone and reaching a high of 0.000004999. Support Levels: The immediate area to watch is around 0.000004800, followed by the previous breakout zone near 0.000004624. The recent chart low at 0.000004249 marks a deeper support reference. Resistance Levels: The key resistance is 0.000004999. A sustained move above this high could indicate further upside potential, while rejection may lead to consolidation or a pullback. Market Structure: Buyers currently have the advantage, but the sharp rally increases the risk of short-term profit-taking. Next Areas to Watch: Watch the reaction near 0.000004999 and whether price can hold above 0.000004800. The displayed 24-hour turnover is 10.29M, although its unit is not specified. Risk Note: A loss of the breakout area could weaken the bullish structure. Confirmation from subsequent candles is important before drawing conclusions about the next move #WSOT2026 . #AnthropicS1Filing #IMPACTbyTrade #MidtermsMarketWatch #MyByXTake

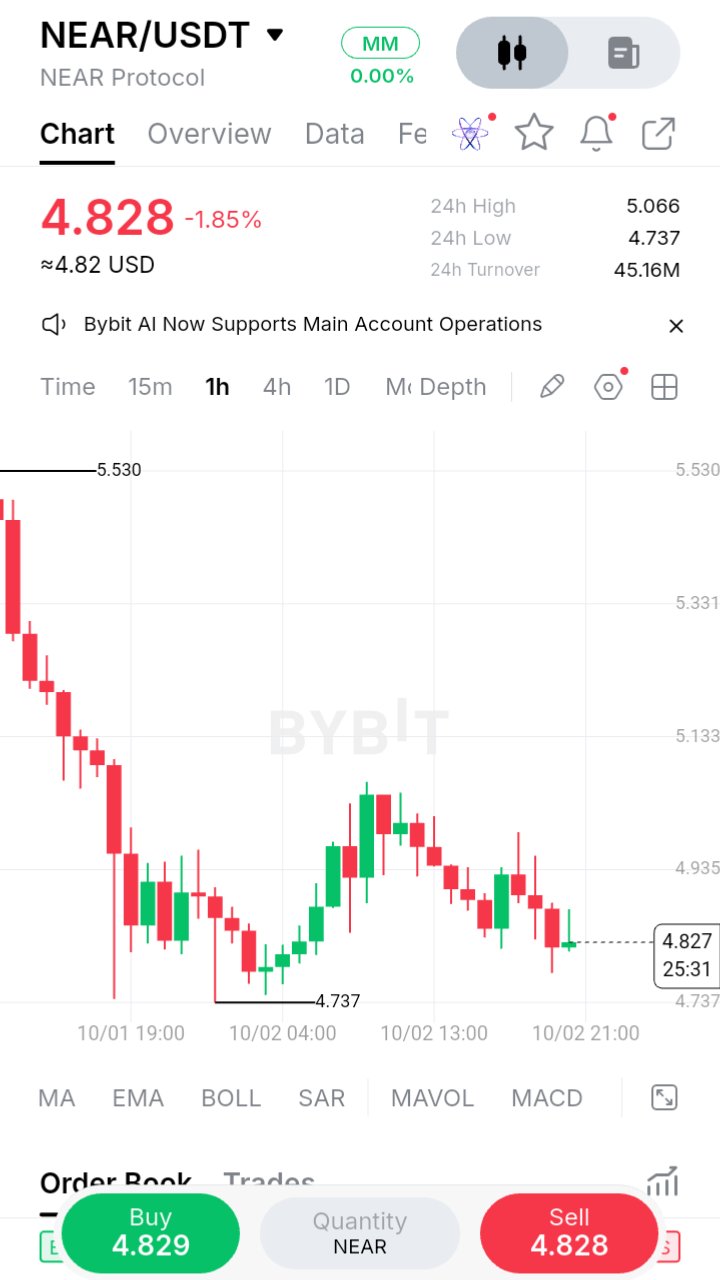
$NEARUSDT $NEAR — 1H Market Structure Update $NEAR is trading around $4.828, down 1.85%, with a reported 24h range of $4.737–$5.066 and 24h turnover of $45.16M. Market Structure On the 1H chart, $NEAR has moved lower from the $5.53 area, found a visible low at $4.737, and then attempted a rebound. The latest candles show the rebound losing momentum, with price returning toward $4.83. Key Levels Support: $4.737 Resistance: $4.935, followed by the 24h high near $5.066 A sustained move above $4.935 would put the $5.066 area back into focus. A break below $4.737 would weaken the current structure further. Risk: The chart alone does not confirm future direction; volume, open interest, and broader market conditions could change the setup. $NEAR #ISMManufacturingPMI #USNonfarmPayrolls #ByXIMPACT #MetaMaskSecurityIncidentTriggersValidatorExits #BybitAIBestReplies

Latest Crypto Market Topic — October 2, 2026
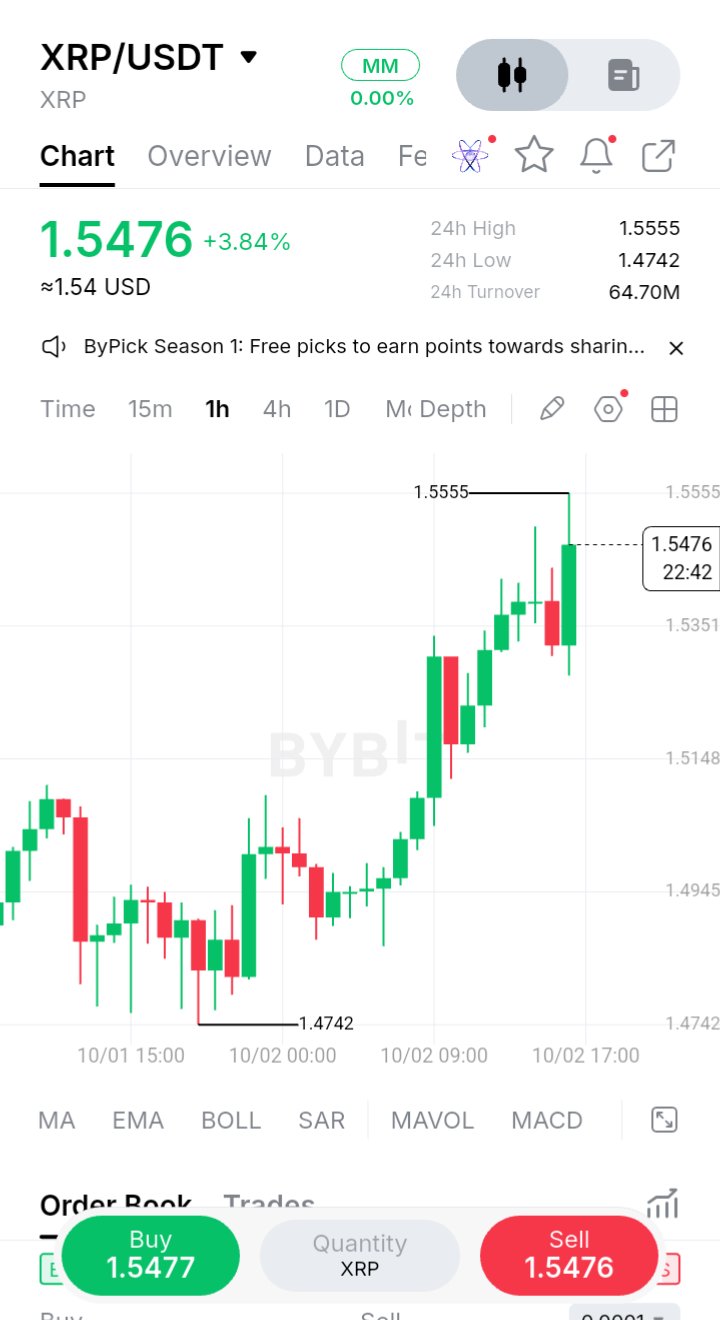
$XRPUSDC Bitcoin Reclaims $86K as Crypto Market Turns Risk-On Bitcoin has pushed back above $86,000, while Ethereum, XRP and other major cryptocurrencies are also moving higher. The broader market recovery comes as traders assess changing U.S. interest-rate expectations and await the latest U.S. jobs data. One notable development is Bitcoin dominance approaching 60%, suggesting Bitcoin is currently leading the broader crypto recovery. At the same time, rising open interest and funding rates show increased derivatives activity, while recent liquidations highlight the risk of sharp volatility. For XRP, the chart you shared shows price around $1.5476, up about 3.84%, with the visible 24-hour range at $1.4742–$1.5555. The immediate area to watch is the $1.55–$1.56 resistance zone; support is around $1.47–$1.48. Current price action is therefore testing the upper end of its recent range. Key market theme: BTC strength + macro data + elevated derivatives positioning = potentially higher volatility across crypto today. #ISMManufacturingPMI #USNonfarmPayrolls #ByXIMPACT #MetaMaskSecurityIncidentTriggersValidatorExits #BybitAIBestReplies

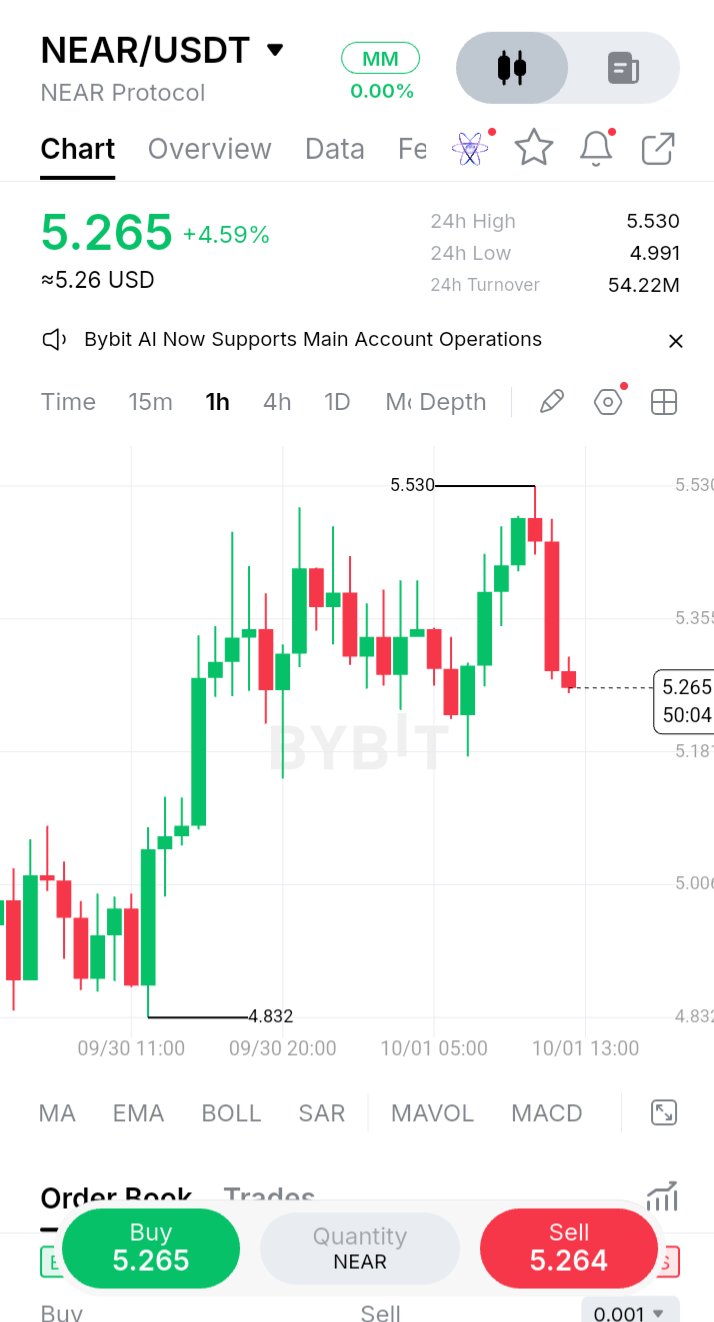
$NEARUSDT is trading around 5.265 USDT, showing a +4.59% move on the screen. On the 1-hour chart, price recently pushed toward the 5.530 area before pulling back sharply toward the current level. Key Levels Support: 5.181, then 5.006 Major lower support: 4.832 Resistance: 5.355 Major resistance: 5.530 The recent rejection from 5.530 is the main short-term technical development. Price is now testing the area around 5.26, so the reaction near 5.181–5.265 is important for the next visible move. The screenshot shows 24h high at 5.530, 24h low at 4.991, and 24h turnover of 54.22M. No liquidation or open-interest data is provided. A sustained move above 5.530 would put that resistance level back into focus, while weakness below 5.181 could bring 5.006 into attention. The chart alone cannot confirm the next direction, so volatility and broader market conditions remain important. #ByXIMPACT #BybitAIBestReplies #PCEPriceIndex #PolyMarketPreIPO #ByPickMakeYourPickCount

$SOLUSDT #ByXIMPACT is trading around $118.17, down 0.61% on the displayed data. On the 1-hour chart, price rejected from the $122.83 session high and moved lower toward the $117.04 low before showing a small rebound. Support Levels: The primary visible support is $117.04, the displayed 24-hour low. A break below this level would put the current range under further pressure. Resistance Levels: Near-term resistance appears around $118.48, followed by the $119.93 chart level. The major visible resistance is $122.83. Market Structure: The chart shows a pullback after the move to $122.83, with price currently stabilizing near $118.17. The short-term structure remains sensitive to whether $117.04 holds. Volume/Data: The screenshot shows 24h turnover of $92.20M. No liquidation or open-interest data is provided. Risk: A move below $117.04 would weaken the current structure, while recovery toward $119.93–$122.83 would bring the upper range back into focus. #PCEPriceIndex #BybitAIBestReplies #BybitOdds #TradFiOptions24/7


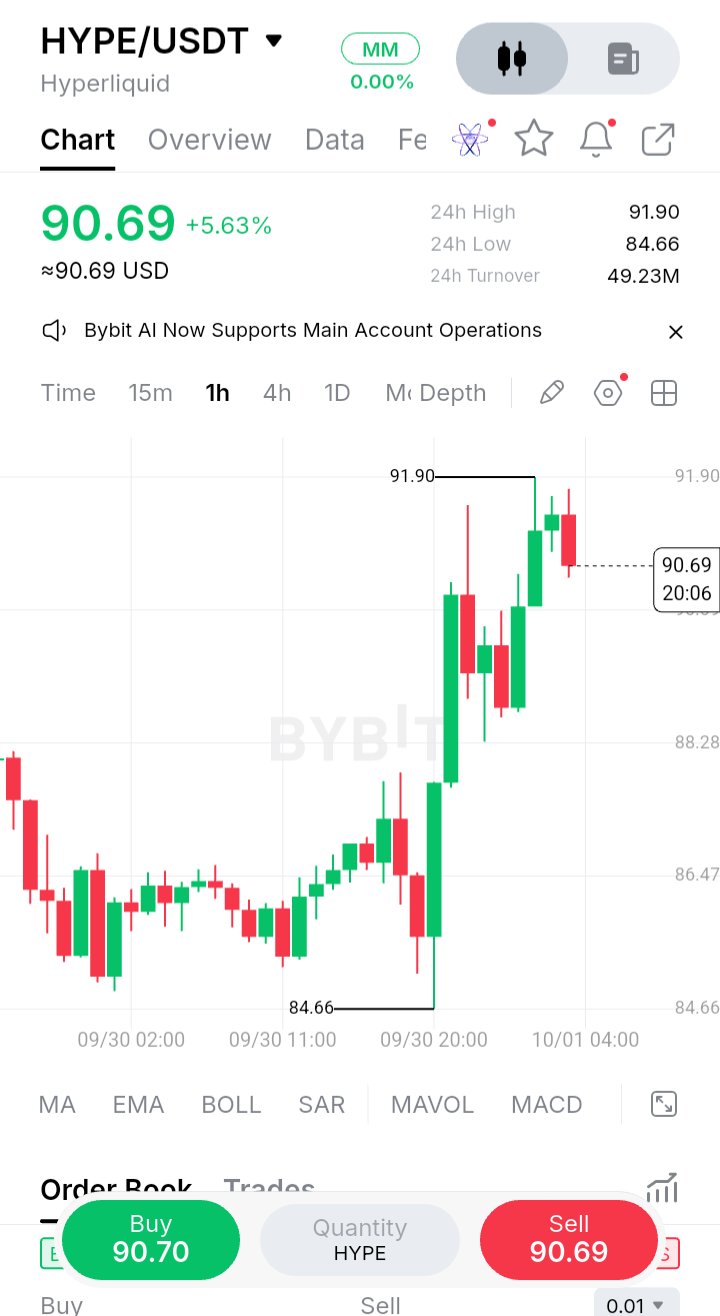
$HYPEUSDT $HYPE is trading around $90.69, showing a +5.63% move on the displayed data. The 1-hour chart shows a strong rebound from the session low of $84.66, followed by a sharp upward move toward the $91.90 24-hour high. Support Levels: The first area to watch is around $88.28. Below that, $86.47 is another visible chart level, while $84.66 marks the displayed session low. Resistance: The key immediate resistance is $91.90, which is also the displayed 24-hour high. A sustained move beyond this level would change the visible price structure, but the screenshot alone does not confirm a breakout. Market Structure: The short-term structure is currently upward after the strong recovery from $84.66. Price is now consolidating near the upper part of the displayed range. Volume/Data: The screenshot shows 24h turnover of $49.23M. No liquidation or open-interest data is provided. Risk: $91.90 remains an important overhead level, while a move back below $88.28 could indicate weakening of the recent upward momentum. #ByXIMPACT #BybitAIBestReplies #PCEPriceIndex #PolyMarketPreIPO #ByPickMakeYourPickCount

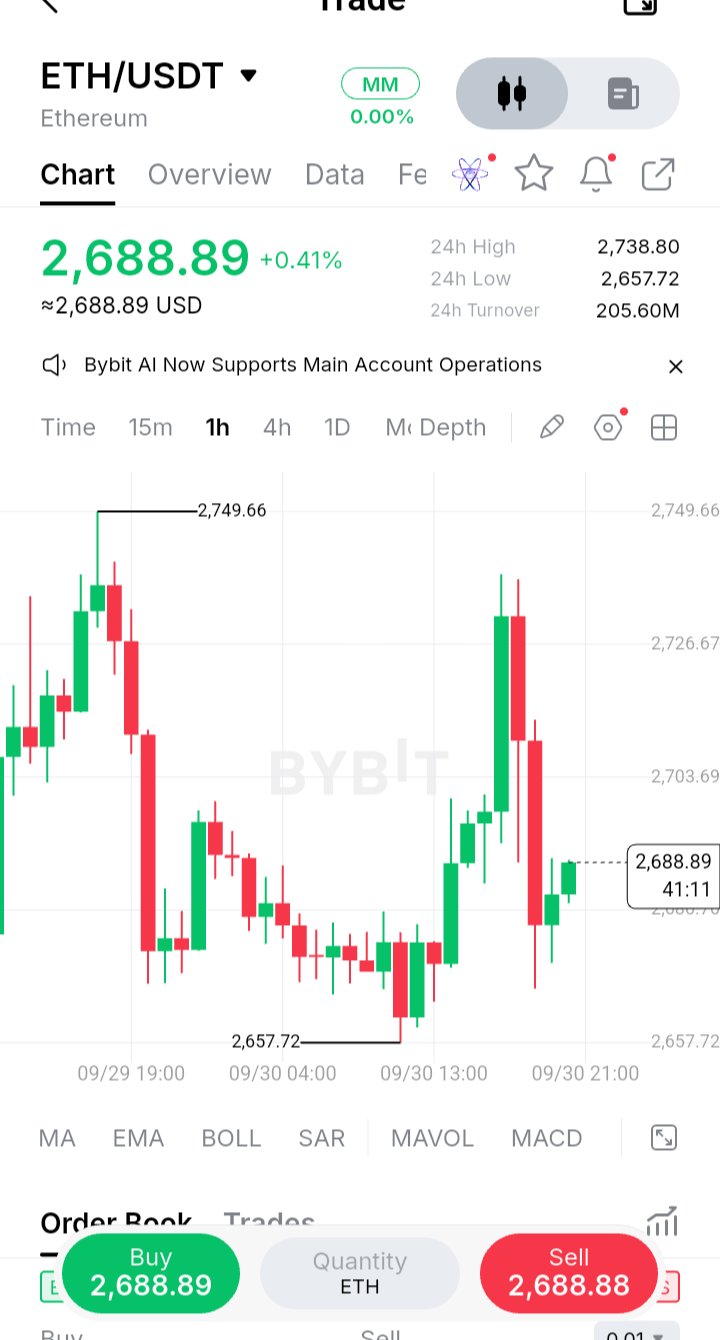
$ETH — 1H Market Structure Update
$ETHUSDT Current Price: $2,688.89 24H Change: +0.41% 24H High: $2,738.80 24H Low: $2,657.72 24H Turnover: $205.60M Market Structure $ETH is showing a rebound from the $2,657.72 intraday low. On the 1H chart, price moved sharply toward the $2,726–$2,738 area before facing selling pressure and retracing back toward $2,680–$2,690. Support Levels The clearest visible support is $2,657.72. The recent rebound area around $2,680 is also an important short-term zone to watch, although the chart does not explicitly label it as support. Resistance Levels The first area to watch is around $2,703–$2,727, followed by the $2,738.80 24H high. The chart also shows a higher marked level at $2,749.66. Key Areas Ahead Holding above the recent rebound zone could keep the short-term structure constructive, while a move back toward $2,657.72 would put the recent recovery under pressure. No liquidation or open-interest data is provided, so those factors cannot be assessed from this chart alone. #ByXIMPACT #BybitAIBestReplies #PCEPriceIndex #PolyMarketPreIPO #ByPickMakeYourPickCount

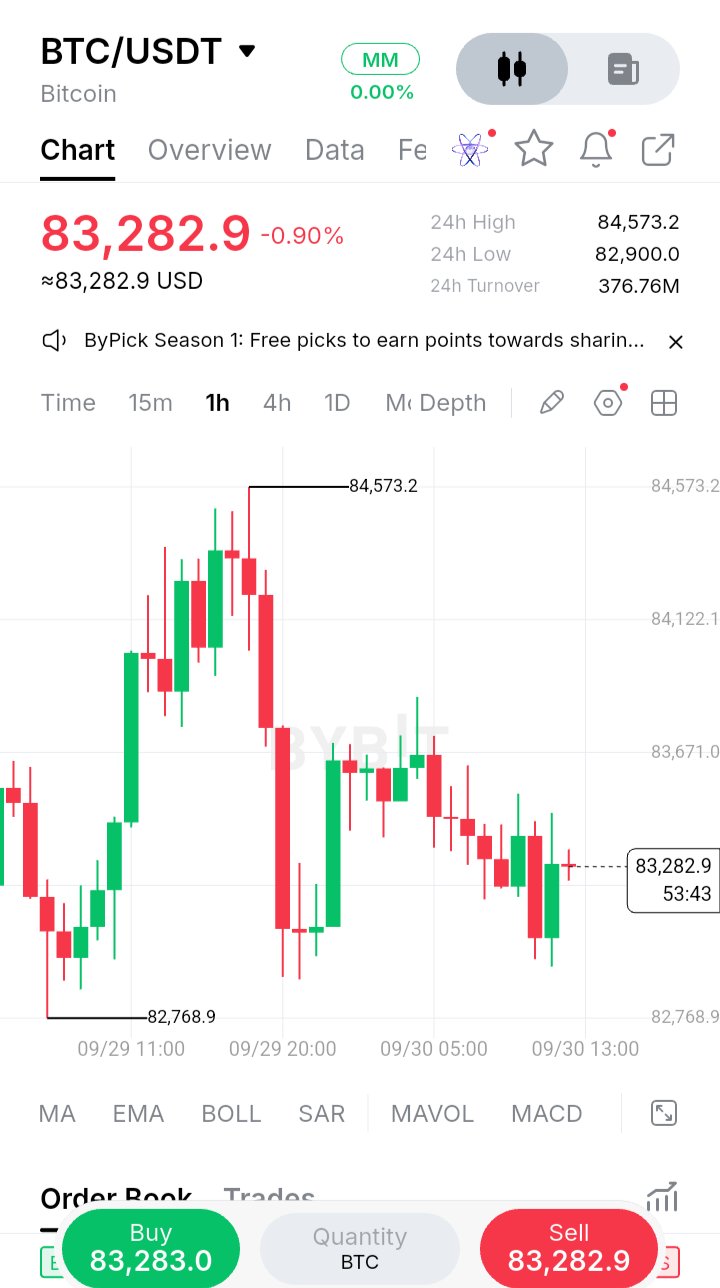
$BTC — 1H Market Structure Update
$BTCUSDT #ByXIMPACT Current Price: $83,282.9 24H Change: -0.90% 24H High: $84,573.2 24H Low: $82,900.0 24H Turnover: $376.76M Market Structure is trading below the recent $84,573.2 high after a visible rejection on the 1H chart. Price has since formed a short-term sequence of lower highs and is currently consolidating around $83.28K. Key Levels Support: $82,900–$82,769 Resistance: $83,671, then $84,122–$84,573 A sustained move above the $83,671 area would put the higher resistance zone back into focus. A break below the $82,769 chart low would indicate increasing downside pressure. Risk & What to Watch The chart shows no liquidation or open-interest data, so those factors cannot be assessed from the provided information. For now, the key focus is whether BTC holds the lower support area or reclaims the nearby resistance levels. These are levels to watch, not guaranteed outcomes. I can also create a simple image highlighting these $BTC support and resistance levels. #BybitAIBestReplies #PolyMarketPreIPO #ByPickMakeYourPickCount #BybitOdds

$BTCUSDT Top Crypto Loser of the Day Please send the coin/token name or screenshot/data showing today’s top loser. I’ll create a separate, factual market-research post covering: Current/provided price Daily decline and market movement Support & resistance levels only where supported by the data Key technical levels Next areas to watch Volume, liquidations or open interest if provided Current market structure/trend Relevant risks and uncertainty I’ll keep it clean, neutral, and under 300 words, with the ticker formatted like $BTC. I can also create a simple image explaining the market setup. #ByXIMPACT #BybitAIBestReplies #PolyMarketPreIPO #ByPickMakeYourPickCount #BybitOdds

$BTCUSDT Bitcoin is facing a critical moment as price trades around the $83K zone, with traders watching whether buyers can defend this area or whether macro pressure pushes the market lower. The recent move above $85K showed bullish strength, but rising oil prices and upcoming U.S. economic data are keeping volatility elevated. Meanwhile, reported strong spot Bitcoin ETF inflows highlight continued institutional interest. 📌 Key Levels to Watch: 🔹 Support: $83K 🔹 Major Support: $80K–$81K 🔹 Resistance: $85K 🔹 Breakout Zone: Above $85K A strong reclaim above $85K could bring renewed attention toward higher levels, while losing the $83K area could increase downside pressure. ⚠️ Risk: Macro data, interest-rate expectations, ETF flows, and market liquidity can quickly change the short-term setup. The battle between institutional demand and macro pressure is getting intense. Stay patient, watch the key levels, and manage risk carefully. #ByXIMPACT #BybitAIBestReplies #PolyMarketPreIPO #ByPickMakeYourPickCount #BybitOdds


$BTC WEEKLY STRUCTURE FLIPS BULLISH
$BTC is showing a major shift in its weekly market structure, with the latest breakout suggesting that bullish momentum may be returning earlier than expected. The key now is patience and smart accumulation rather than chasing every move. The current range can offer an opportunity to build exposure gradually, while keeping additional capital available in case $BTC revisits deeper support zones. 📌 Structure: Weekly bullish shift 🟢 Strategy: Gradual accumulation 🛡️ Risk: Keep capital for potential pullbacks 🎯 Focus: Watch how price holds above the breakout area If the market dips after the structure break, it could simply provide another opportunity to accumulate at better levels. Confirmation and risk management remain important because a breakout can still face a retest. Stay patient. Build gradually. Let the market confirm the trend. #CPI3.4 #FOMC #TradFiOptions24/7

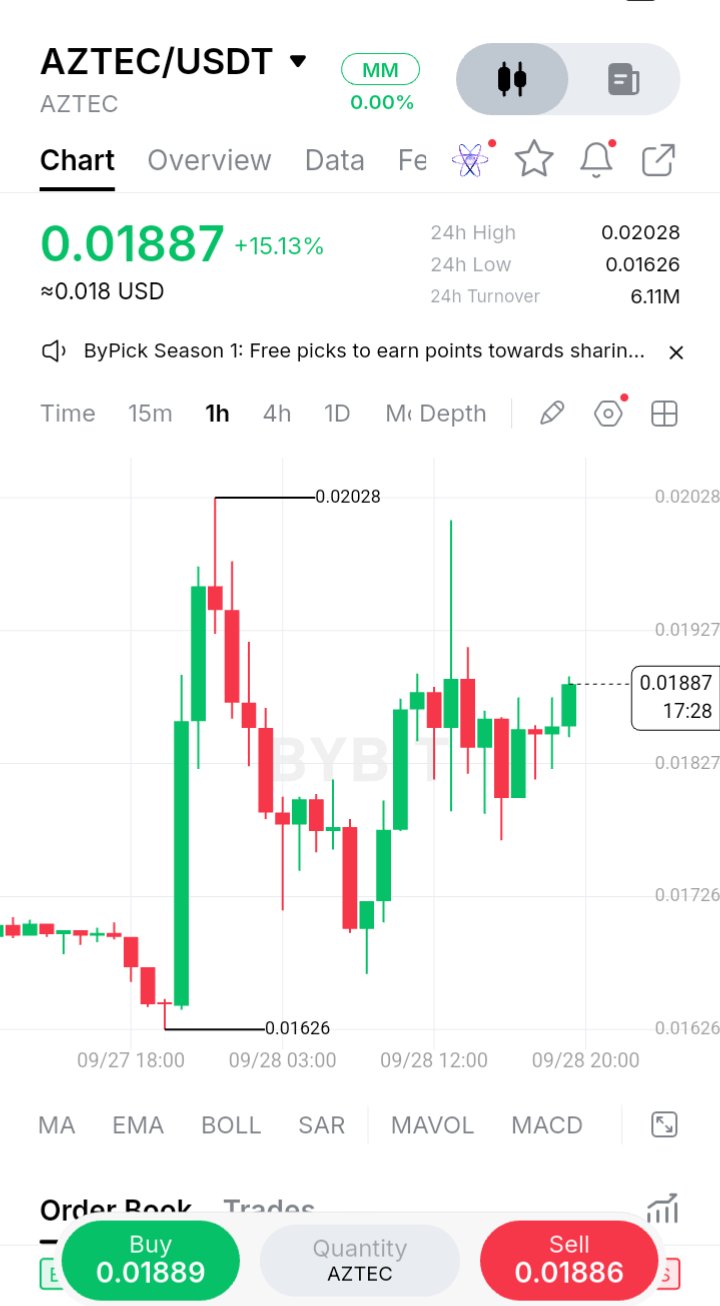
$AZTECUSDT $AZTEC is trading around $0.01887, showing a +15.13% move on the displayed chart. The 24-hour high is $0.02028, while the 24-hour low is $0.01626, with approximately $6.11M in 24-hour turnover. Market Structure On the 1H chart, price rebounded strongly from the $0.01626 low and recovered toward the $0.01900 area. After that recovery, price has been consolidating around $0.0183–$0.0189, indicating a period of short-term indecision. Support Levels $0.01827 — immediate chart support $0.01726 — lower support area $0.01626 — visible 24H low and major reference level Resistance Levels $0.01927 — first important resistance $0.02028 — visible 24H high and key resistance A sustained move above the $0.01927–$0.02028 zone would be an important technical development to watch. Conversely, weakness below $0.01827 could bring the lower support areas back into focus. No liquidation or open-interest data is visible in the provided chart, so those factors cannot be assessed from this screenshot alone. #ByXIMPACT #BybitAIBestReplies #PolyMarketPreIPO #ByPickMakeYourPickCount #BybitOdds

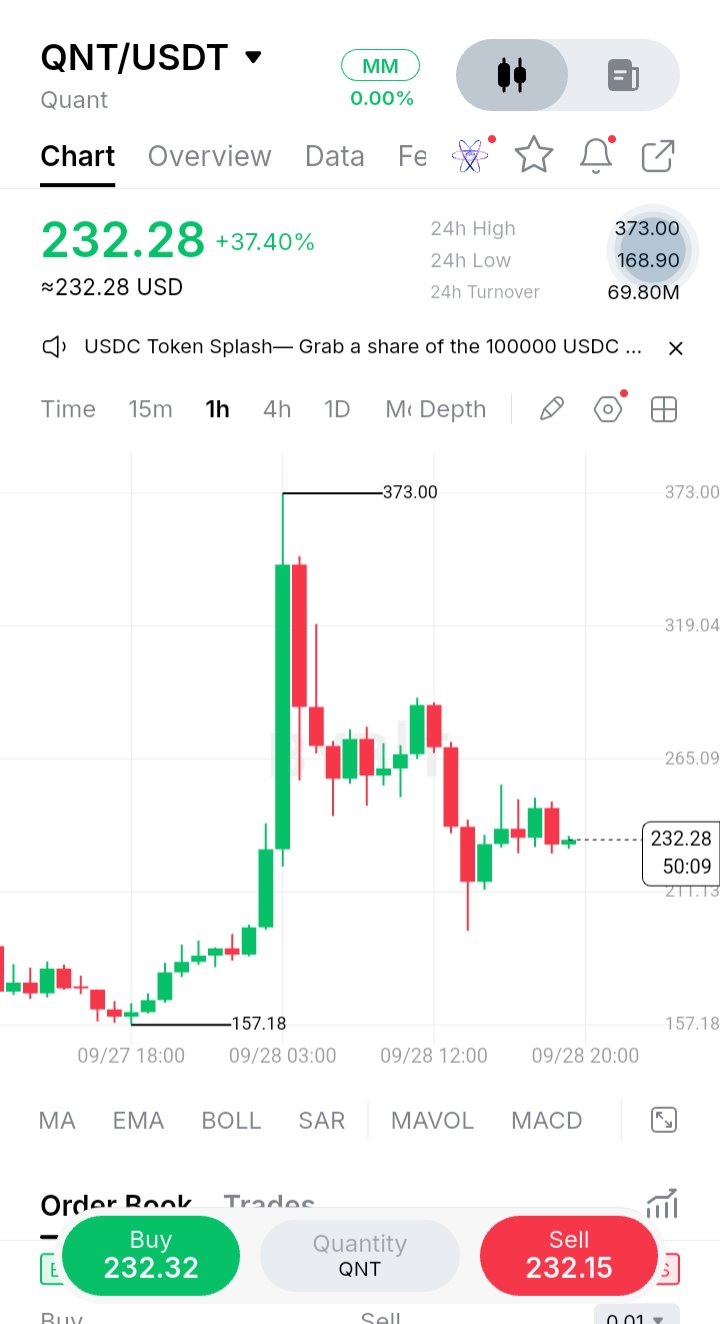
$QNTUSDT $QNT is trading around $232.28, showing a +37.40% move on the displayed market data. The 1-hour chart shows a sharp rally from the lower area, reaching a 24h high of $373.00, followed by a significant pullback and consolidation around the $230 region. Key Levels Support: $211.13, followed by the $168.90 24h low. The chart also shows a previous marked low near $157.18. Resistance: The first notable area is around $265.09, followed by $319.04 and the major high at $373.00. Structure The market remains highly volatile after the large upward move. Price is currently consolidating below $265.09, so the reaction around this level is important to watch. A sustained move above it would put higher resistance areas back into focus, while weakness below $211.13 could bring the lower support zones into attention. 24h Turnover: $69.80M. No liquidation or open-interest data is provided in the screenshot, so those factors cannot be assessed here. #ByXIMPACT #PolyMarketPreIPO #BybitOdds #NewFinancialPlatform #CPI3.4