Zynox_Q8
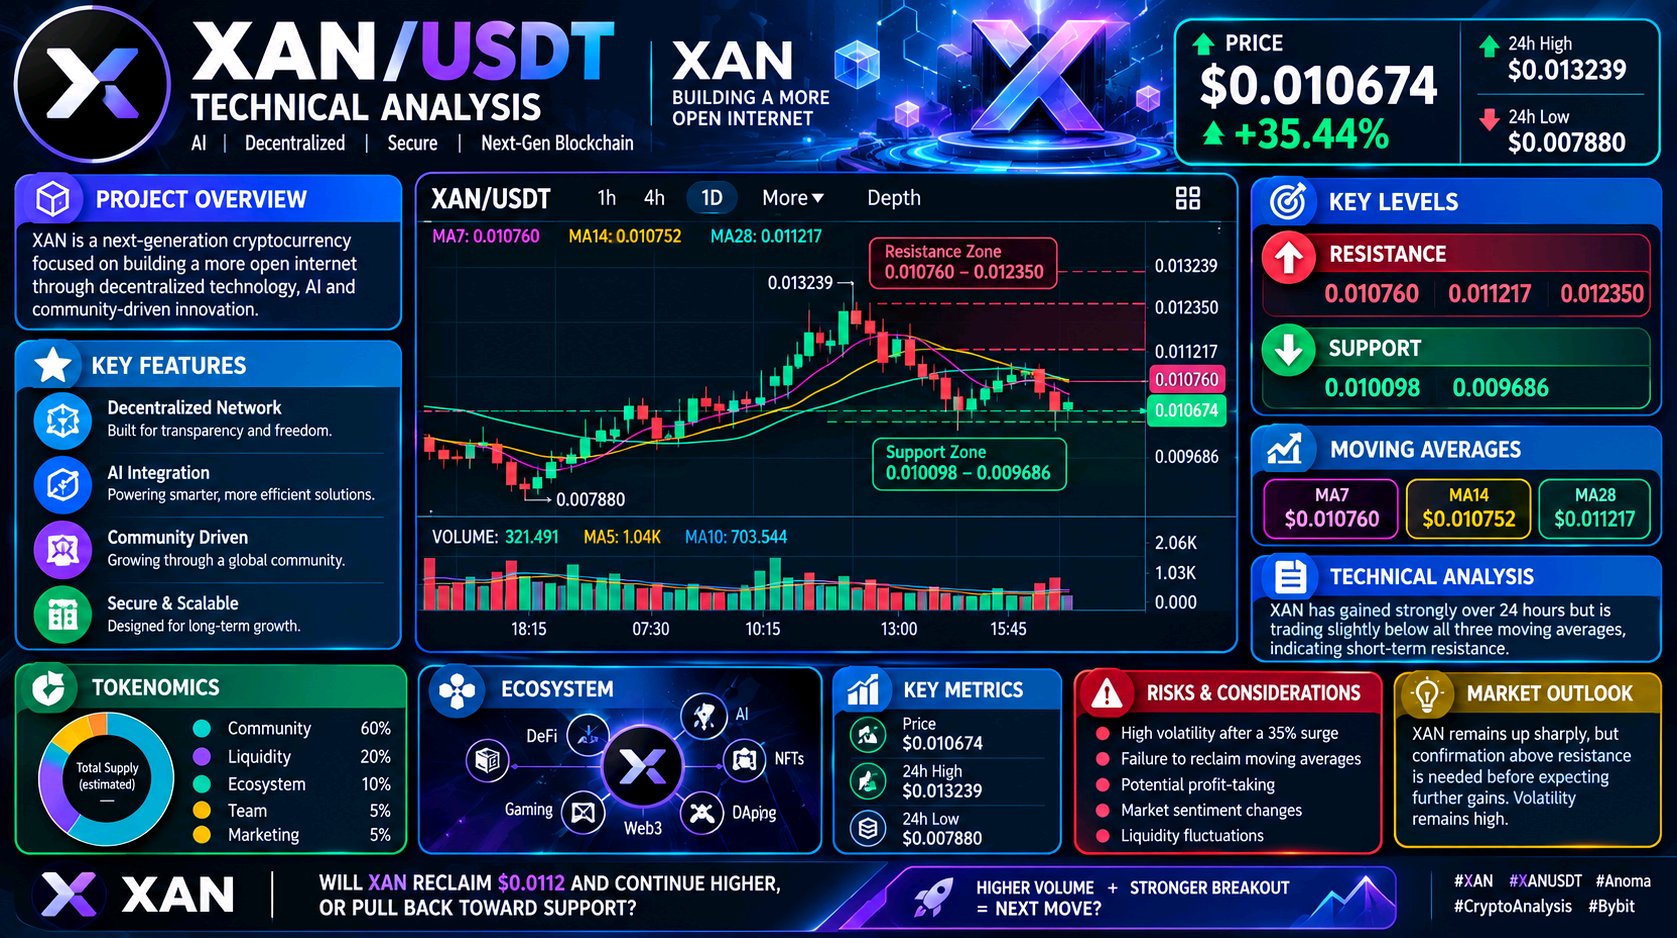
📊 $XANUSDT Technical Analysis 💰 Price: $0.010674 (+35.44%) 🔺 24h High: $0.013239 🔻 24h Low: $0.007880 📈 Moving Averages - MA7: $0.010760 - MA14: $0.010752 - MA28: $0.011217 XAN has gained strongly over 24 hours but is trading slightly below all three moving averages, indicating short-term resistance. 🎯 Key Levels - Resistance: $0.010760, $0.011217, $0.012350 - Support: $0.010098, $0.009686 🚀 Bullish Scenario: Reclaiming $0.011217 could open the way toward $0.012350. ⚠️ Bearish Scenario: Failure to recover the moving averages may lead to a retest of $0.010098. 📉 Volume: Displayed volume is below MA5 and MA10, suggesting the rally lacks strong volume confirmation. Market Outlook: XAN remains up sharply, but confirmation above resistance is needed before expecting further gains. Volatility remains high. 💬 Will XAN reclaim $0.0112 and continue higher, or pull back toward support? #ByXIMPACT #IMPACTbyTrade

📊 $GROVEUSDT Technical Analysis 💰 Price: $0.020581 (+274.20%) 🔺 24h High: $0.021265 🔻 24h Low: $0.005441 📈 Moving Averages - MA7: $0.018095 - MA14: $0.016614 - MA28: $0.014283 GROVE is showing strong bullish momentum, trading above all three moving averages after a sharp rally. 🎯 Key Levels - Resistance: $0.021265 - Support: $0.018095, $0.016614 🚀 Bullish Scenario: A sustained break above $0.021265 could signal further upside. ⚠️ Bearish Scenario: A pullback below $0.018095 may expose the $0.016614 support level. 📊 Volume: Current volume is above MA5 and MA10, confirming increased trading activity alongside the rally. Market Outlook: GROVE remains strongly bullish on the supplied chart, but after a 274% surge, volatility and profit-taking risks are elevated. 💬 Can GROVE break above $0.021265, or is a correction coming next? #ByXIMPACT #IMPACTbyTrade


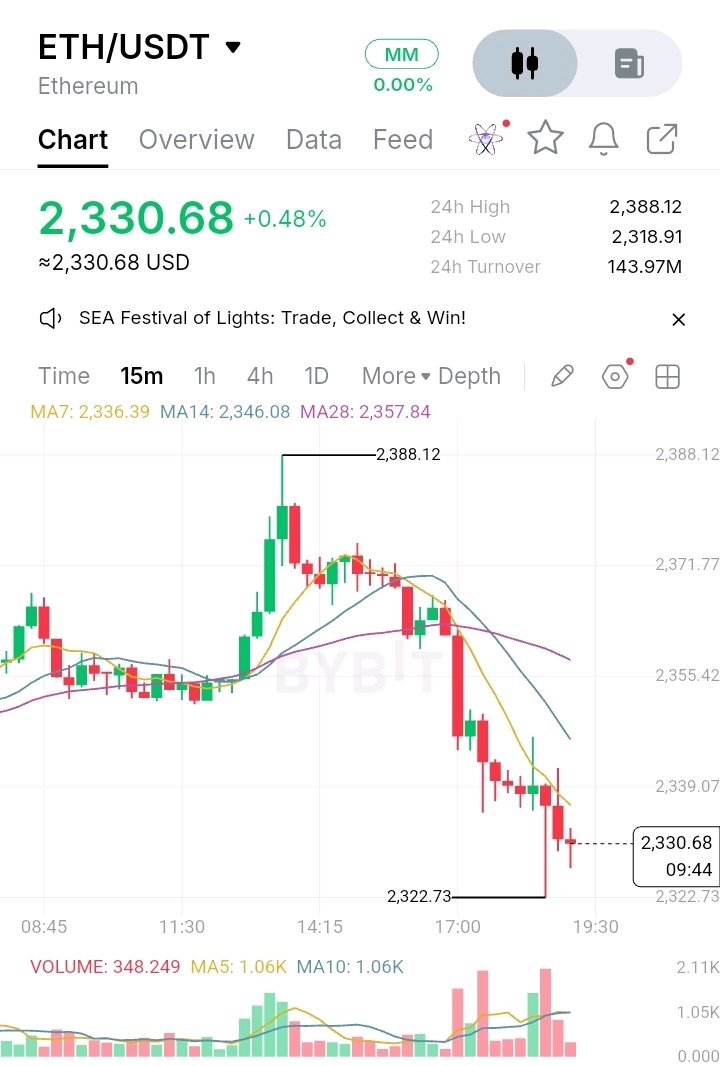
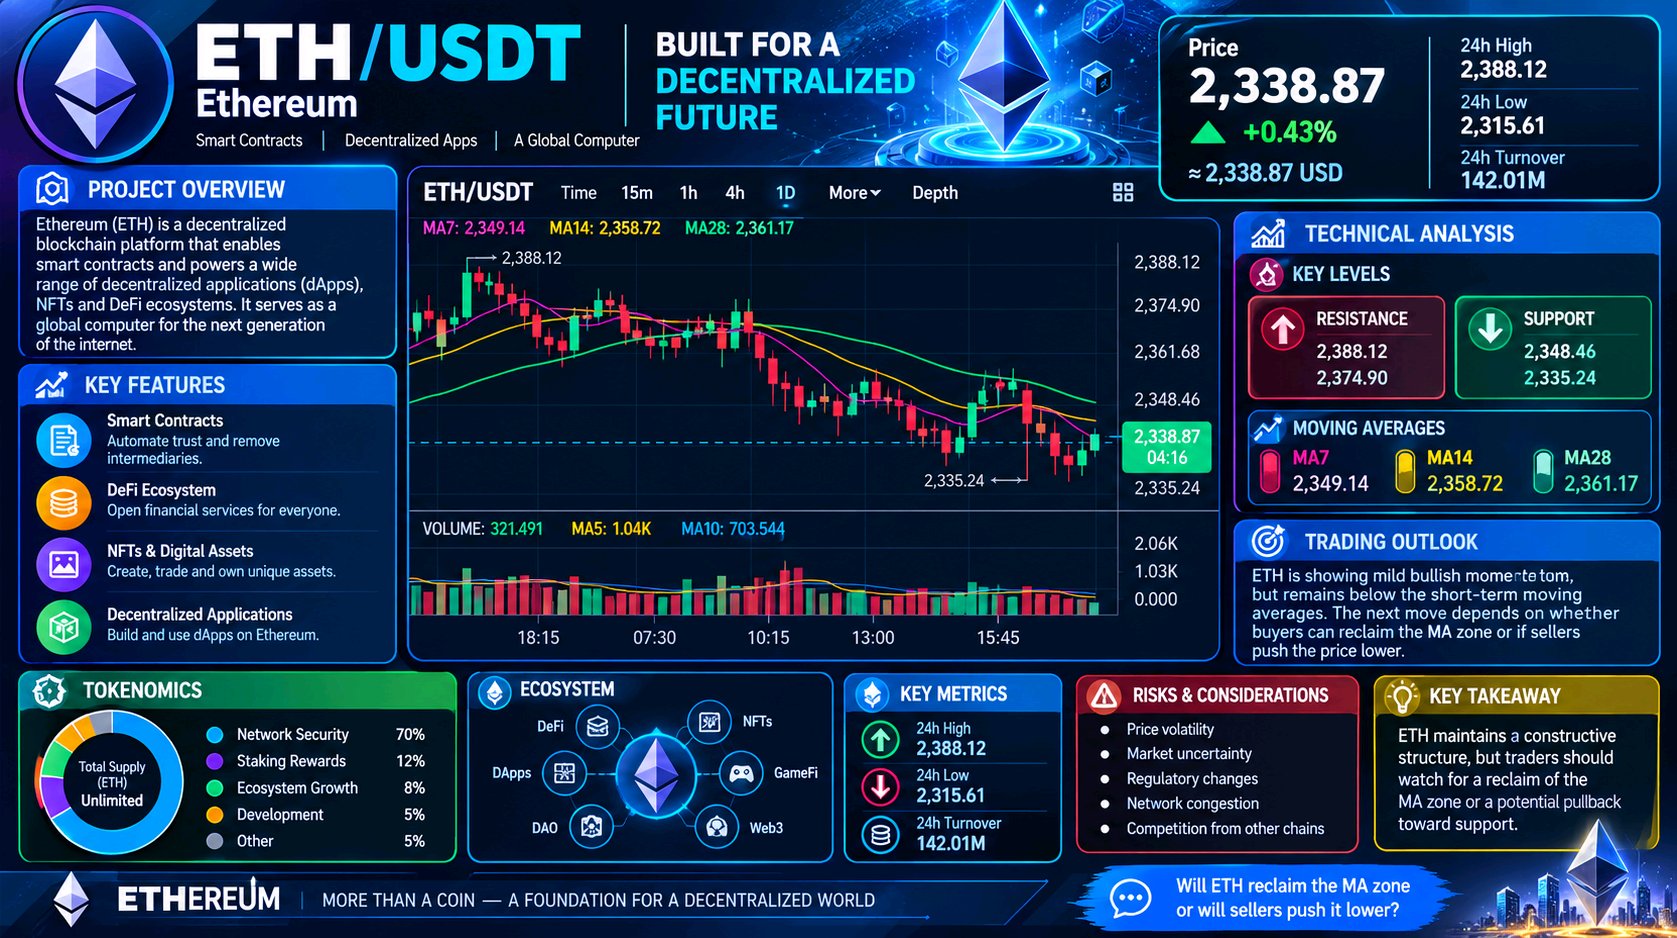
📊 $ETHUSDT Technical Analysis 💰 Price: $2,330.68 (+0.48%) 🔺 24h High: $2,388.12 🔻 24h Low: $2,318.91 📈 Moving Averages - MA7: $2,336.39 - MA14: $2,346.08 - MA28: $2,357.84 ETH is trading below all three moving averages, indicating short-term bearish pressure despite its positive 24-hour performance. 🎯 Key Levels - Resistance: $2,336, $2,346, $2,358 - Support: $2,322.73, $2,318.91 🚀 Bullish Scenario: Reclaiming $2,336 could open the way toward $2,346 and $2,358. ⚠️ Bearish Scenario: A break below $2,318.91 may signal further weakness. 📉 Volume: Displayed volume is below MA5 and MA10, suggesting limited buying momentum. Market Outlook: ETH remains under short-term pressure. Watch for a moving-average reclaim or a breakdown below support for the next directional signal. 💬 Will ETH recover above $2,350 or retest $2,319 first? #ByXIMPACT #IMPACTbyTrade
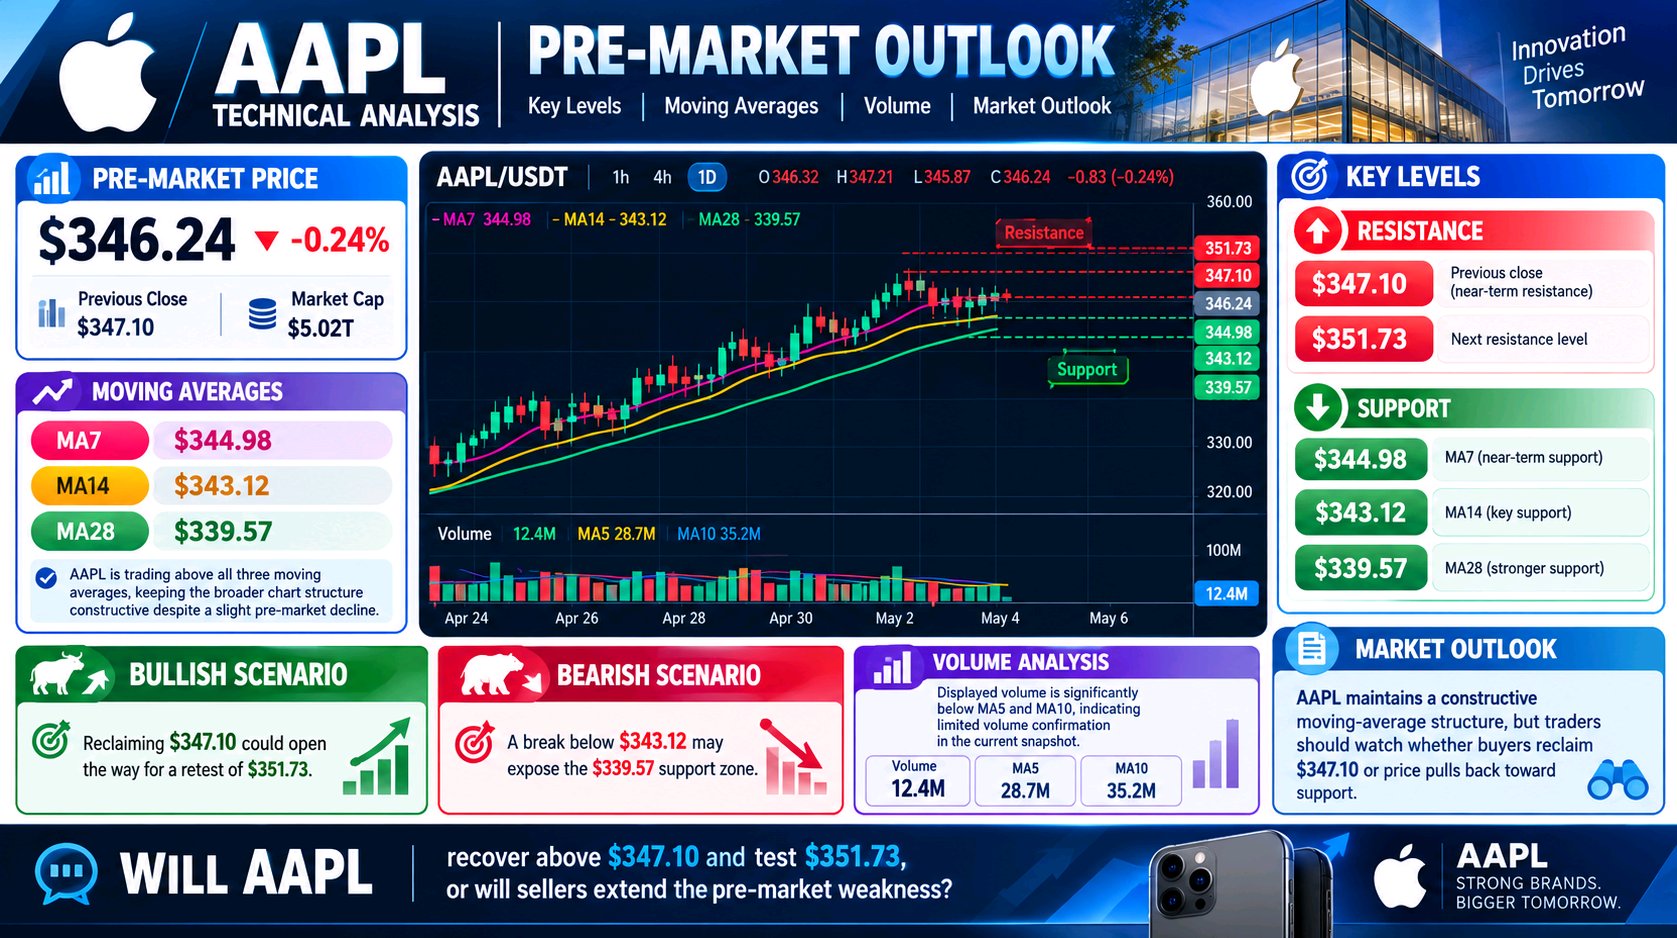
📊 $AAPLXUSDT Technical Analysis | Pre-Market Outlook 💰 Pre-Market Price: $346.24 (-0.24%) 🔹 Previous Close: $347.10 🔹 Market Cap: $5.02T 📈 Moving Averages - MA7: $344.98 - MA14: $343.12 - MA28: $339.57 AAPL is trading above all three moving averages, keeping the broader chart structure constructive despite a slight pre-market decline. 🎯 Key Levels - Resistance: $347.10, $351.73 - Support: $344.98, $343.12, $339.57 🚀 Bullish Scenario: Reclaiming $347.10 could open the way for a retest of $351.73. ⚠️ Bearish Scenario: A break below $343.12 may expose the $339.57 support zone. 📉 Volume: Displayed volume is significantly below MA5 and MA10, indicating limited volume confirmation in the current snapshot. Market Outlook: AAPL maintains a constructive moving-average structure, but traders should watch whether buyers reclaim $347.10 or price pulls back toward support. 💬 Will AAPL recover above $347.10 and test $351.73, or will sellers extend the pre-market weakness? #ByXIMPACT #IMPACTbyTrade

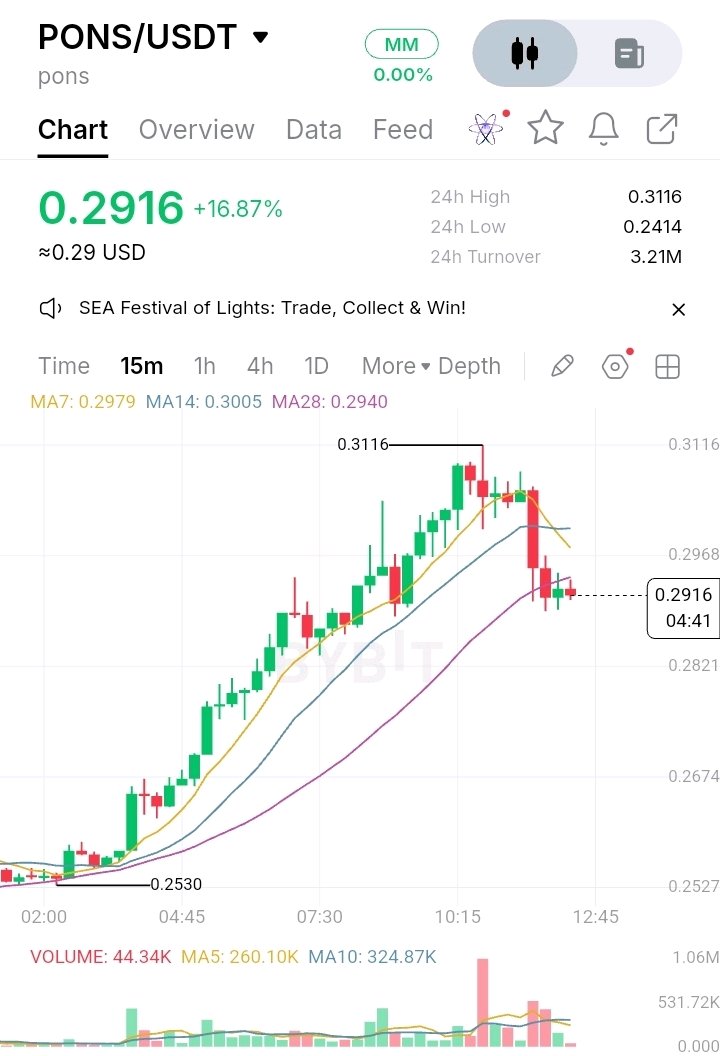
📊 $PONSUSDT Technical Analysis 💰 Price: 0.2916 USDT (+16.87%) 🔺 24h High: 0.3116 🔻 24h Low: 0.2414 📈 Moving Averages - MA7: 0.2979 - MA14: 0.3005 - MA28: 0.2940 PONS has posted a strong daily gain but is trading below all three moving averages, signaling possible short-term selling pressure. 🎯 Key Levels - Resistance: 0.2979, 0.3005, 0.3116 - Support: 0.2821, 0.2674, 0.2530 🚀 Bullish Scenario: Reclaiming 0.2979–0.3005 could open the way for a retest of 0.3116. ⚠️ Bearish Scenario: Losing 0.2821 may expose the 0.2674 support level. 📉 Volume: Displayed volume is below MA5 and MA10, so a sustained recovery needs stronger volume confirmation. Market Outlook: PONS remains strongly positive over 24 hours, but traders should watch whether price can reclaim the moving averages or continues to pull back. 💬 Can PONS break above 0.3116, or will sellers push it lower? #ByXIMPACT #IMPACTbyTrade

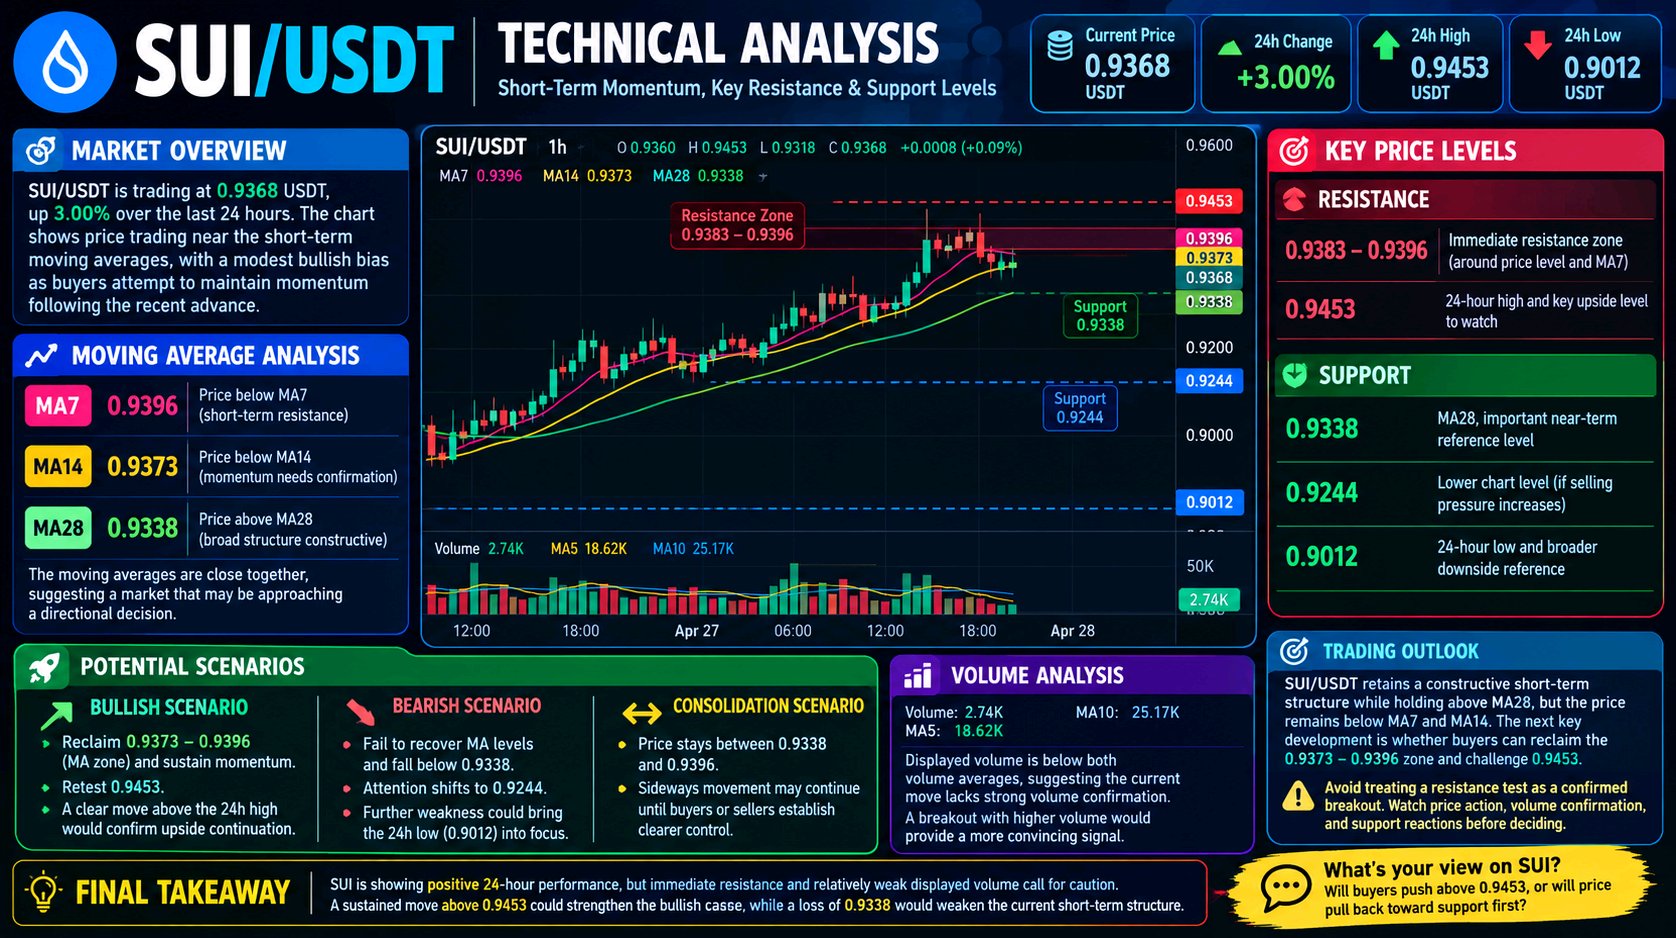
📊 $SUIUSDT Technical Analysis 💰 Price: 0.9368 USDT (+3.00%) 🔺 24h High: 0.9453 🔻 24h Low: 0.9012 📈 Moving Averages - MA7: 0.9396 - MA14: 0.9373 - MA28: 0.9338 SUI is trading below MA7 and MA14 but remains above MA28, indicating a cautiously bullish short-term structure. 🎯 Key Levels - Resistance: 0.9396, 0.9453 - Support: 0.9338, 0.9244, 0.9012 🚀 Bullish Scenario: A sustained move above 0.9396 could open the way for a retest of 0.9453. ⚠️ Bearish Scenario: A break below 0.9338 may expose 0.9244 as the next support. 📉 Volume: Displayed volume is below MA5 and MA10, so a breakout needs stronger volume confirmation. Market Outlook: SUI remains constructive above 0.9338, but confirmation is needed before expecting further upside. 💬 Will SUI break above 0.9453 or pull back toward support? #ByXIMPACT #IMPACTbyTrade #MyByXTake

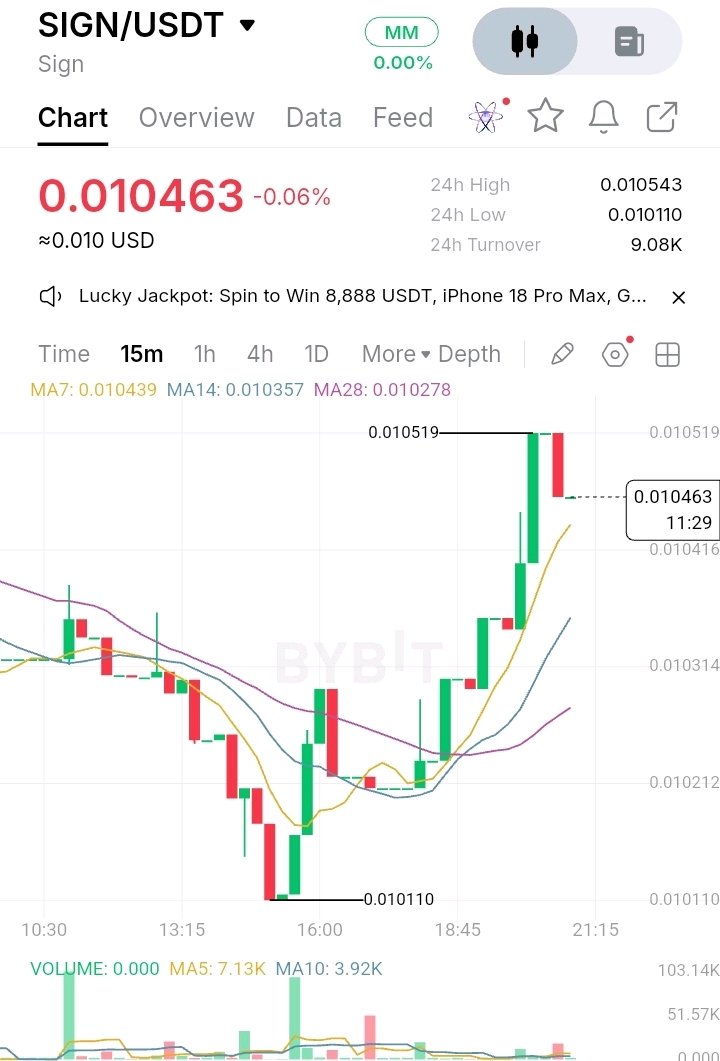
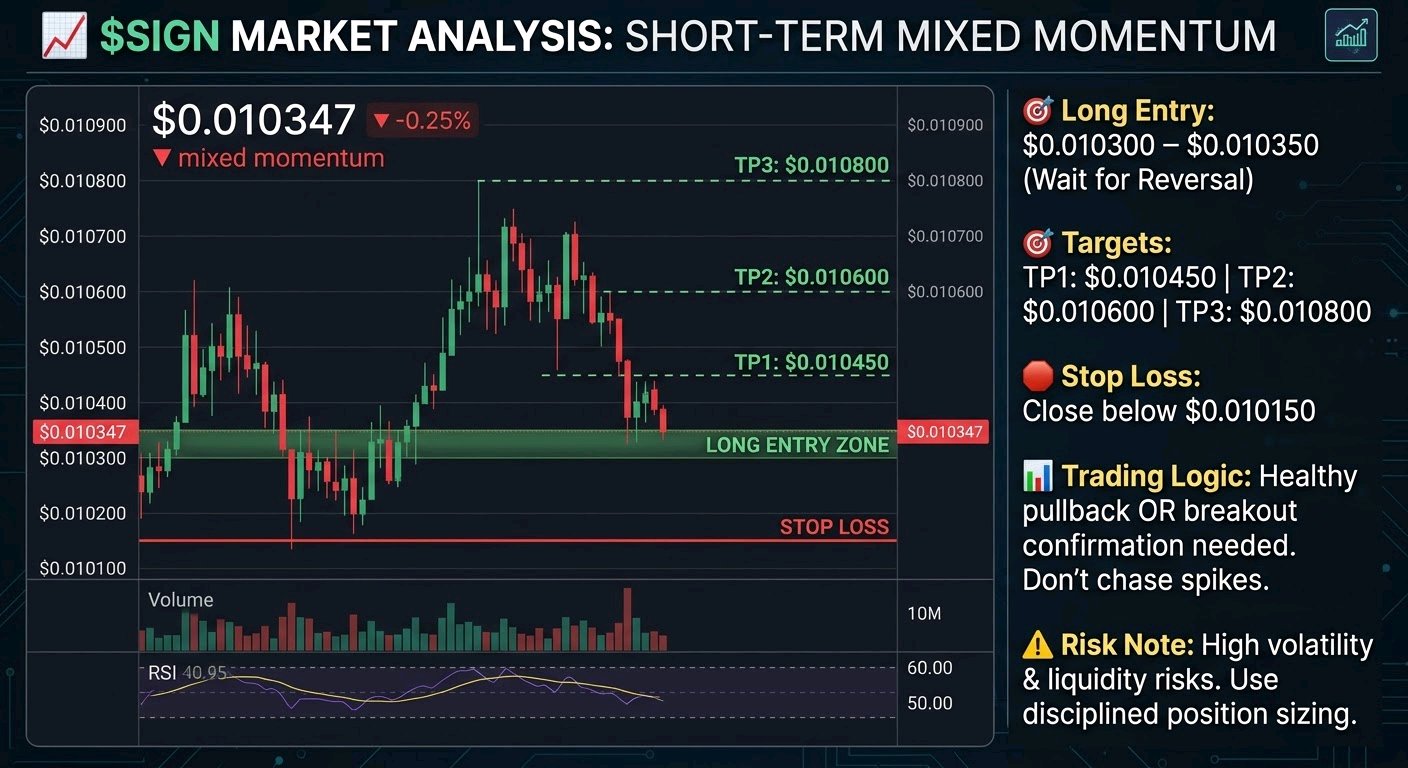
📈 $SIGN is showing mixed short-term momentum, trading at $0.010347 (-0.25%). Price is experiencing slight selling pressure, so buyers need to regain control to support a potential recovery. A confirmed bounce from support or a breakout with strong volume could create a trading opportunity. 🎯 Long Entry Zone: $0.010300 – $0.010350 Targets: 🎯 TP1: $0.010450 🎯 TP2: $0.010600 🎯 TP3: $0.010800 🛑 Stop Loss: Exit if price breaks and closes below $0.010150. 📊 Trading Logic: Wait for a healthy pullback into the entry zone with a confirmed bullish reversal, or a breakout and successful retest above $0.010450 before entering. Since SIGN is currently down 0.25%, confirmation from price action and buying volume is important before anticipating further upside. Avoid chasing sudden price spikes and prioritize confirmed setups. SIGN may experience sharp price swings and liquidity-driven volatility. A breakdown below the entry zone could invalidate the bullish setup. Use disciplined position sizing, avoid excessive leverage, and protect your capital first. $SIGNUSDT #ByXIMPACT #MyByXTake
📈 $ETH is showing positive bullish momentum, trading at $2,329.11 (+0.35%). Buyers are maintaining a slight advantage, and the current price action suggests a potential upside move if momentum strengthens and key support levels continue to hold. 🎯 Long Entry Zone: $2,320 – $2,330 Targets: 🎯 TP1: $2,345 🎯 TP2: $2,365 🎯 TP3: $2,390 🛑 Stop Loss: Exit if price breaks and closes below $2,305. 📊 Trading Logic: Wait for a healthy pullback into the entry zone with a confirmed bounce, or a confirmed breakout and retest above $2,345 before entering. ETH is currently showing a modest positive price movement, but stronger buying volume and confirmation are needed to support further upside. Avoid chasing extended candles and focus on disciplined, trend-following entries. ETH remains vulnerable to sudden volatility and resistance-driven pullbacks. A breakdown below $2,320 could weaken the bullish setup. Use disciplined position sizing, avoid excessive leverage, and confirm the setup on your trading chart before entering. Protect capital first. $ETHUSDT #ByXIMPACT #MyByXTake
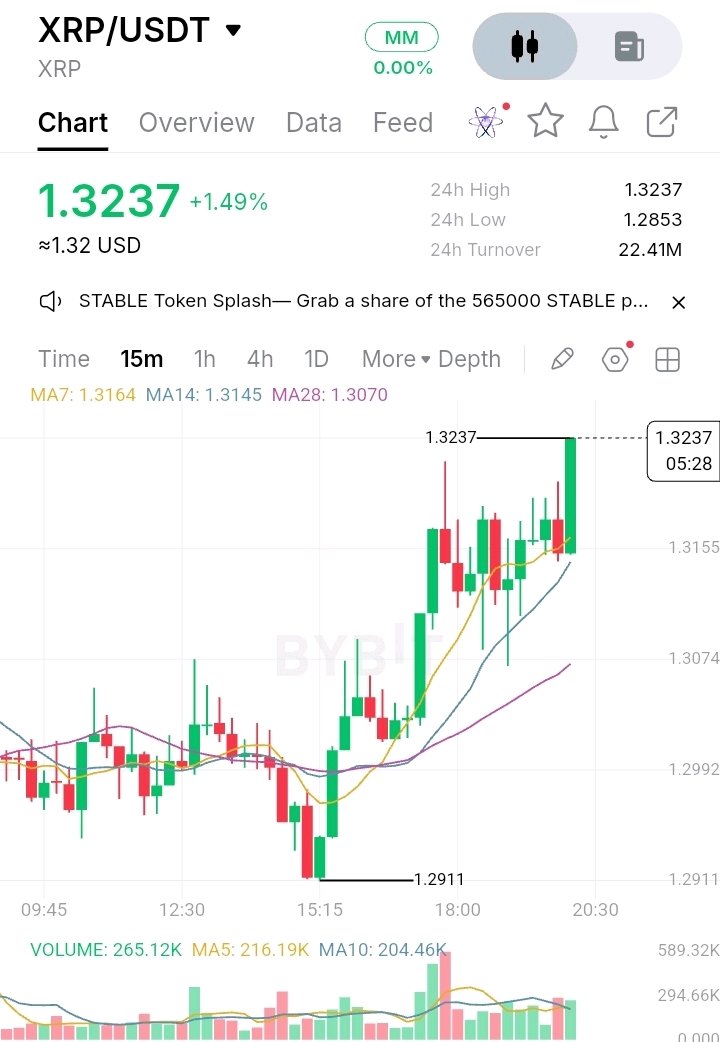

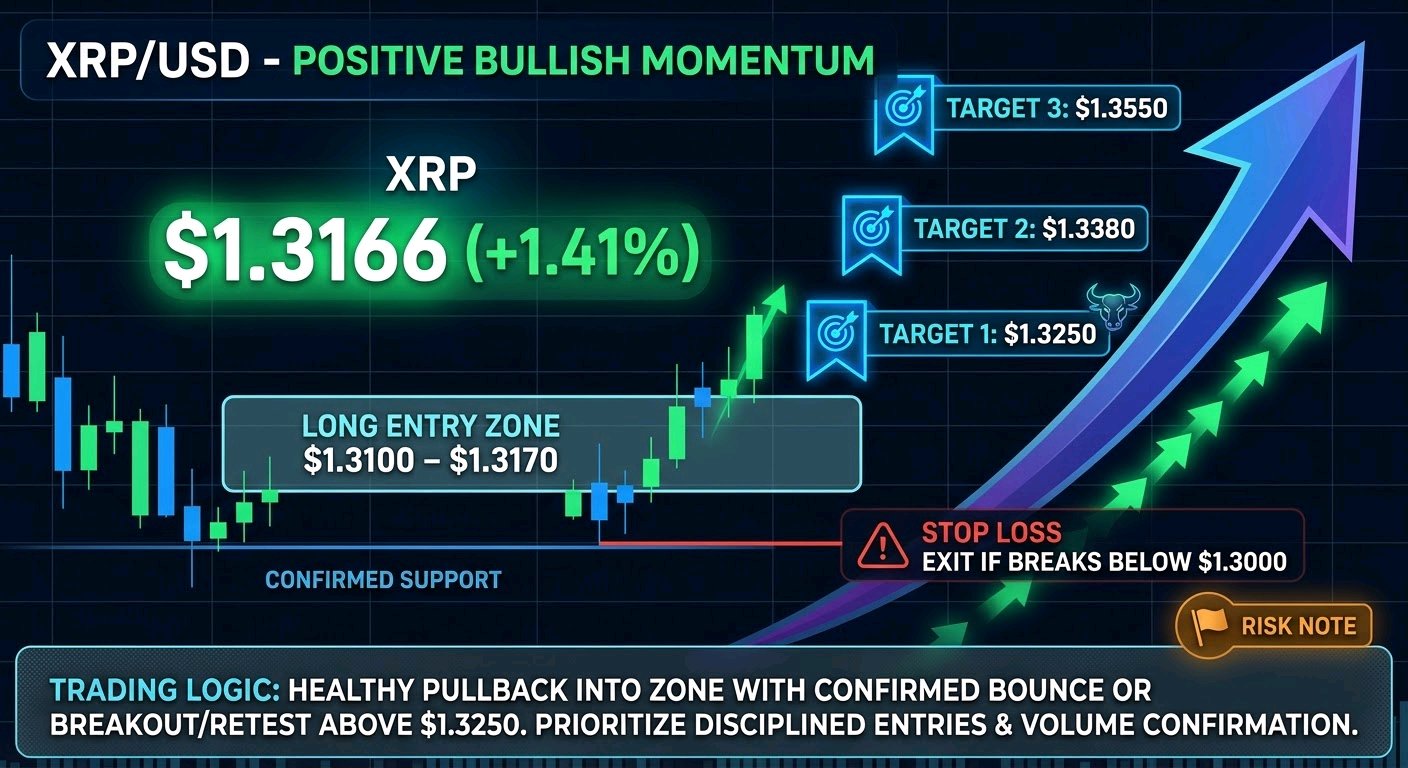
📈 $XRP is showing positive bullish momentum, trading at $1.3166 (+1.41%). Buyers are showing strength, and the positive price movement suggests potential for further upside if bullish momentum continues and key support levels hold. 🎯 Long Entry Zone: $1.3100 – $1.3170 Targets: 🎯 TP1: $1.3250 🎯 TP2: $1.3380 🎯 TP3: $1.3550 🛑 Stop Loss: Exit if price breaks and closes below $1.3000. 📊 Trading Logic: Wait for a healthy pullback into the entry zone with a confirmed bounce, or a breakout and successful retest above $1.3250 before entering. XRP is currently showing positive momentum, but confirmation from price action and volume is important before expecting further upside. Avoid chasing extended candles and prioritize disciplined entries. Despite the current gain of 1.41%, XRP can experience sharp reversals around resistance levels. If price loses the $1.3100 area, bullish momentum may weaken. Use disciplined position sizing, avoid excessive leverage, and protect your capital first. $XRPUSDT #ByXIMPACT #MyByXTake
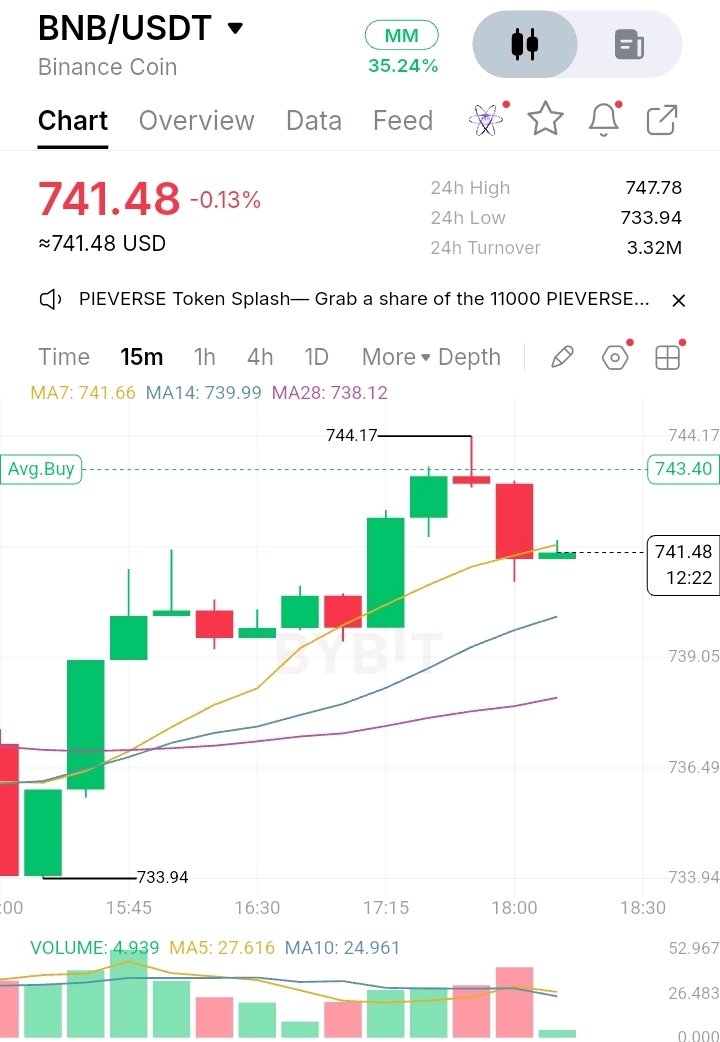
📈 $BNB is showing signs of a potential bullish continuation, with price holding near $741.48 and trading above the MA14 ($739.99) and MA28 ($738.12). Buyers are attempting to maintain control, while the MA7 near $741.66 represents an immediate level to reclaim for stronger upside momentum. 🎯 Long Entry Zone: $739.80 – $741.00 Targets: 🎯 TP1: $743.40 🎯 TP2: $745.50 🎯 TP3: $747.70 🛑 Stop Loss: Exit if price breaks and closes below $737.80. 📊 Trading Logic: Wait for a healthy pullback into the entry zone with a confirmed bounce, or a breakout and successful retest above $743.40 before entering. BNB is holding above its MA14 and MA28, suggesting potential short-term support. A sustained move above the immediate resistance zone could open the path toward $745.50 and the 24-hour high near $747.78. BNB is currently down approximately 0.13%, so bullish continuation is not yet confirmed. A breakdown below the $738 support area could weaken the setup. Use disciplined position sizing, avoid excessive leverage, and wait for price confirmation before entering. Protect capital first. $BNBUSDT #ByXIMPACT #MyByXTake

📈 $SOL is showing signs of a potential bullish recovery near the $100.00 level. Price is currently trading around the MA7 ($99.81), MA14 ($99.91), and MA28 ($100.11), indicating that SOL is testing an important short-term resistance zone. Buyers need to reclaim this area to strengthen the bullish outlook. 🎯 Long Entry Zone: $99.70 – $99.95 Targets: 🎯 TP1: $100.40 🎯 TP2: $101.00 🎯 TP3: $102.00 🛑 Stop Loss: Exit if price breaks and closes below $99.40. 📊 Trading Logic: Wait for a confirmed bounce from the $99.70–$99.95 support zone or a breakout and successful retest above $100.15 before entering. SOL is currently trading slightly below its MA28, so confirmation from buyers is important. A sustained move above $100.15 could open the path toward $100.40 and higher resistance levels. ⚠️ Risk Note: SOL is showing short-term weakness, with price down approximately 0.48% in the provided snapshot. A breakdown below $99.46 could invalidate the bullish setup. Use disciplined position sizing, avoid excessive leverage, and always wait for confirmation. Protect capital first. $SOLUSDT #ByXIMPACT #IMPACTbyTrade

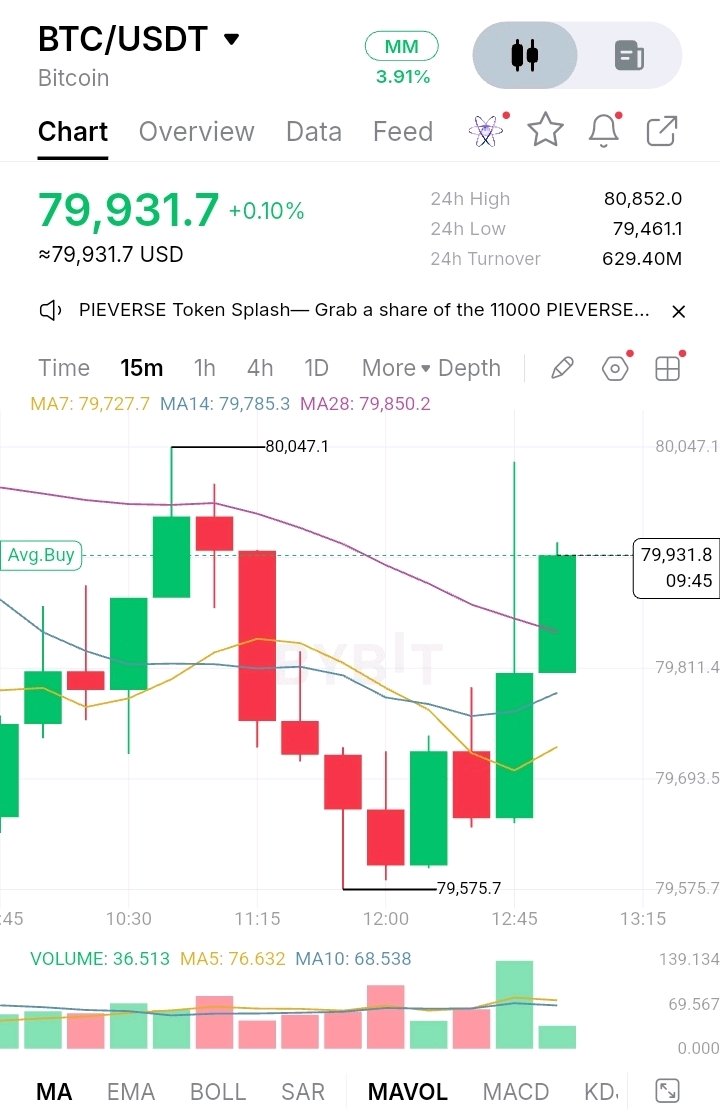
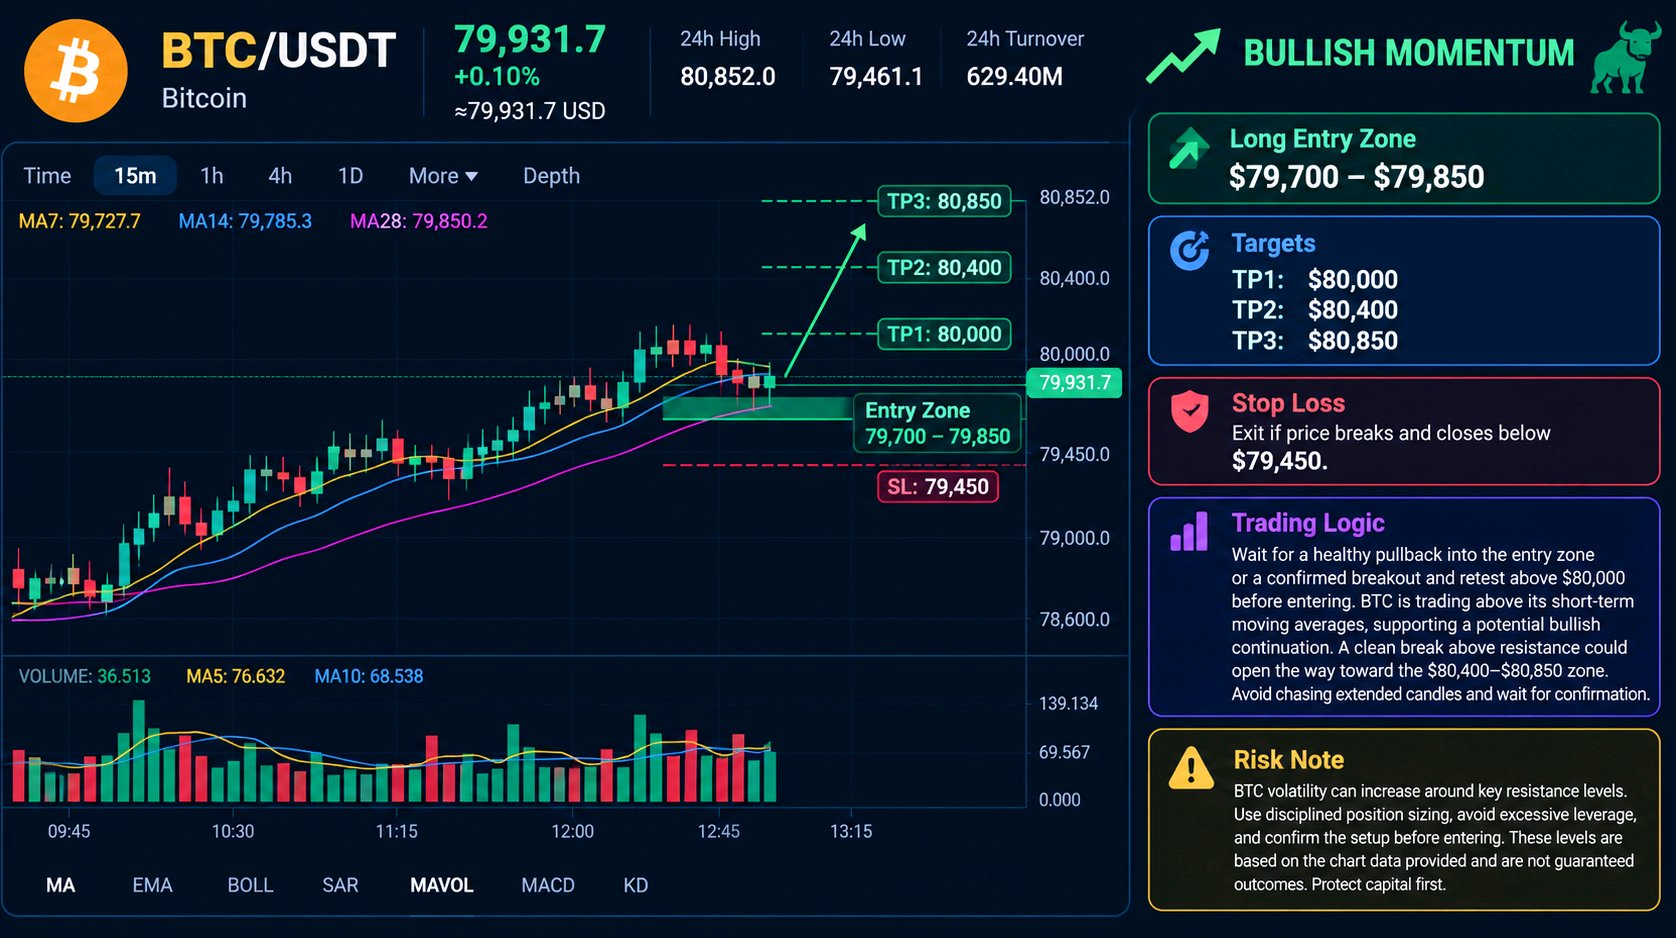
📈 $BTC is showing bullish momentum, with price holding near the $79,900 level and trading above the MA7, MA14, and MA28 moving averages. Buyers are showing short-term strength, while the current structure suggests potential upside if key support levels continue to hold. 🎯 Long Entry Zone: $79,700 – $79,850 Targets: 🎯 TP1: $80,000 🎯 TP2: $80,400 🎯 TP3: $80,850 🛑 Stop Loss: Exit if price breaks and closes below $79,450. 📊 Trading Logic: Wait for a healthy pullback into the entry zone or a confirmed breakout and retest above $80,000 before entering. BTC is trading above its short-term moving averages, supporting a potential bullish continuation. A clean break above resistance could open the way toward the $80,400–$80,850 zone. Avoid chasing extended candles and wait for confirmation. ⚠️ Risk Note: BTC volatility can increase around key resistance levels. Use disciplined position sizing, avoid excessive leverage, and confirm the setup before entering. These levels are based on the chart data provided and are not guaranteed outcomes. Protect capital first. $BTCUSDT #ByXIMPACT
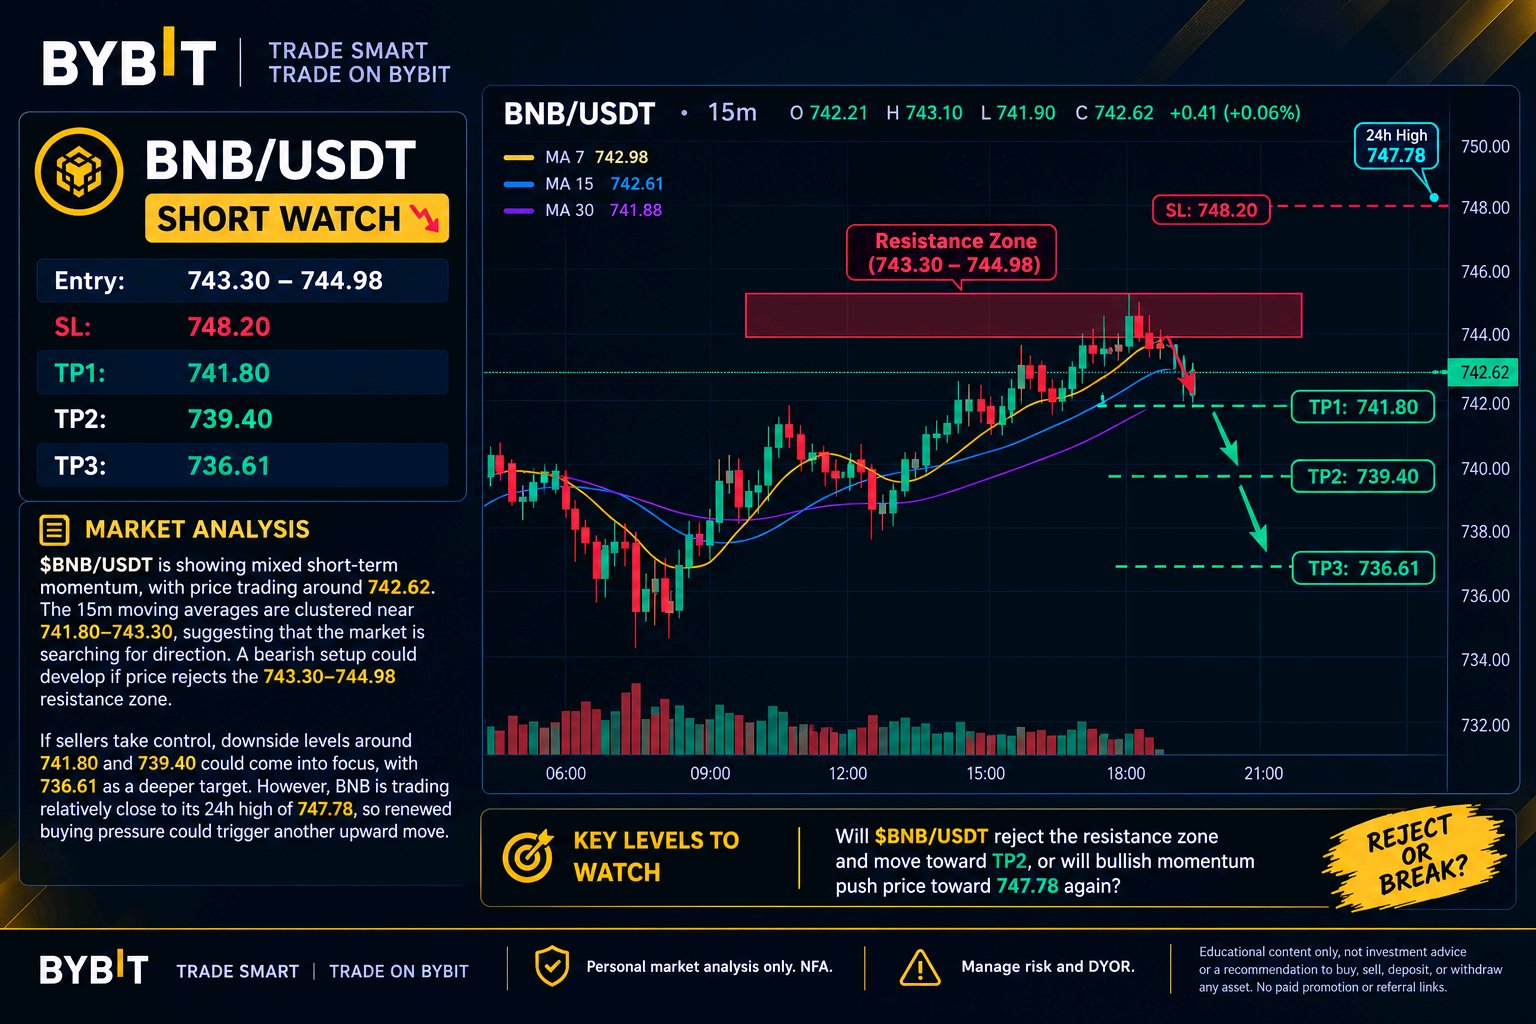
$BNB/USDT – SHORT WATCH Entry: 743.30 – 744.98 SL: 748.20 TP1: 741.80 TP2: 739.40 TP3: 736.61 $BNB/USDT is showing mixed short-term momentum, with price trading around 742.62. The 15m moving averages are clustered near 741.80–743.30, suggesting that the market is searching for direction. A bearish setup could develop if price rejects the 743.30–744.98 resistance zone. If sellers take control, downside levels around 741.80 and 739.40 could come into focus, with 736.61 as a deeper target. However, BNB is trading relatively close to its 24h high of 747.78, so renewed buying pressure could trigger another upward move. The key is to watch for clear rejection and confirmation before considering a short setup, with strict risk management throughout. Will $BNB/USDT reject the resistance zone and move toward TP2, or will bullish momentum push price toward 747.78 again? Personal market analysis only. NFA. Manage risk and DYOR. Educational content only, not investment advice or a recommendation to buy, sell, deposit, or withdraw any asset. No paid promotion or referral/affiliate links. $BNBUSDT #ByXIMPACT #BybitStocks
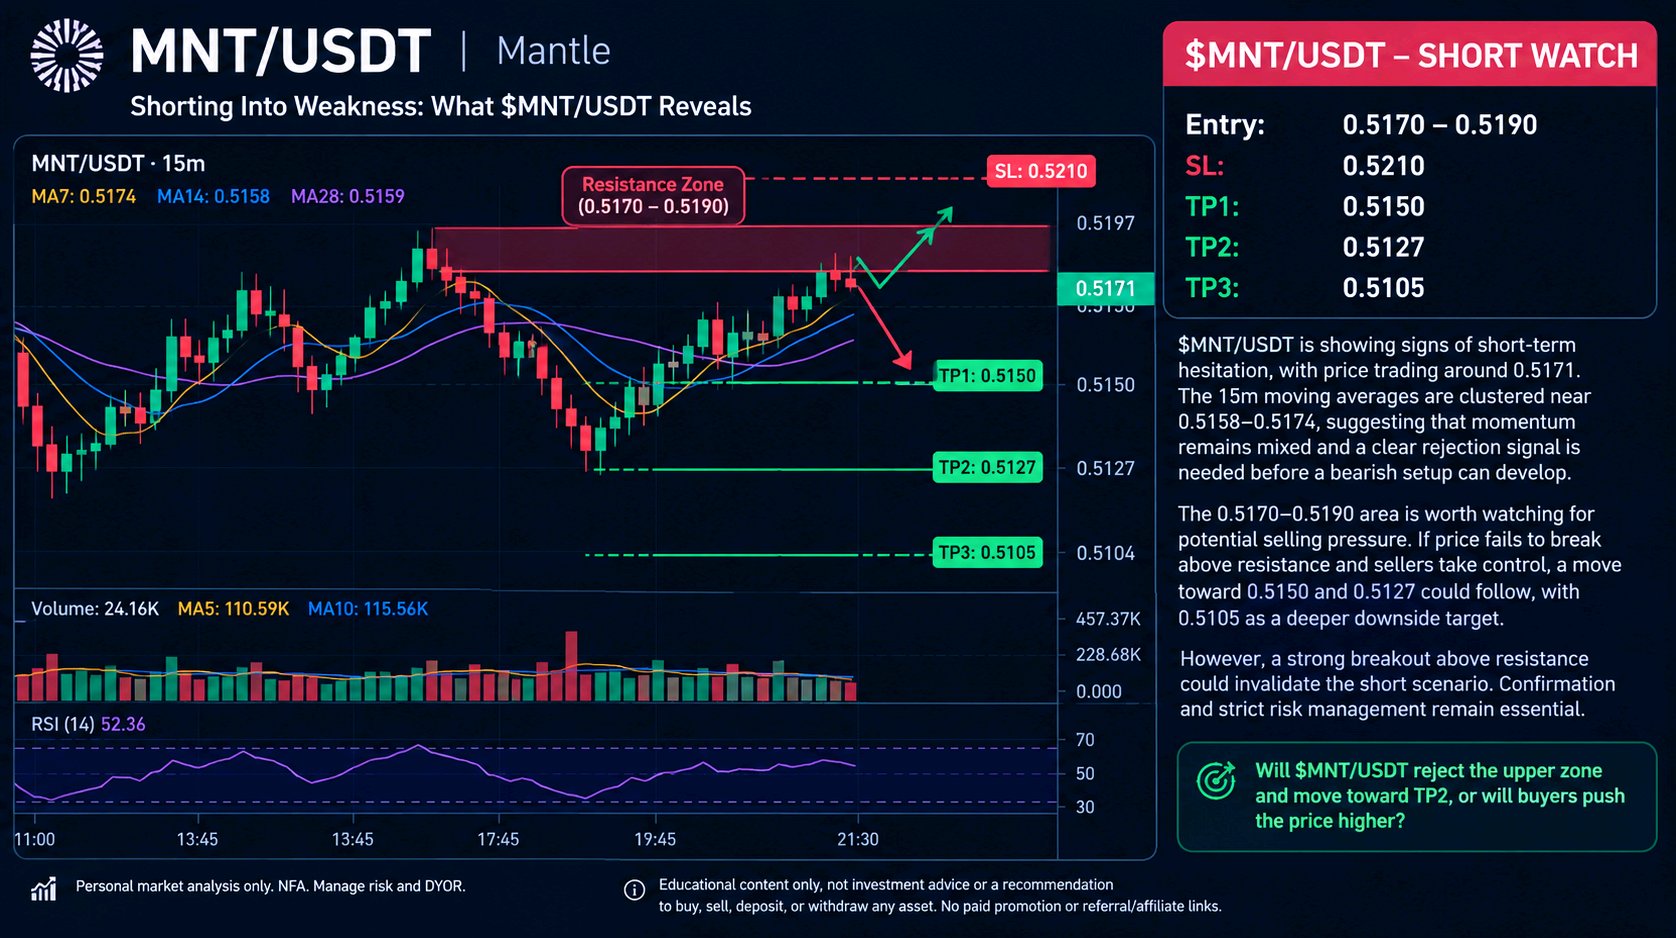
$MNT/USDT – SHORT WATCH Entry: 0.5170 – 0.5190 SL: 0.5210 TP1: 0.5150 TP2: 0.5127 TP3: 0.5105 $MNT/USDT is showing signs of short-term hesitation, with price trading around 0.5171. The 15m moving averages are clustered near 0.5158–0.5174, suggesting that momentum remains mixed and a clear rejection signal is needed before a bearish setup can develop. The 0.5170–0.5190 area is worth watching for potential selling pressure. If price fails to break above resistance and sellers take control, a move toward 0.5150 and 0.5127 could follow, with 0.5105 as a deeper downside target. However, a strong breakout above resistance could invalidate the short scenario. Confirmation and strict risk management remain essential. Will $MNT/USDT reject the upper zone and move toward TP2, or will buyers push the price higher? Personal market analysis only. NFA. Manage risk and DYOR. Educational content only, not investment advice or a recommendation to buy, sell, deposit, or withdraw any asset. No paid promotion or referral/affiliate links. $MNTUSDT #ByXIMPACT #BybitStocks
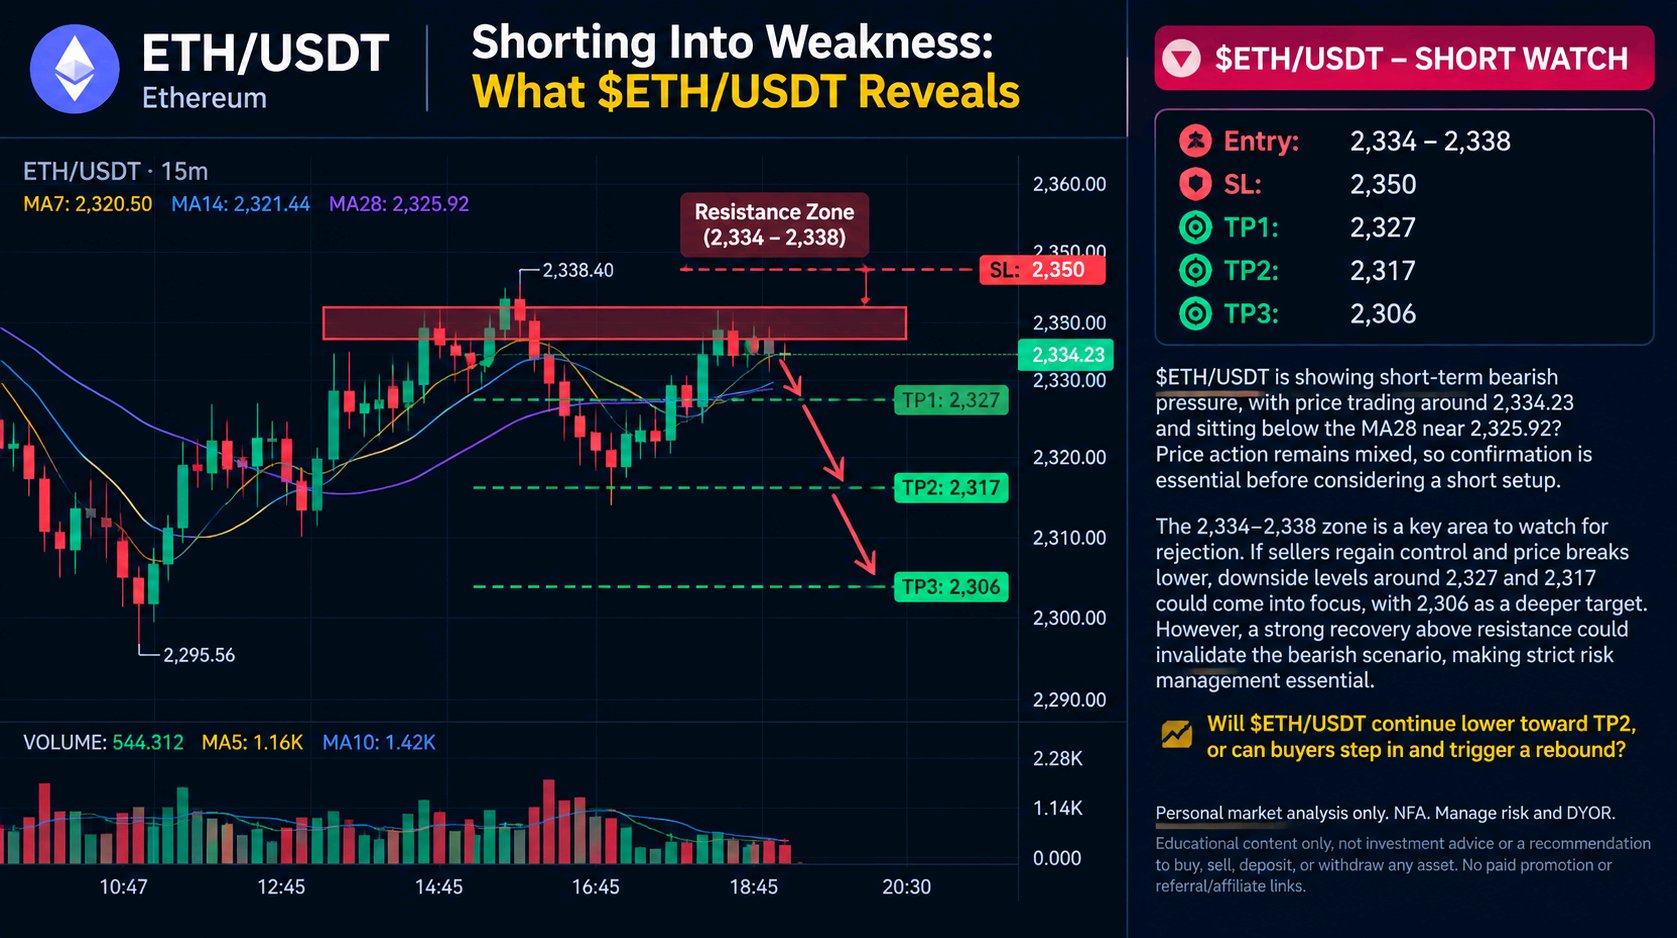
$ETH/USDT – SHORT WATCH Entry: 2,334 – 2,338 SL: 2,350 TP1: 2,327 TP2: 2,317 TP3: 2,306 $ETH/USDT is showing short-term bearish pressure, with price trading around 2,334.23 and sitting below the MA28 near 2,325.92? Price action remains mixed, so confirmation is essential before considering a short setup. The 2,334–2,338 zone is a key area to watch for rejection. If sellers regain control and price breaks lower, downside levels around 2,327 and 2,317 could come into focus, with 2,306 as a deeper target. However, a strong recovery above resistance could invalidate the bearish scenario, making strict risk management essential. Will $ETH/USDT continue lower toward TP2, or can buyers step in and trigger a rebound? Personal market analysis only. NFA. Manage risk and DYOR. Educational content only, not investment advice or a recommendation to buy, sell, deposit, or withdraw any asset. No paid promotion or referral/affiliate links. $ETHUSDT #ByXIMPACT #BybitStocks
$SOL/USDT – SHORT WATCH Entry: 101.50 – 101.75 SL: 102.35 TP1: 101.00 TP2: 100.50 TP3: 99.90 SOL/USDT is showing short-term strength, with price trading around 101.49 and the 15m moving averages aligned near 101.18–101.43. This suggests buyers still have some control, so a short setup needs clear rejection near the 101.50–101.75 resistance zone. If price fails to break higher and selling pressure increases, a move toward 101.00 and 100.50 could develop, with 99.90 as a deeper downside level. However, a sustained breakout above resistance could invalidate the bearish setup, making strict risk management essential. Will SOL/USDT reject the 101.50–101.75 zone and move lower toward TP2, or will bullish momentum push price toward new intraday highs? Personal market analysis only. NFA. Manage risk and DYOR. Educational content only, not investment advice or a recommendation to buy, sell, deposit, or withdraw any asset. No paid promotion or referral/affiliate links. $SOLUSDT #ByXIMPACT #MyByXTake

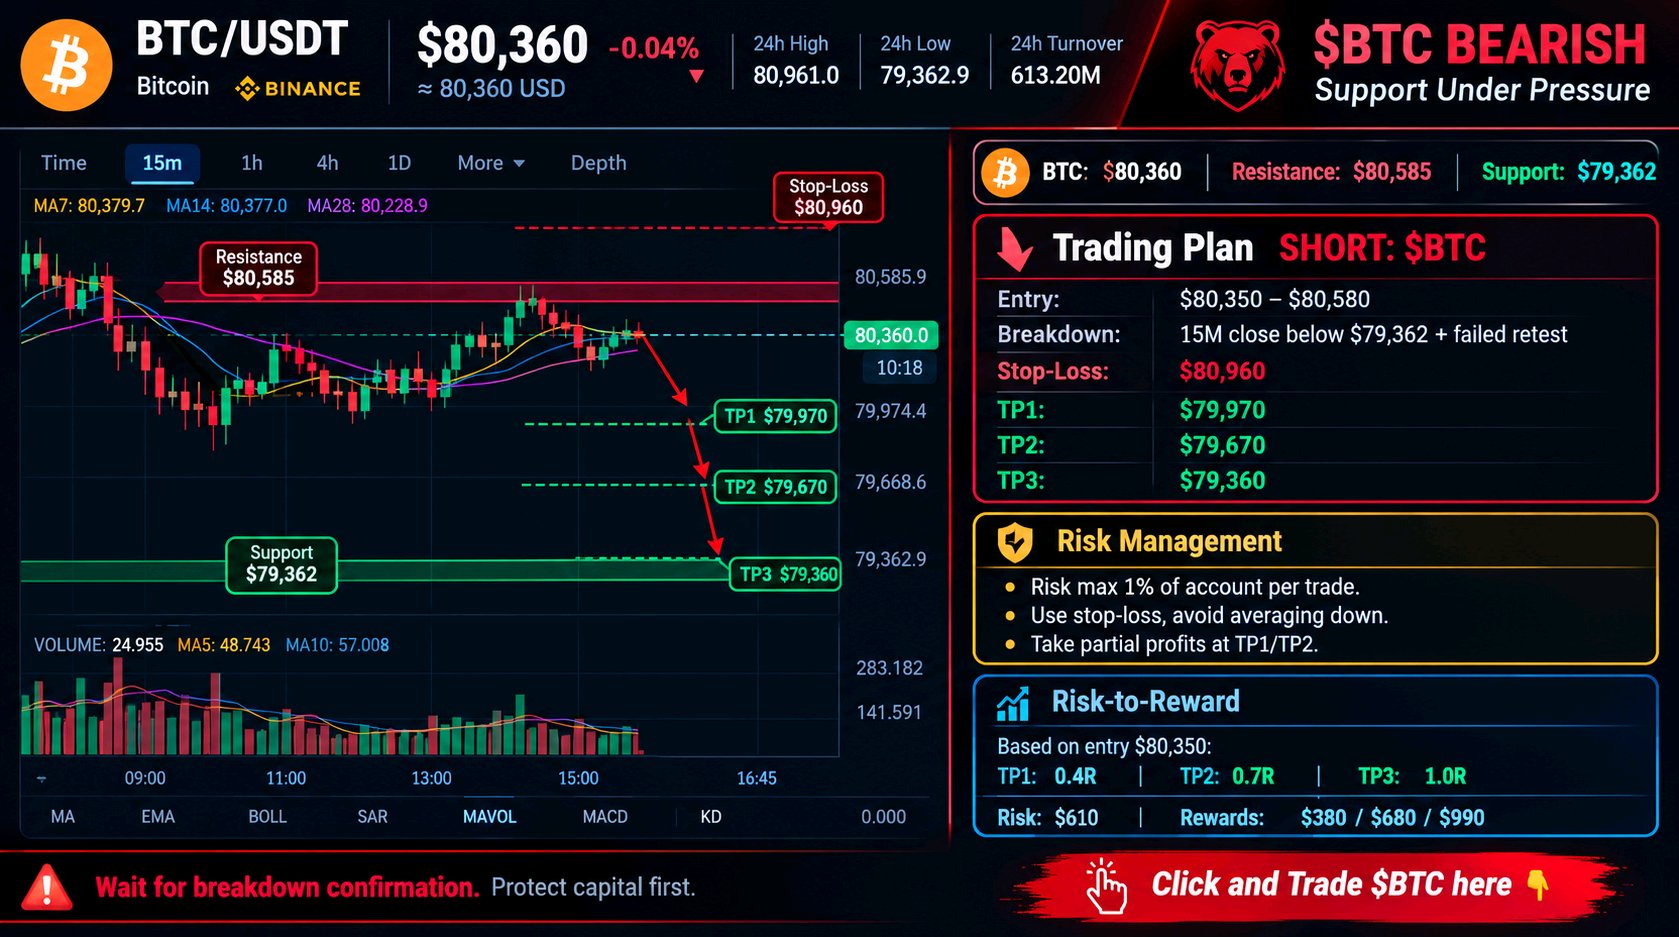
📉 BTC BEARISH | Support Under Pressure BTC: $80,360 | Resistance: $80,585 | Support: $79,362 👑 Trading Plan SHORT: $BTC Entry: $80,350–$80,580 Breakdown: 15M close below $79,362 + failed retest Stop-Loss: $80,960 TP1: $79,970 TP2: $79,670 TP3: $79,360 ⚠️ Risk Management Risk max 1% of account per trade. Use stop-loss, avoid averaging down, and take partial profits. 📊 Risk-to-Reward Based on entry $80,350: TP1: 0.4R | TP2: 0.7R | TP3: 1.0R Risk: $610 | Rewards: $380 / $680 / $990 Wait for breakdown confirmation. Protect capital first. $BTCUSDT #ByXIMPACT #IMPACTbyTrade
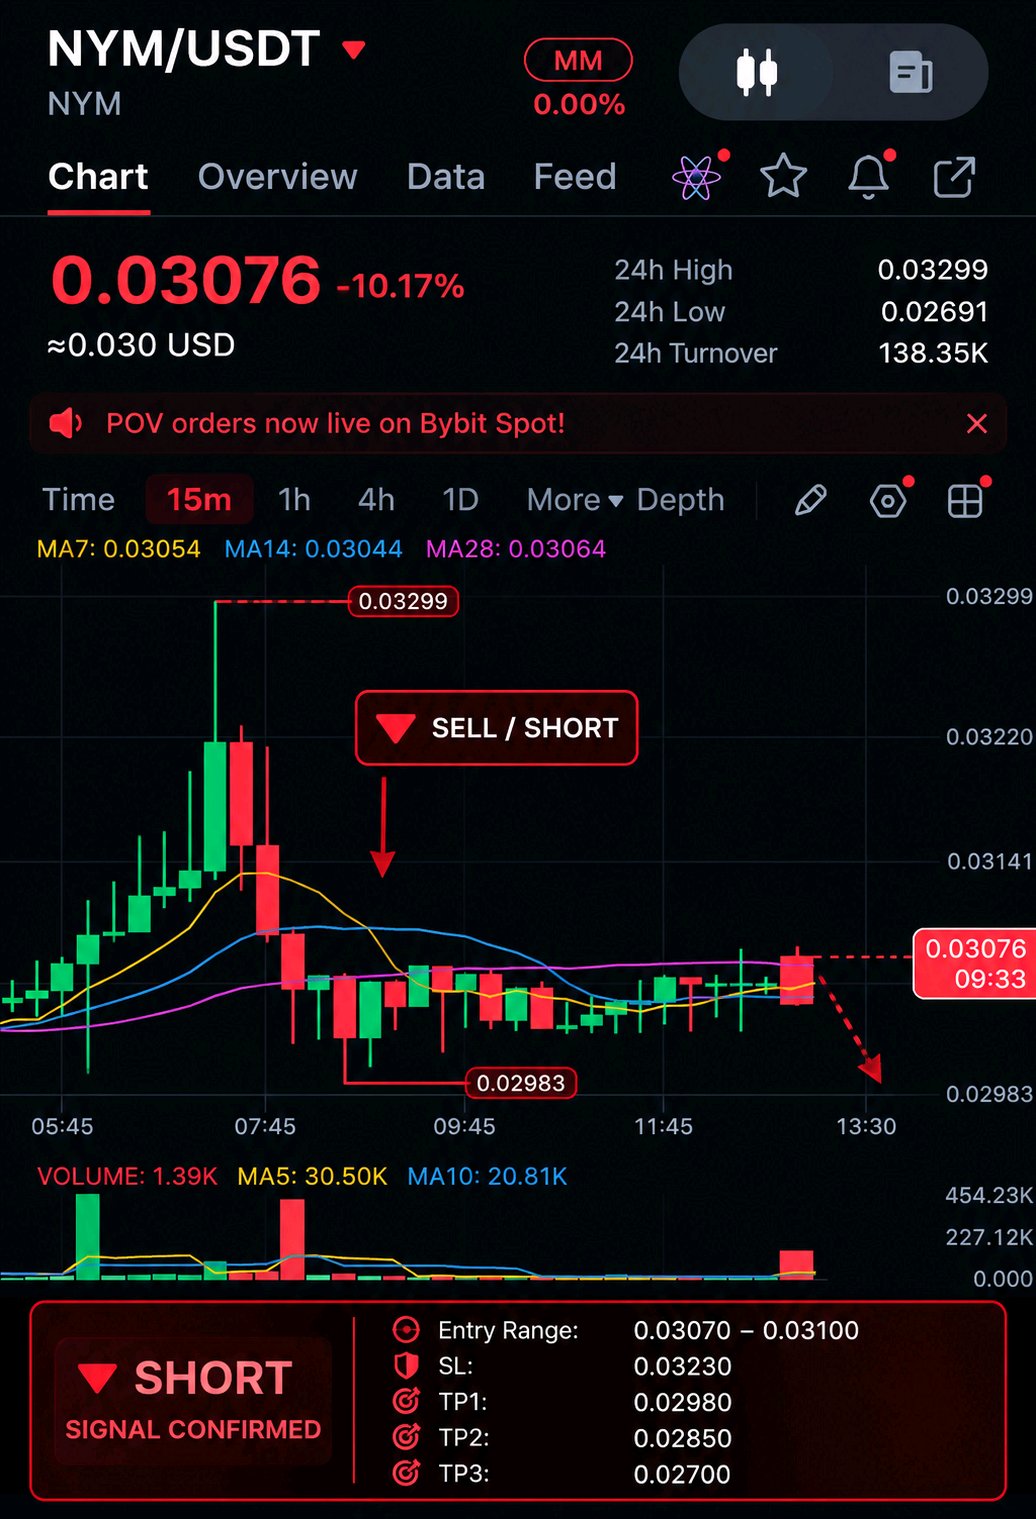
$NYM BIG LONG 📈: NYM is showing bullish momentum after bouncing from the $0.02983 support zone. The latest green candle signals a potential recovery, with price pushing above the short-term moving averages. A breakout above nearby resistance could drive further upside. Trading Ideas LONG $NYM Entry: 0.03050 – 0.03080 SL: 0.02970 TP1: 0.03100 TP2: 0.03140 TP3: 0.03200 Trade $NYM here: 👇 #ByXIMPACT #BybitStocks