
muhammed
$HYPERUSDT 📚 CRYPTO EDUCATION: WHAT IS TOKENOMICS AND WHY DOES IT MATTER? 🪙 Have you ever wondered why some cryptocurrencies have billions of tokens while others have only a few million? The answer starts with something called TOKENOMICS. Tokenomics means the economic structure of a cryptocurrency, including how its tokens are created, distributed, supplied and used. Here are 4 important things to understand: 1️⃣ Total Supply The maximum or total number of tokens that can exist, depending on the project's design. 2️⃣ Circulating Supply The number of tokens currently available in the market. 3️⃣ Token Distribution How tokens are allocated among developers, investors, users and the community. 4️⃣ Token Utility What the token is actually used for within its ecosystem. 💡 Why does tokenomics matter? Understanding tokenomics helps investors evaluate supply, demand, potential dilution and risks before making decisions. Remember: A low token price does not automatically mean a cryptocurrency is cheap or undervalued. 🎯 TODAY'S QUESTION: Which tokenomics factor do you consider most important? A️⃣ Total Supply B️⃣ Circulating Supply C️⃣ Token Distribution D️⃣ Token Utility Share your answer and let's learn together! #ByXIMPACT #IMPACTbyTrade $PARTIUSDT

$USDCUSDT 📚 CRYPTO EDUCATION: 5 Things to Check Before Investing in Any Cryptocurrency! 🔍 Before buying a cryptocurrency just because it's trending, take a moment to do your own research. Here are five things every beginner should check. 👇 1️⃣ Understand the project What problem does the cryptocurrency solve? If you cannot explain its purpose, take time to learn more. 2️⃣ Check the team and documentation Read the project's official website and documentation. Look for clear information about its goals, technology, and development. 3️⃣ Understand tokenomics Learn about the total token supply, circulating supply, token distribution, and whether new tokens may enter circulation. 4️⃣ Examine the risks Crypto prices are volatile. Consider liquidity, competition, security risks, and the possibility of losing your investment. 5️⃣ Watch out for unrealistic promises 🚨 Claims of guaranteed profits or risk-free returns are major warning signs. No cryptocurrency investment is guaranteed to succeed. 💡 Remember: A popular coin is not automatically a good investment. Research first, think independently, and never invest money you cannot afford to lose. 👇 QUESTION FOR THE COMMUNITY: When researching a new cryptocurrency, what do you check first? A️⃣ The project B️⃣ The team C️⃣ Tokenomics D️⃣ The risks Share your answer in the comments! 👇 #ByXIMPACT #IMPACTbyTrade $HYPEUSDT

$PEPEUSDT 🚨 CRYPTO EDUCATION: 3 Common Mistakes Every Beginner Must Avoid! Are you new to cryptocurrency? Before you start investing, make sure you understand these three common mistakes. 👇 1️⃣ FOMO — Fear of Missing Out 📈 When you see a coin rising rapidly, you may feel pressured to buy immediately. Remember, a rising price doesn't guarantee further gains. Research before making any decision. 2️⃣ Ignoring Security 🔐 Never share your wallet recovery phrase, password, or verification codes with anyone. Be careful with suspicious links, fake giveaways, and messages promising guaranteed profits. 3️⃣ Investing Money You Cannot Afford to Lose 💸 Crypto prices can rise and fall sharply. Don't risk money meant for food, rent, school fees, or other essential needs. Avoid borrowing money to speculate on crypto. 💡 The golden rule: Protect your money, learn continuously, and never let excitement control your decisions. 👇 QUESTION OF THE DAY: Which mistake do you think is the most dangerous for beginners? A️⃣ FOMO B️⃣ Poor security C️⃣ Investing money you cannot afford to lose Comment A, B, or C, and tell us why! 👇 #CryptoEducation #ByX #CryptoBeginners #CryptoSafety #RiskManagement #IMPACTbyTrade #ByXIMPACT

📊 CRYPTO EDUCATION: Understanding Candlestick Charts (Part 1 & 2) 🕯️ Have you ever looked at a crypto chart and wondered what those green and red candles mean? 🤔📈 Let's make it simple! 🟢 Green candle: The price closed higher than it opened. 🔴 Red candle: The price closed lower than it opened. 📍 The body shows the difference between the opening and closing prices, while the wicks show the highest and lowest prices reached during that period. 📈 Uptrend: The price generally moves upward over time. 📉 Downtrend: The price generally moves downward over time. ⚠️ Important lesson: Candlesticks help us understand price movements, but they cannot predict the future with certainty. Always consider market conditions and manage your risk before making any trading decision. 💡 Learn first. Analyse carefully. Never rush into a trade because of excitement or fear of missing out. 👇 Let's test your knowledge! If Bitcoin opens at $60,000 and closes at $62,000, is the candle green or red? Drop your answer in the comments! 👇 #CryptoEducation #ByX #Bitcoin #CandlestickCharts #LearnCrypto #RiskManagement #ByXIMPACT #IMPACTbyTrade $BNBUSDT
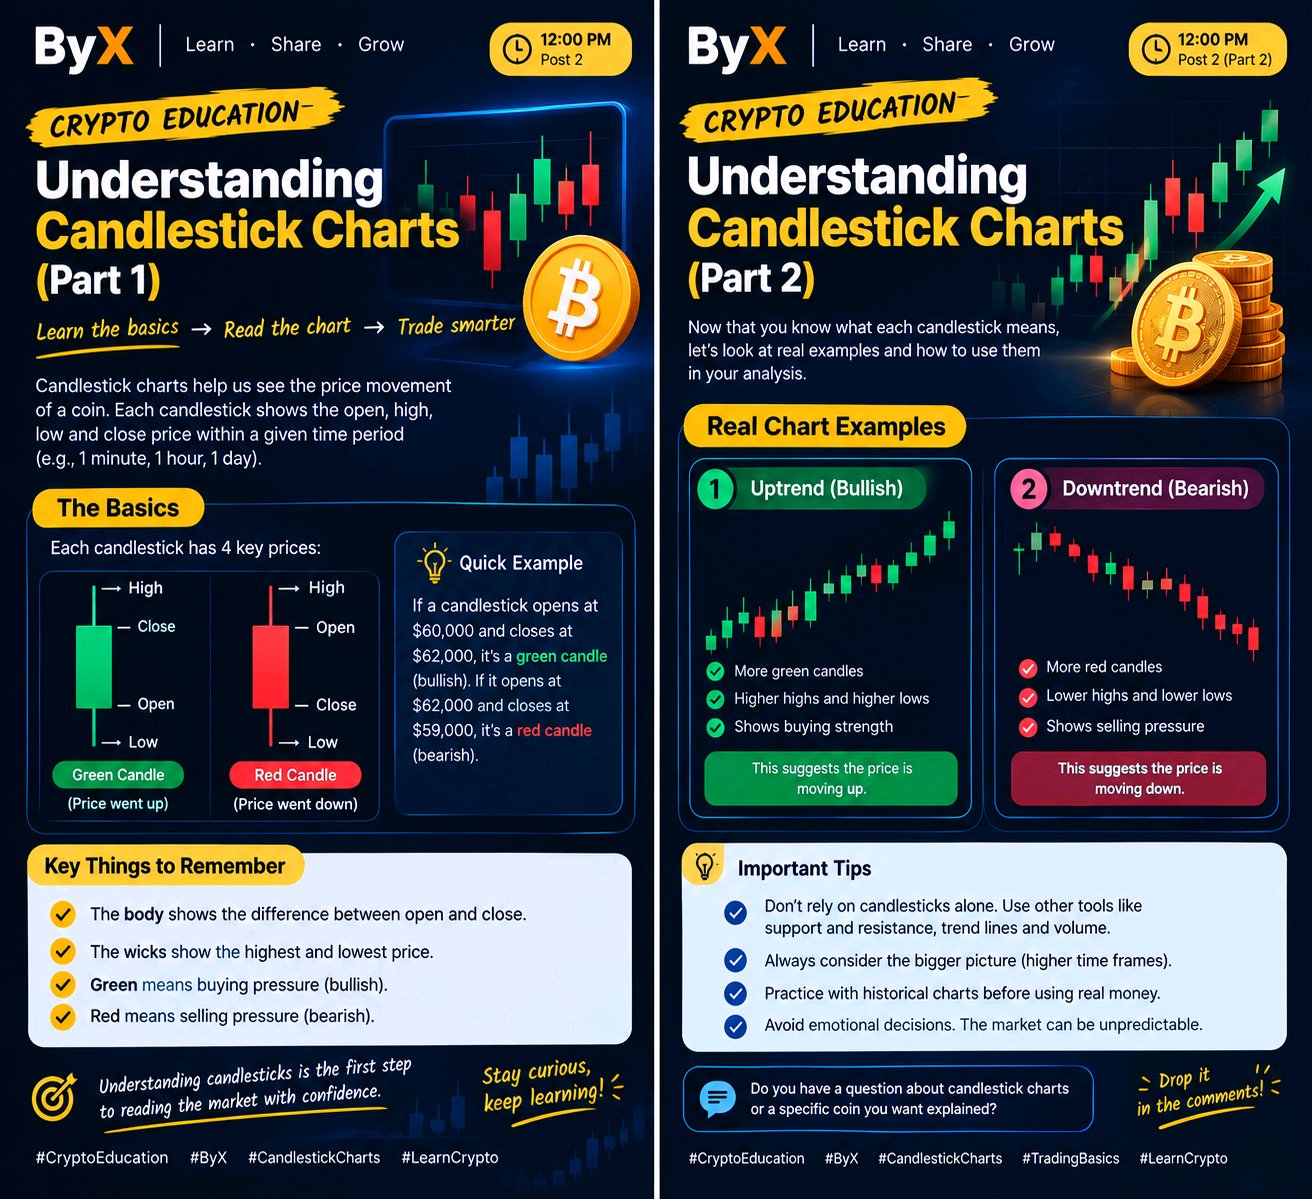
CRYPTO EDUCATION:
$BTCUSDT 📚 CRYPTO EDUCATION: 3 Things Every Beginner Must Know Before Buying Bitcoin! ₿ Are you new to cryptocurrency? Before buying Bitcoin, there are three important things you should understand. 👇 1️⃣ Understand what you are buying. Bitcoin is a digital currency that operates on a decentralized network. Learn how it works instead of buying simply because people are talking about it. 2️⃣ Never invest because of FOMO. FOMO means “Fear of Missing Out.” When you see Bitcoin rising, you may feel pressured to buy immediately. Always research first and avoid emotional decisions. 3️⃣ Protect your money. Cryptocurrency prices can rise or fall sharply. Never invest money you need for food, school fees, rent, or other essential expenses. Never share your wallet recovery phrase with anyone. 💡 Remember: Successful investing starts with knowledge, patience, and risk management—not following every trend. 👇 Let's learn together! What was the first cryptocurrency you ever heard about: Bitcoin, Ethereum, or another coin? Tell us in the comments! 👇 #CryptoEducation #Bitcoin #ByX #CryptoBeginners #RiskManagement #MyByXTake #IMPACTbyTrade #ByXIMPACT

$FIGHTUSDT Here is your FIGHT version in that same pro analyst style: --- *$FIGHT/USDT +3.91% to 0.003935 — This is a failed breakdown snapping back into range, pure V-reversal.* What caught my attention isn't the +3.91% green, it's the structure behind it. Price coiled 0.0030-0.0035 for a month, spiked to ∼0.0047 on 09/26, then flushed hard below all MAs and BOLL - washed to 0.002575 low, tagging BOLL Lower 0.002409. Now ripping vertically today from 0.003736 (24h Low) to 0.004596 (24h High), sitting at 0.003935 above value. The detail that matters most is the reclaim. BOLL(20,2) MID is 0.003323, Upper 0.004237, Lower 0.002409. Price is ABOVE MID now and pushing Upper - reclaiming after being below. MA7: 0.003693, MA14: 0.003314, MA28: 0.003563 - price at 0.003935 is ABOVE all three, MA7>MA28>MA14 flipping bullish. SAR at 0.005540 is still high - downtrend dot not flipped, meaning trend just turned. Order book 56% Buy vs 44% Sell - relatively balanced, not FOMO chasing yet. My read is this is mean-reversion back to range high, not a new uptrend yet. Selling here at 0.003935 near 0.004237 BOLL Upper is taking profit into strength. Buying the vertical is chasing. If price holds above 0.003693 (MA7) and closes above 0.004237 (BOLL Upper), the setup for continuation towards 0.004596 (24h High) then new high becomes attractive. Lose 0.003693, then 0.003563 / 0.003323 (MA28 / BOLL MID) is retest. Structural lines I care about: Capitulation 0.002575-0.002409, base MID 0.003323, trigger cluster 0.003563-0.003693, expansion 0.004237-0.004596. This is a strong V-reversal back into range - watch the BOLL Upper break, don't chase the wick. #MyByXTake #IMPACTbyTrade @ @ @$USDCUSDT

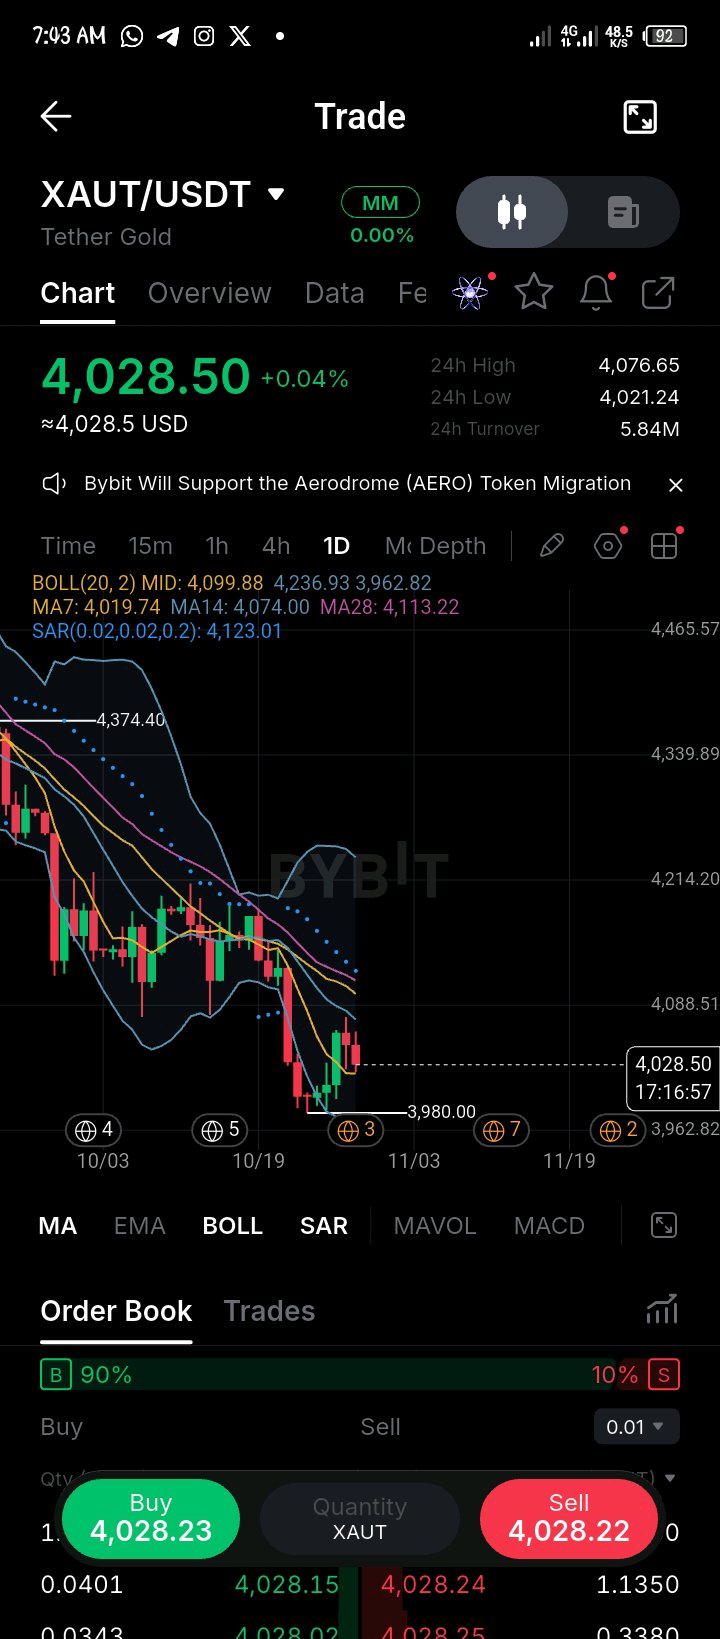
$XAUTUSDT +0.04% to 4,028.50 — This is a downtrend flush holding near BOLL Lower, starting to coil for a base.* What caught my attention isn't the flat +0.04%, it's the structure behind it. Price topped around 4,374.40 near BOLL Upper, then dumped straight down - losing MA7: 4,019.74, MA14: 4,074.00, MA28: 4,113.22 and BOLL MID: 4,099.88. Washed to 3,980.00 low, now sitting at 4,028.50 just above 4,021.24 (24h Low). The detail that matters most is the bear stack holding into the low. BOLL(20,2) MID is 4,099.88, Upper 4,236.93, Lower 3,962.82. Price is BELOW MID and below MA14/MA28 - MA7: 4,019.74 is immediate resistance being tested. MA7 4,019.74 < MA14 4,074.00 < MA28 4,113.22 with price at 4,028.50 trying to hold above MA7 is first sign of stabilization. SAR is high at 4,123.01 - downtrend dot not flipped. Order book 90% Buy vs 10% Sell - heavy bids stacked at bottom, absorbing. My read is this is late-stage downtrend basing after gold flush. Selling at 4,028.50 near 3,962.82-3,980.00 support is selling the low. Buying here is early without reclaim of MID. If price holds above 4,019.74 (MA7) and closes above 4,074.00-4,099.88 (MA14 + BOLL MID), the setup for a mean-reversion long towards 4,076.65 (24h High) then 4,113.22 / 4,236.93 becomes attractive. Lose 4,021.24 / 3,980.00, then 3,962.82 BOLL Lower retest. Structural lines I care about: Capitulation support 3,962.82-3,980.00, immediate 4,019.74, trigger 4,074.00 / 4,099.88, trend flip 4,113.22 / 4,123.01, and expansion 4,236.93. This is weak trend holding near lows - watch the MA7 hold and MID reclaim, don't chase inside the box. #MyByXTake #IMPACTbyTrade $ETHUSDT
$BTCUSDT +0.66% to 81,329.0 — This is a downtrend coil under value, trying to stabilize near BOLL Lower.* What caught my attention isn't the +0.66% green, it's the structure behind it. Price topped around 87,401.9 near BOLL Upper 84,053.4, then rolled over hard - losing MA7: 80,861.0, MA14: 81,608.4, MA28: 82,702.4 and BOLL MID: 81,929.8. Washed from 87k to 80,393.3 (24h Low), now sitting at 81,329.0 just under MID. The detail that matters most is the bear stack still holding. BOLL(20,2) MID is 81,929.8, Upper 84,053.4, Lower 79,806.3. Price is BELOW MID and below MA14/MA28 - MA7 80,861 is immediate support, but 81,608 / 81,929 is resistance box above. MA28 82,702 > MA14 81,608 > MA7 80,861 with price at 81,329 is still weak alignment. SAR is high at 84,464.5 - downtrend dot not flipped. Order book 68% Buy vs 32% Sell - absorption near lower band. My read is this is still corrective coiling, not reversal. Selling at 81,329 near 79,806-80,393 support is selling the flush. Buying here is early without reclaim of MID. If price reclaims and holds above 81,608-81,929 (MA14 + BOLL MID) then closes above 82,702, the setup for a mean-reversion long towards 81,822.4 (24h High) then 84,053.4 (BOLL Upper) becomes attractive. Lose 80,393, then 79,806 BOLL Lower is next, with 74,961.2 swing low below. Structural lines I care about: Base 74,961.2, support 79,806.3-80,393.3, immediate 80,861.0, trigger 81,608.4 / 81,929.8, trend flip 82,702.4 / 84,053.4. This is downtrend holding near lows - watch the MID reclaim, don't long the chop. #MyByXTake #IMPACTbyTrade

$ONDOUSDT +1.05% to 0.4220 — This is a downtrend flush holding near lows, starting to coil for a base.* What caught my attention isn't the +1.05% green, it's the structure behind it. Price topped around 0.6079 near BOLL Upper, rejected hard, then sliced through MA7: 0.4177, MA14: 0.4335, MA28: 0.4597 and BOLL MID: 0.4476. Washed down to 0.3967 low, now sitting at 0.4220 just above 0.4118 (24h Low) and still well below value. The detail that matters most is the bear stack holding into the low. BOLL(20,2) MID is 0.4476, Upper 0.5069, Lower 0.3883. Price is BELOW MID and BELOW MA14/MA28 - MA7: 0.4177 is the only thing price is trying to reclaim. MA28 0.4597 > MA14 0.4335 > MA7 0.4177 with price below - still bearish alignment, but coiling tighter. SAR is high at 0.6079 - downtrend dot not flipped. Order book 92% Buy vs 8% Sell - heavy bid wall at the bottom, buyers absorbing. My read is this is late-stage downtrend basing. Selling at 0.4220 right on top of 0.4118 / 0.3967 support is selling the flush. Buying here is catching a falling knife without a reclaim. If price holds above 0.4177 (MA7) and closes above 0.4335-0.4476 (MA14 + BOLL MID), the setup for a mean-reversion long towards 0.4247 (24h High) then 0.4597 (MA28) becomes attractive. Lose 0.4118 / 0.3967, then 0.3883 BOLL Lower is next. Structural lines I care about: Capitulation support 0.3967-0.3883, immediate support 0.4118, trigger 0.4177 / 0.4335, trend flip 0.4476 / 0.4597, and expansion 0.5069. This is weak trend holding near lows - watch the MA7 reclaim, don't long the chop. #MyByXTake #IMPACTbyTrade $SOLUSDT @

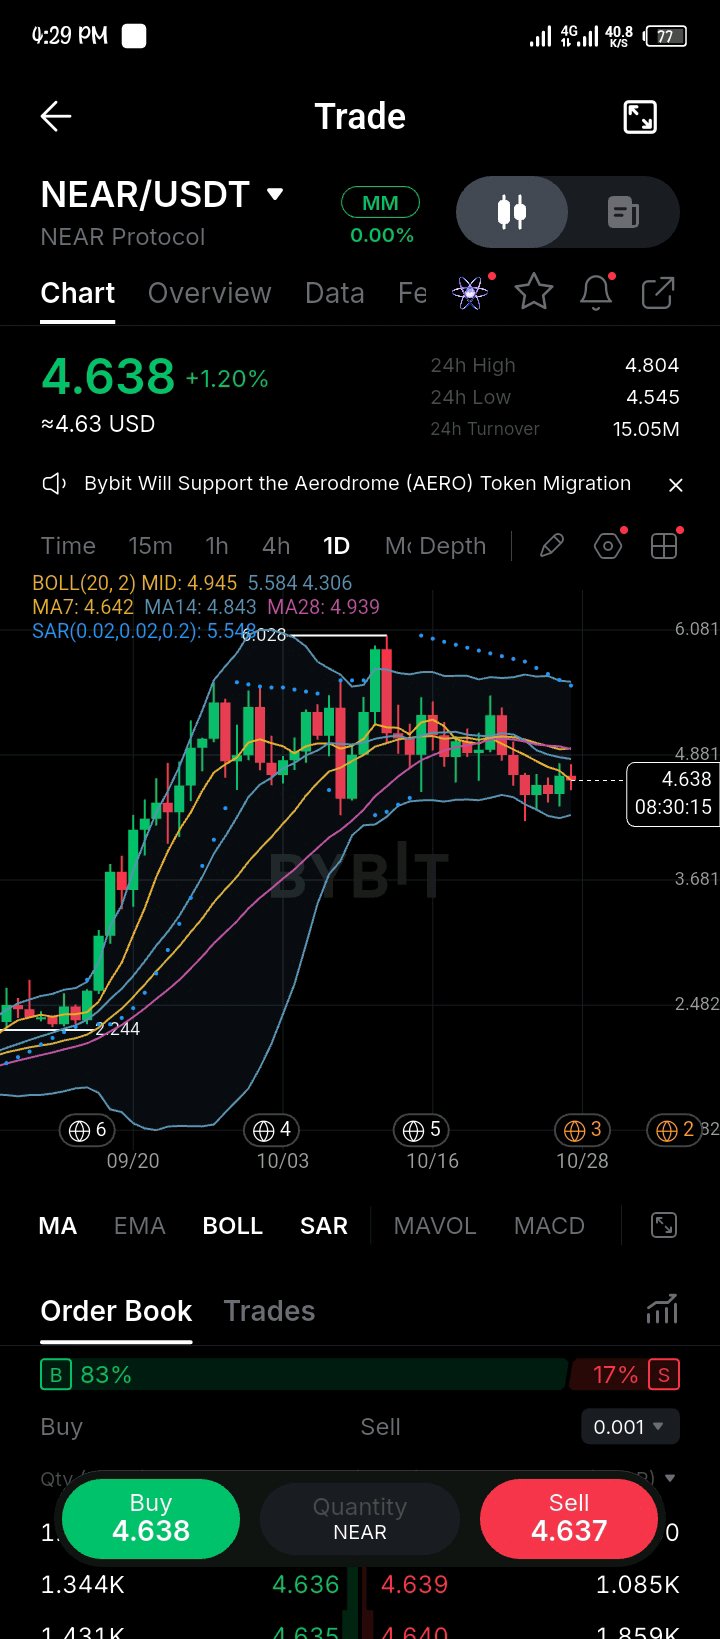
$NEARUSDT +1.20% to 4.638 — This is a downtrend coiling under all MAs, trying to find a base.* What caught my attention isn't the +1.20% green, it's the structure behind it. Price topped around 6.081, made a failed push above BOLL Upper 5.584, then rolled over hard - losing MA7: 4.642, MA14: 4.843, MA28: 4.939 and BOLL MID: 4.945. Washed from 5.5+ down to current 4.638. Now we are sitting just below MA7, chopping sideways since 10/16. The detail that matters most is the bear stack holding. BOLL(20,2) MID is 4.945, Upper 5.584, Lower 4.306. Price is BELOW MID and BELOW all three MAs - MA7 4.642 > 4.638 is still resistance, MA14 4.843 and MA28 4.939 stacked above - textbook downtrend alignment. SAR is high at 5.54 - downtrend dot not flipped. Order book 83% Buy vs 17% Sell - buyers trying to absorb the dip but price not lifting. My read is this is still corrective, not bottomed. Selling at 4.638 near 4.545-4.306 (24h Low / BOLL Lower) is selling the flush. Buying here is early without a reclaim of MA7. If price reclaims and closes above 4.642 (MA7) then 4.843-4.945 (MA14 + BOLL MID), the setup for a mean-reversion long towards 4.804 (24h High) then 4.939 / 5.584 (MA28 / BOLL Upper) becomes attractive. Lose 4.545, then 4.306 BOLL Lower gets retested. Structural lines I care about: Capitulation support 4.306-4.545, immediate resistance 4.642, trend flip 4.843-4.945, and expansion 5.584. This is weak trend coiling below value - watch the 4.642 reclaim, don't long the chop. #MyByXTake #IMPACTbyTrade
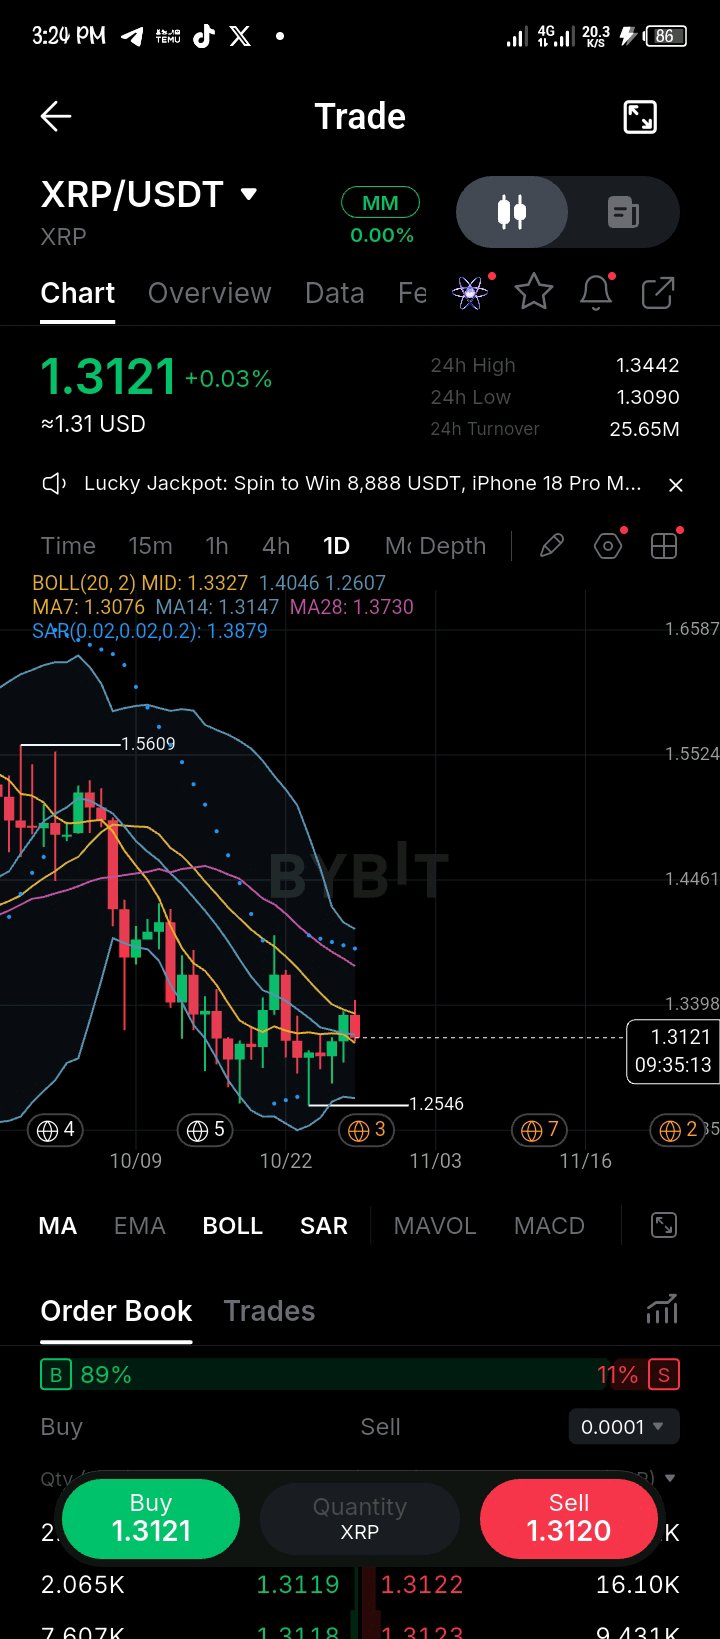
$XRPUSDT +0.03% to 1.3121 — This is a bottom coiling after a trend flush, trying to reclaim the MA cluster.* What caught my attention isn't the flat +0.03%, it's the structure behind it. Price topped around 1.5609 near BOLL Upper, then flushed straight down - losing MA7: 1.3076, MA14: 1.3147, MA28: 1.3730, and BOLL MID: 1.3327, and washed to 1.2546 low, tagging near BOLL Lower at 1.2607. Now we are sitting at 1.3121, chopping back into the MA7/MA14 box after that drop. The detail that matters most is the BOLL + MA compression. BOLL(20,2) MID is 1.3327, Upper 1.4046, Lower 1.2607. Price is still BELOW MID but holding above MA7: 1.3076 - first sign of support reclaim. MA14: 1.3147 is the immediate trigger, MA28: 1.3730 is still way above - bear stack still intact but tightening. SAR is high at 1.3879 - downtrend dot not flipped. Order book 89% Buy vs 11% Sell - heavy absorption on this bottom. My read is this is late-stage downtrend basing, not a breakout. Selling at 1.3121 right above 1.3090 (24h Low) / 1.2607-1.2546 support is terrible risk/reward. Buying here is also early without confirmation above MID. If price holds above 1.3076 (MA7) and closes above 1.3147 / 1.3327 (MA14 + BOLL MID), the setup for a mean-reversion long towards 1.3442 (24h High) then 1.3730 (MA28) and 1.4046 (BOLL Upper) becomes attractive. Lose 1.3090, then 1.2607-1.2546 gets retested. Structural lines I care about: Capitulation support 1.2546-1.2607, immediate support 1.3076, trigger 1.3147 / 1.3327, expansion 1.3730 / 1.4046. This is bottom coiling holding MA7 - watch the BOLL MID reclaim, don't chase inside the box. #MyByXTake #IMPACTbyTrade $USDCUSDT @
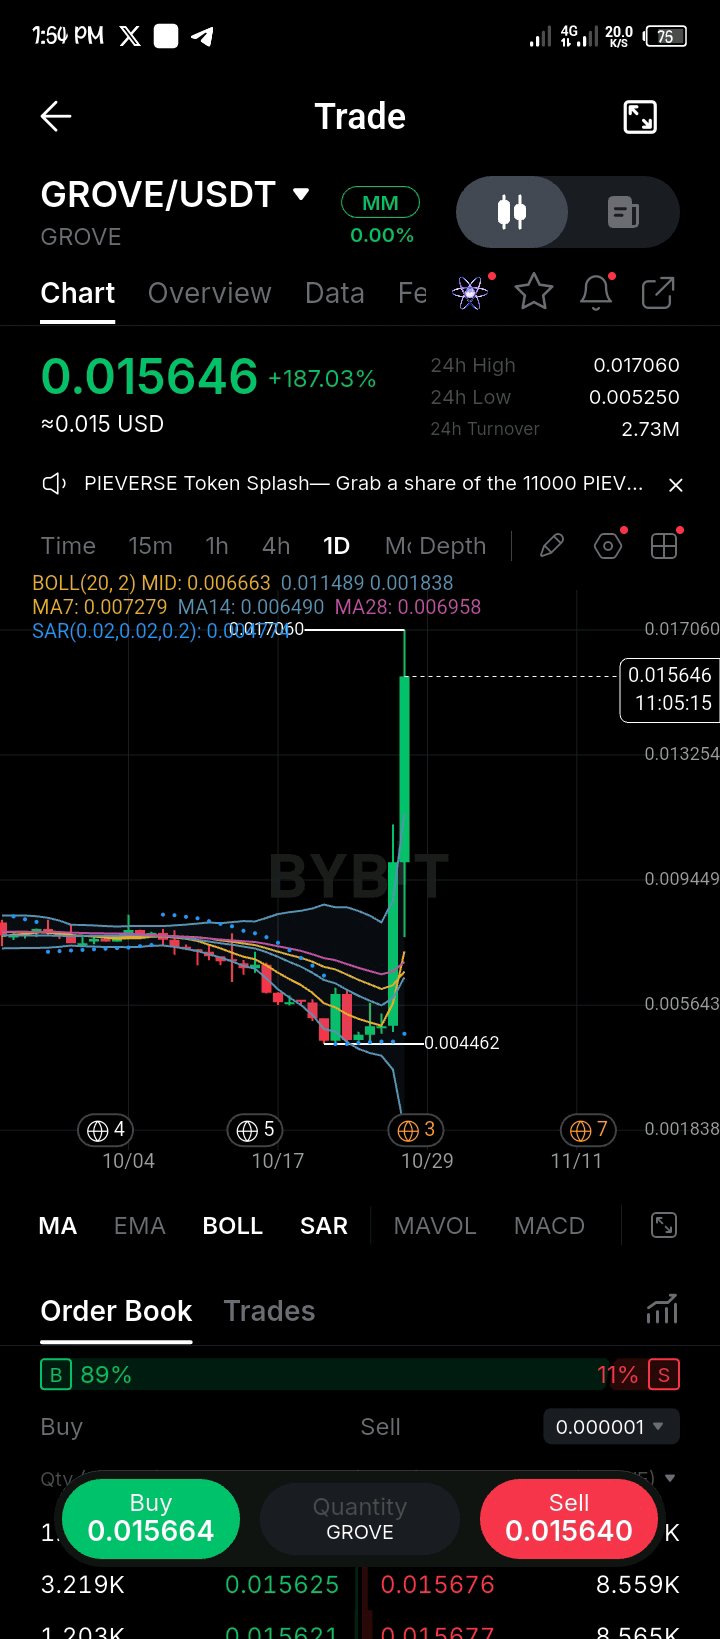
$GROVEUSDT +187.03% to 0.015646 — This is a pure short-squeeze vertical, textbook blow-off after weeks of dead chop.* What caught my attention isn't the +187% green, it's the structure behind it. Price sat dead around 0.004462 - 0.0069 for a month, compressing inside BOLL 0.001838 - 0.011489 with MA7: 0.007279, MA14: 0.006490, MA28: 0.006958 all tangled - absolute coil. Then today it ripped vertically from 0.005250 (24h Low) straight to 0.017060 (24h High), now sitting at 0.015646 way ABOVE BOLL Upper at 0.011489. The detail that matters most is the distance from mean. BOLL(20,2) MID is 0.006663, Upper 0.011489, Lower 0.001838. Price is +135% above MID and outside the band - extreme extension. MAs are miles below: 0.006490-0.007279 cluster. That is not a trend, that's an expansion wick. SAR is at 0.001705 - long ago flipped, irrelevant here. Order book 89% Buy vs 11% Sell - breakout chasing, not accumulation. My read is this is a momentum blow-off, not a buy setup. Selling here into strength is locking the move, buying 0.015646 at the top of a +187% vertical above BOLL Upper is worst risk/reward possible. This will mean-revert hard. If price holds above 0.011489 (BOLL Upper) on daily close, then 0.017060 breakout holds for continuation. If it closes back inside 0.011489, the setup for a fade back to 0.006663 (BOLL MID) / 0.007279 (MA7) becomes attractive. Chasing now is FOMO. Structural lines I care about: Squeeze base 0.004462-0.006958, breakout trigger 0.011489, intraday top 0.017060, and mean-reversion magnet at 0.006663. This is vertical expansion - take profits, don't chase the wick. #MyByXTake #IMPACTbyTrade $BTCUSDT
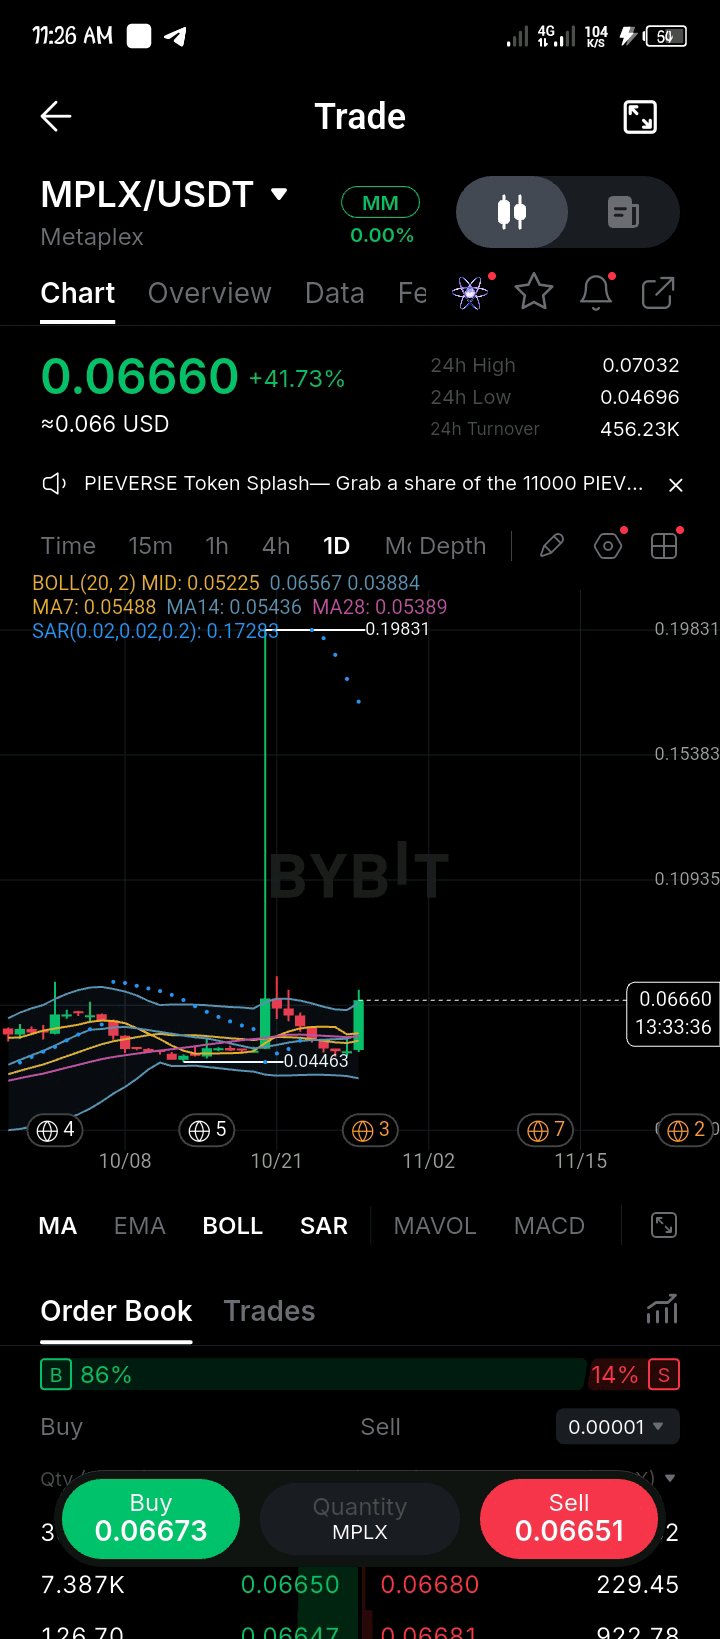
$MPLXUSDT $MPLX/USDT +41.73% to 0.06660 — This is a post-squeeze expansion, buyers finally took control of a dead range.* What caught my attention isn't the +41% green candle, it's the structure behind it. Price based dead for weeks around 0.04463, chopping inside BOLL 0.03884-0.06567, with MA7: 0.05488, MA14: 0.05436, MA28: 0.05389 all flattened together - pure compression. Then a vertical wick on 10/21, rejected, then re-coiled, and now today it's printing 0.06660 and tagging BOLL Upper at 0.06567 and breaking it. The detail that matters most is the MA compression + BOLL breakout. BOLL(20,2) MID is 0.05225, Upper 0.06567, Lower 0.03884. All three MAs are stacked bullish and tight: 0.05389 < 0.05436 < 0.05488 - textbook squeeze. Price is now ABOVE all of them and ABOVE BOLL Upper. That's expansion. SAR is still high at 0.17201 - old downtrend dot, will flip on confirmation. Order book: 86% Buy vs 14% Sell - breakout bids are stacked. My read is this is the breakout leg of that month-long coil. Selling at 0.06660 into momentum is okay for scalps, but chasing long at the top of a +41% wick that is already above 0.07032 (24h High) / 0.06567 (BOLL Upper) is bad risk/reward. You buy pullbacks, not the wick. If price holds above 0.06567 (BOLL Upper) and then above 0.05488 (MA7 cluster) on a retest, the setup for a continuation long towards 0.07032 then open sky becomes attractive. If it fails back inside 0.06567, it's a bull trap back to 0.05225 MID. Structural lines I care about: Squeeze base 0.04463-0.05389, breakout trigger 0.06567, intraday high 0.07032, and mean-reversion support at 0.05225 (BOLL MID). This is not a top to short, it's expansion - wait for the hold above 0.06567 before committing. #MyByXTake #IMPACTbyTrade
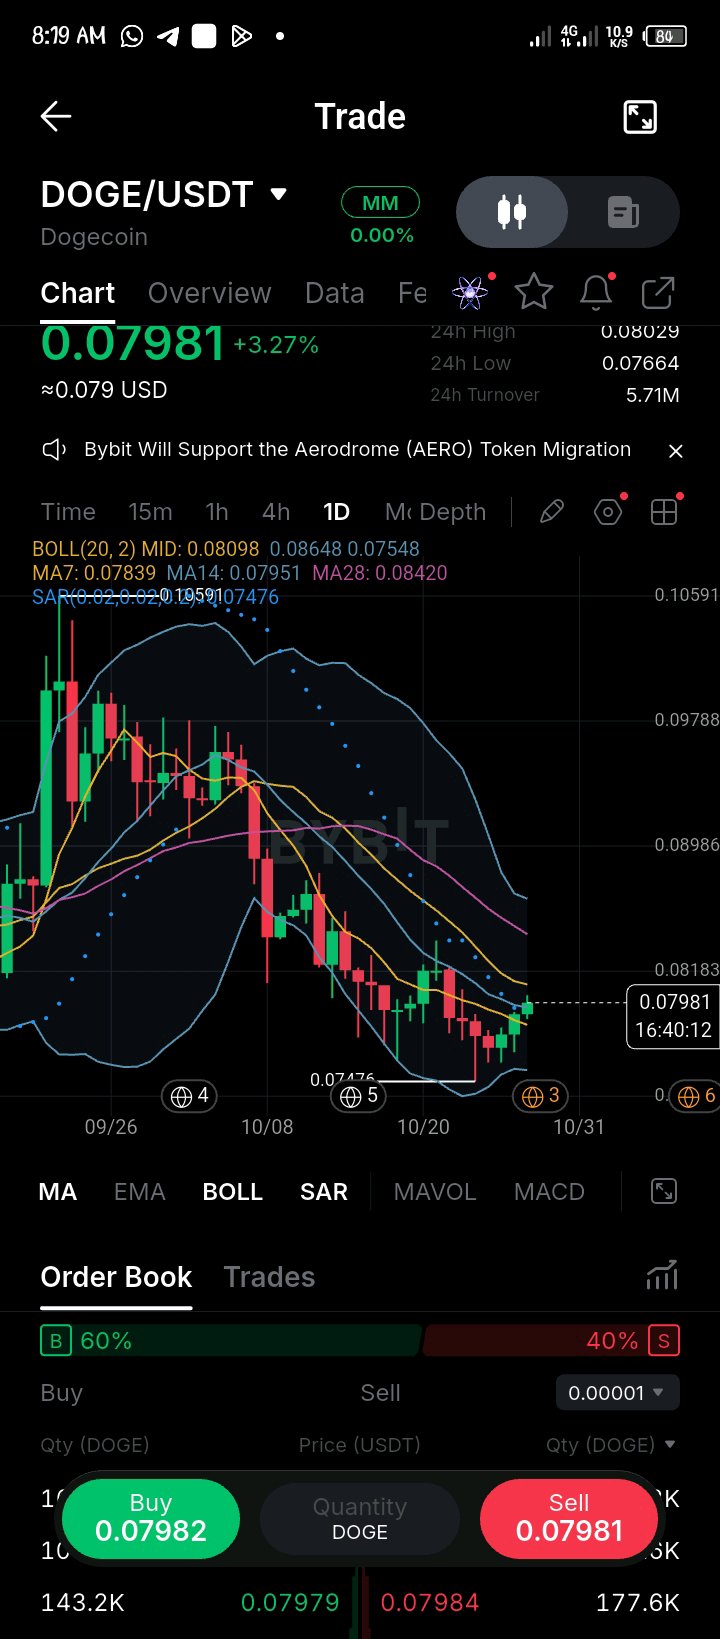
$DOGEUSDT +3.27% to 0.07981 — This is a low-range grind after a trend flush, with a reclaim attempt underway.* What caught my attention isn't the +3% green, it's the structure behind it. Price topped around 0.109+ near the BOLL Upper, then rolled over hard - losing MA7: 0.07839, MA14: 0.07951, and MA28: 0.08420, and washing down to 0.07476 low, right on BOLL Lower at 0.07548. Now we are sitting at 0.07981, trying to coil back inside the band after that flush. The detail that matters most is the BOLL + MA bear compression. BOLL(20,2) MID is 0.08098, Upper 0.08648, Lower 0.07548. Price is still BELOW MID but reclaiming. MA7: 0.07839 is now support, MA14: 0.07951 is the immediate trigger, MA28: 0.08420 is the trend flip. Stack is still bearish - MA7 < MA14 < MA28 - but flattening. SAR is high at 0.10747 - downtrend dot not flipped. Order book: 60% Buy vs 40% Sell - buyers are bidding the bottom, not chasing. My read is this is a late-stage downtrend base, not a breakout yet. Selling at 0.07981 into 0.07548-0.07664 support is terrible risk/reward. Buying here is early without a reclaim of MID. If price holds above 0.07839 (MA7) and closes above 0.07951-0.08098 (MA14 + BOLL MID), the setup for a mean-reversion long towards 0.08029 (24h High) then 0.08420 (MA28) and 0.08648 (BOLL Upper) becomes attractive. Lose 0.07548, then 0.07476 gets retested. Structural lines I care about: Capitulation support 0.07476-0.07548, immediate support 0.07839, trigger 0.07951 / 0.08098, expansion 0.08420 / 0.08648. This is bottom coiling - watch the BOLL MID reclaim, don't chase inside the range. #MyByXTake #IMPACTbyTrade
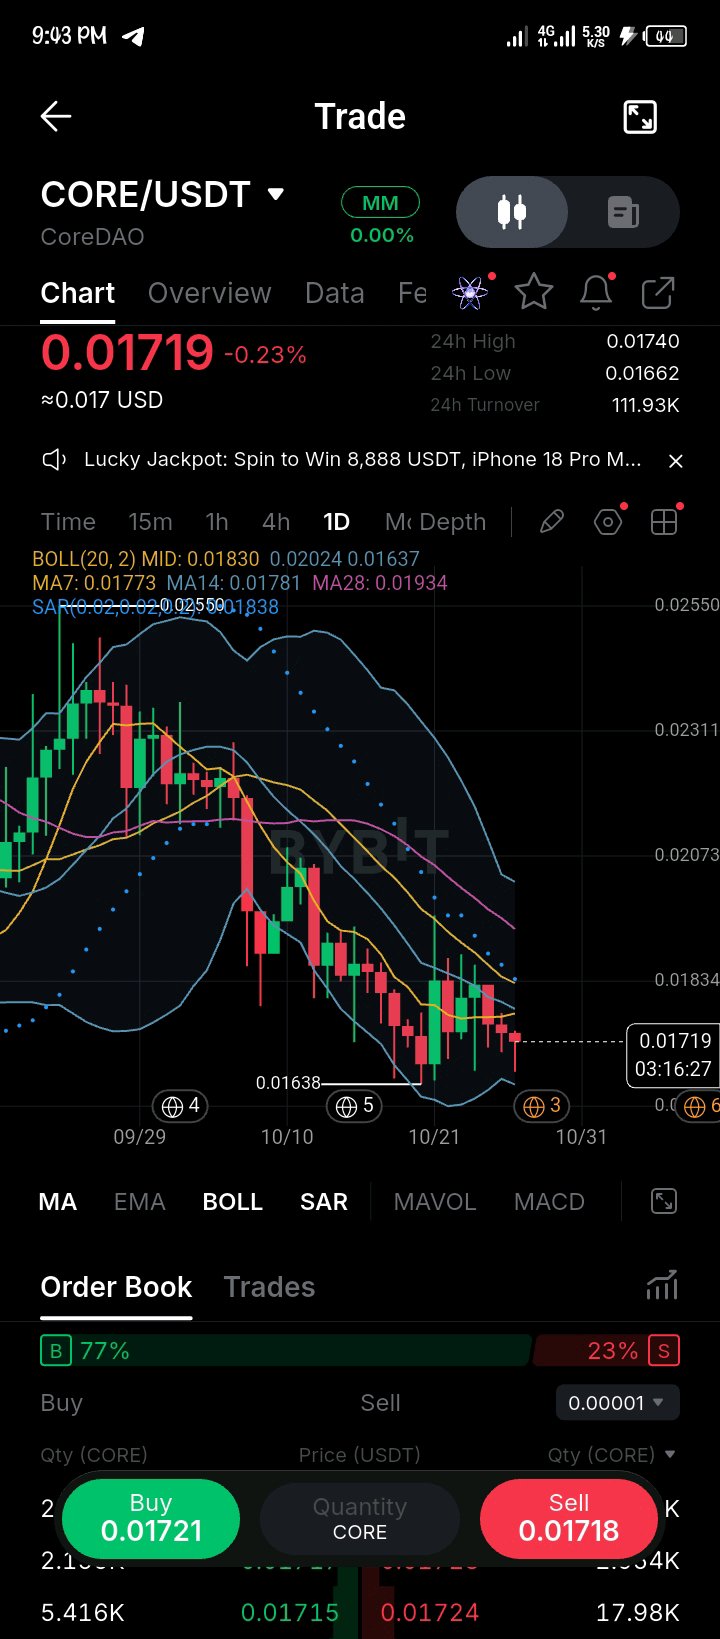
$COREUSDT 0.23% to 0.01719 — This is a bottoming grind after a full trend flush, not a reversal yet.* What caught my attention isn't the -0.23% red, it's the structure behind it. Price topped around 0.02550+, rejected off the BOLL Upper at 0.02024, then went into a clean downtrend - slicing MA7: 0.01773, MA14: 0.01781, and MA28: 0.01934 one by one. Then a capitulation wick straight down to 0.01638 low, tagging BOLL Lower at 0.01637. Now we are sitting at 0.01719, chopping just above that low. The detail that matters most is the BOLL + MA bear stack. BOLL(20,2) MID is 0.01830, Upper 0.02024, Lower 0.01637. Price is BELOW MID and BELOW all three MAs - MA7 0.01773 > MA14 0.01781 < MA28 0.01934, price still below them. That is still a bearish alignment, but the distance to Lower band is closing. SAR is high at 0.02559 - downtrend still technically intact. Order book: 77% Buy vs 23% Sell - buyers are trying to absorb at the bottom. My read is this is late-stage downtrend basing. Selling at 0.01719 right on top of 0.01637-0.01662 support is selling the flush. Buying here is catching a falling knife without confirmation. If price holds above 0.01637 (BOLL Lower / 0.01662 24h Low) and reclaims 0.01773-0.01781 (MA7/MA14 cluster) with a daily close, the setup for a mean-reversion long towards 0.01830 (BOLL MID) then 0.01934 (MA28) becomes attractive. Lose 0.01637, then it stays in free-fall discovery. Structural lines I care about: Capitulation support 0.01637-0.01662, immediate resistance 0.01773-0.01781, trend flip at 0.01830 / 0.01934, and daily high resistance at 0.01740 then 0.02024. This is weak trend holding near lows - watch the MA7 reclaim, don't long the chop. #MyByXTake #IMPACTbyTrade $USDCUSDT
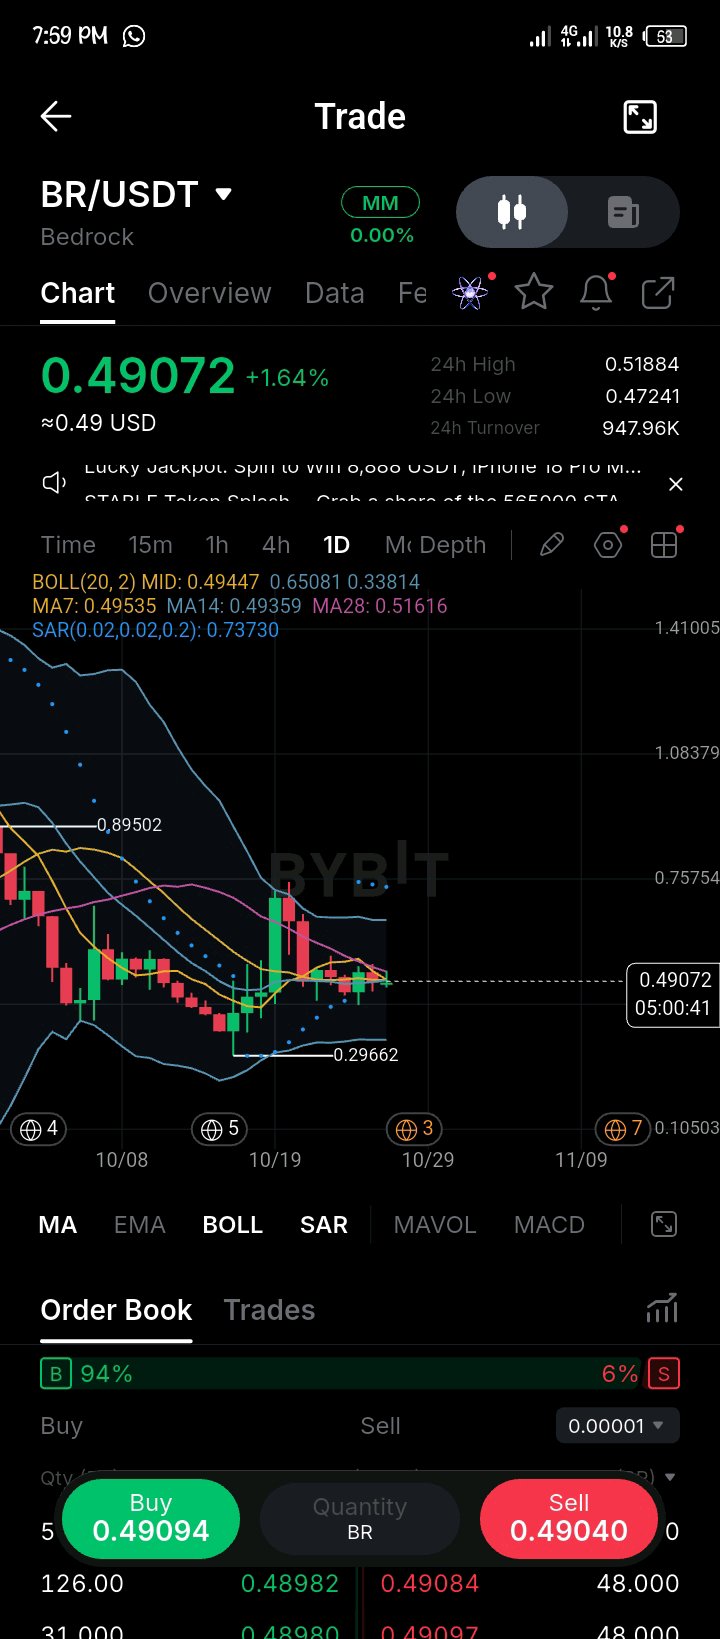
$BRUSDT +1.64% to 0.49072 — This is a bottoming coil after a 50%+ flush, with buyers stacking hard.* What caught my attention isn't the +1% green, it's the structure behind it. Price topped at 0.89502, collapsed straight down to 0.29662 low - that is a full capitulation leg, losing BOLL MID: 0.49447 and all MAs. Then it based around 0.47241 (24h Low) and ripped back to 0.51884 (24h High). Now we are sitting at 0.49072, chopping right inside the MA7/MA14 cluster. The detail that matters most is the compression. BOLL(20,2) MID 0.49447, Upper 0.65081, Lower 0.33814 - wide bands after that drop. MA7: 0.49535, MA14: 0.49359, MA28: 0.51616. Price is sandwiched: holding MA14 but below MA7 and MA28. That is a neutral-to-bearish coil tightening. SAR is still high at 0.73730 - downtrend dot not flipped yet. Order book is telling: 94% Buy vs 6% Sell - heavy bid support on this bottom. My read is this is a potential bottom formation, not a breakout. Selling at 0.49072 here after a -50% flush into support is terrible risk/reward. Buying here is also early - you need the reclaim. If price holds above 0.49359-0.49535 (MA14/MA7) and reclaims 0.51616 (MA28) with a daily close, the setup for a mean-reversion long towards 0.51884 then 0.65081 (BOLL Upper) becomes attractive. Lose 0.47241, then 0.29662 support gets retested. Structural lines I care about: Capitulation support 0.29662-0.33814, immediate box 0.47241-0.51884, trigger 0.49535 / 0.51616, expansion 0.65081. #MyByXTake #IMPACTbyTrade
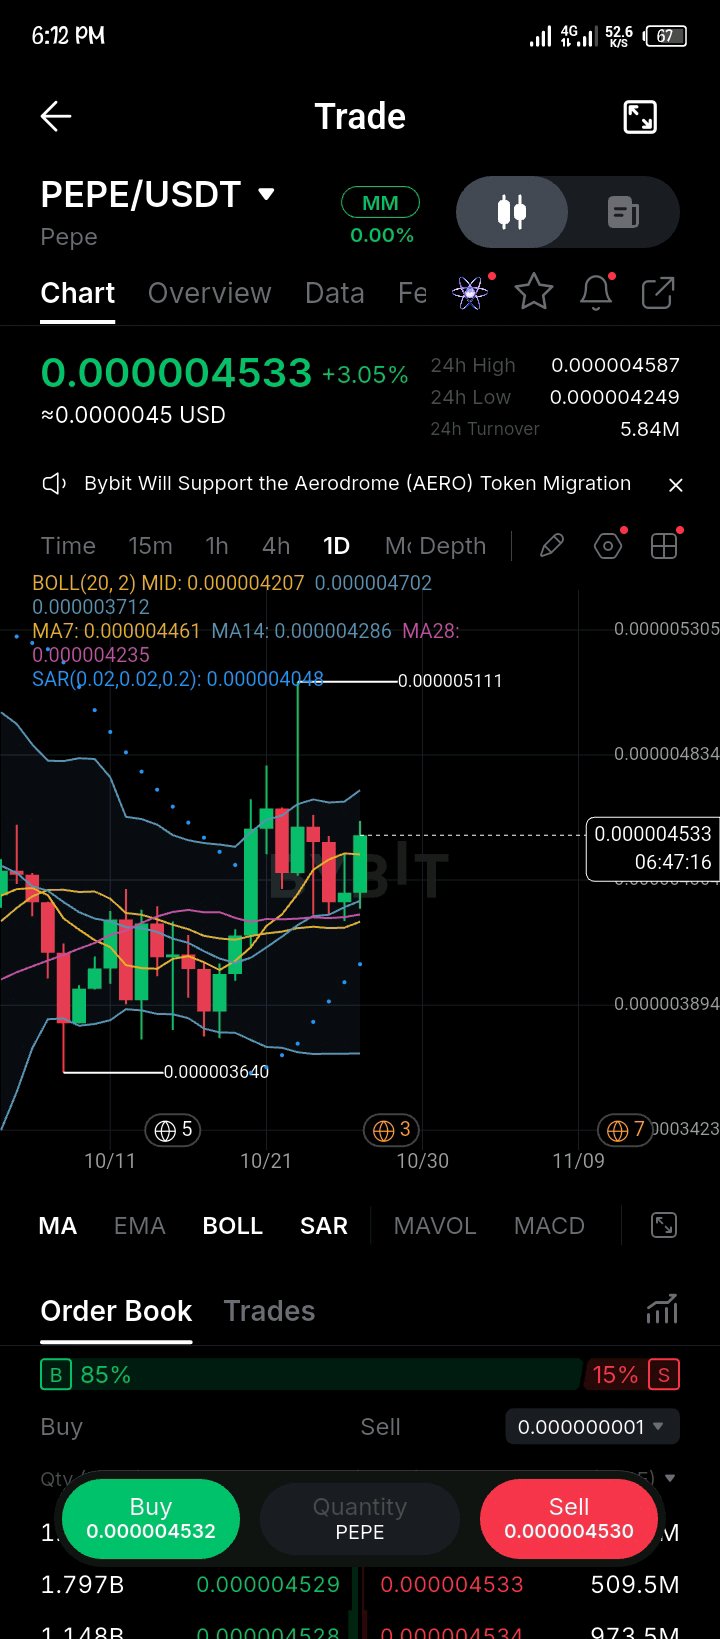
$PEPEUSDT +3.05% to 0.000004533 — This is a coil after a liquidation wick, not a breakout yet.* What caught my attention isn't the +3% green, it's the structure behind it. Price flushed hard to 0.000003640 low, based around the BOLL Lower at 0.000003712, then ripped vertically to 0.000005111 wick high - pure stop-hunt + short squeeze. After that blow-off, it chopped back into the MA cluster and now we are sitting at 0.000004533, right above MA7: 0.000004461 and BOLL MID: 0.000004207. The detail that matters most is the MA + BOLL alignment. BOLL(20,2) MID is 0.000004207, Upper 0.000004702, Lower 0.000003712. MA7: 0.000004461, MA14: 0.000004286, MA28: 0.000004235. Price is now ABOVE all three MAs with MA7 leading - bullish stack forming. SAR is at 0.000004048 sitting below price - trend support still intact. Order book is heavy: 85% Buy vs 15% Sell, buyers defending the coil. My read is this is a consolidation after expansion with a bullish lean, but chasing at 0.000004533 right under 0.000004702 (BOLL Upper) and 0.000004587 (24h High) is bad risk/reward. A stop would need to sit below 0.000004286 just to survive chop. If price holds above 0.000004461 and breaks 0.000004587-0.000004702 with volume, the setup for a continuation long towards 0.000005111 becomes attractive. Buying right here in the middle of the box is FOMO. The structural lines I care about: Support at 0.000004235-0.000004286 (MA14/MA28 cluster) and 0.000004207 (BOLL MID), trigger at 0.000004587 / 0.000004702, and expansion target at 0.000005111. #MyByXTake #IMPACTbyTrade $MNTUSDT
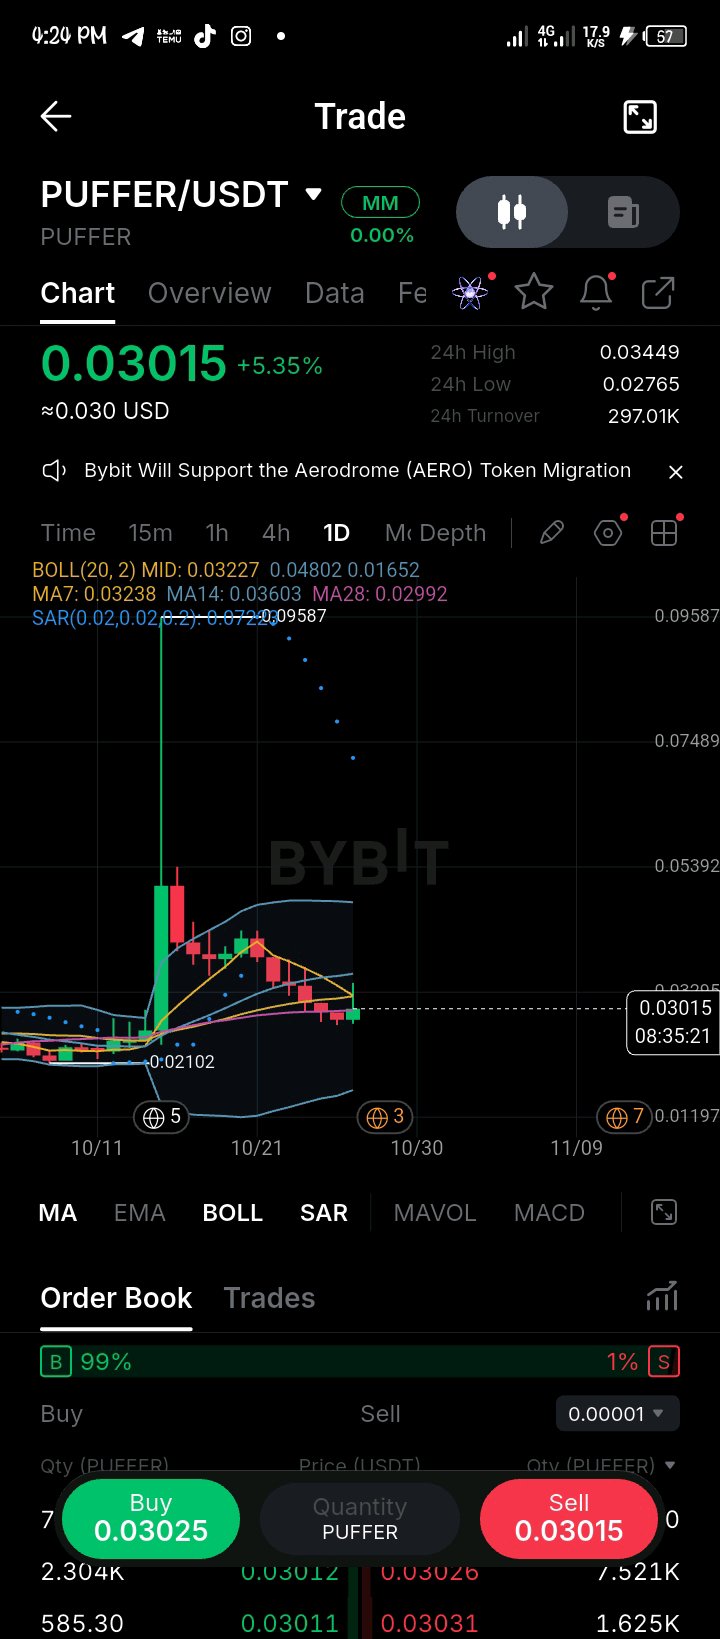
$PUFFERUSDT just printed +5.35% into 0.03015, and that BOLL compression is the real story.* What caught my attention isn't the size of the green candle itself, it's the structure behind it. Price based forever around 0.02102, exploded vertically to 0.09587, rejected hard, and then went into a slow bleed - chopping below 0.04802 (BOLL Upper), losing 0.03603 (MA14) and 0.03238 (MA7). Now we're sitting at 0.03015, right on the edge of the MA28 at 0.02992 after weeks of compression. The detail that matters most to me is the BOLL + MA squeeze. BOLL(20,2) MID is at 0.03227, Upper at 0.04802, Lower at 0.01652. That is a WIDE band - high volatility history. Price is now squeezed between MA28: 0.02992 and MA7: 0.03238. MA14 is still overhead at 0.03603 - bearish stack but flattening. Order book is insane: 99% Buy vs 1% Sell, buyers are accumulating this squeeze while price is still cheap. My read is this is a late-stage consolidation after a blow-off top, with a coiling setup. Selling at 0.03015 here is selling the bottom of the squeeze. Buying at 0.03015 is also early - you need the breakout confirmation. If price holds above 0.02992 (MA28) and reclaims 0.03227-0.03238 with a daily close, the setup for a mean-reversion long towards 0.03603 (MA14) and 0.04802 (BOLL Upper) becomes attractive. If it loses 0.02992, it goes back to the 0.02102-0.02765 range. The structural lines I care about: Deep support at 0.02102-0.02765 (24h Low), coil trigger at 0.02992, breakout trigger at 0.03227-0.03238, and expansion target at 0.03449 (24h High) then 0.04802. #MyByXTake #IMPACTbyTrade $BTCUSDT
$HUMAUSDT just printed a savage +48.82% V-reversal into 0.02655, and that wick from 0.01754 is the whole story.* What caught my attention isn't the size of the green candle itself, it's the structure behind it. Price ran hard up to 0.03647 high, topped, then went into a brutal bleed - losing the MA cluster one by one, slicing below 0.02910 (BOLL MID), and capitulating straight down to the 0.01754 low in a single long red wick. That is pure stop-hunt / liquidation flush. Now we're sitting at 0.02655, reclaiming back above the flush low in one impulse candle. The detail that matters most to me is the reclaim + MA confluence. BOLL(20,2) MID is at 0.02910, Upper at 0.03633, Lower at 0.02188. Price is now trying to reclaim 0.02557 (MA7) after being miles below it. MA14: 0.02743, MA28: 0.03013. The stack is still bearish - MA7 below MA14 below MA28 - but the velocity of this bounce is what matters. Order book is 60% Buy vs 40% Sell - buyers are stepping in on the dip, not chasing the top. My read is this is a post-capitulation, high-risk reversal attempt, not a clean uptrend yet. Buying at 0.02655 right under 0.02743-0.02910 resistance is a terrible risk/reward. A stop would need to sit below 0.02188 just to survive normal volatility after a flush like that. If price holds above 0.02557 and prints a daily close above 0.02743 with a rejection wick on the retest, the setup for a mean-reversion long towards 0.02910-0.03013 becomes attractive. Buying right here at the middle of a V without confirmation is FOMO on a dead-cat. The structural lines I care about: Capitulation low at 0.01754, immediate support at 0.02188 (BOLL Lower) / 0.02557 (MA7), reclaim trigger at 0.02743, and trend shift at 0.02910-0.03013. Hold above 0.02910, then the downtrend is broken. Lose 0.02188, then that 0.01754 gets retested. #MyByXTake #IMPACTbyTrade

$VERONAUSDT just printed a massive +17.04% reclaim into the 0.12635 high, and that 99% buy order book is the detail everyone will miss.* What caught my attention isn't the size of the green candle itself, it's the structure behind it. Price chopped flat for weeks around the 0.11 shelf, flushed down to the 0.10122 low, based around 0.09956 (BOLL Lower), and then went vertical - blasting through 0.11179 (MA28) and tagging the 24h High at 0.15927 in a single expansion leg. Now we're sitting at 0.12635, holding ABOVE the entire MA + BOLL cluster after that run. The detail that matters most to me is the BOLL + MA breakout. BOLL(20,2) MID is at 0.11037, Upper at 0.12118, Lower at 0.09956. Price is now sitting ABOVE the upper band - that is expansion mode. And the MAs: MA7: 0.11108, MA14: 0.10999, MA28: 0.11179. Price is ABOVE all three, with MA7 curling up through MA28 - bullish alignment. Order book is extreme: 99% Buy vs 1% Sell. That is not retail FOMO, that is aggressive bid stacking. My read is this is a post-consolidation breakout with a strong bullish lean, but chasing at 0.12635 right under 0.15927 resistance is a terrible risk/reward. A stop would need to sit below 0.12118 just to survive normal volatility. If price holds above 0.12118 (BOLL Upper) with a rejection wick, the setup for a continuation long towards 0.15927 becomes attractive. Buying right here at the top of the wick without confirmation is FOMO. The structural lines I care about: Daily support at 0.11037 (BOLL MID) and 0.11108 (MA7), breakout trigger at 0.12118, and the extension target at 0.15927 (24h High). Hold above 0.12118 on daily close, momentum continues. Lose 0.11108, it's back to the 0.11 chop box. #MyByXTake #IMPACTbyTrade
