Merry
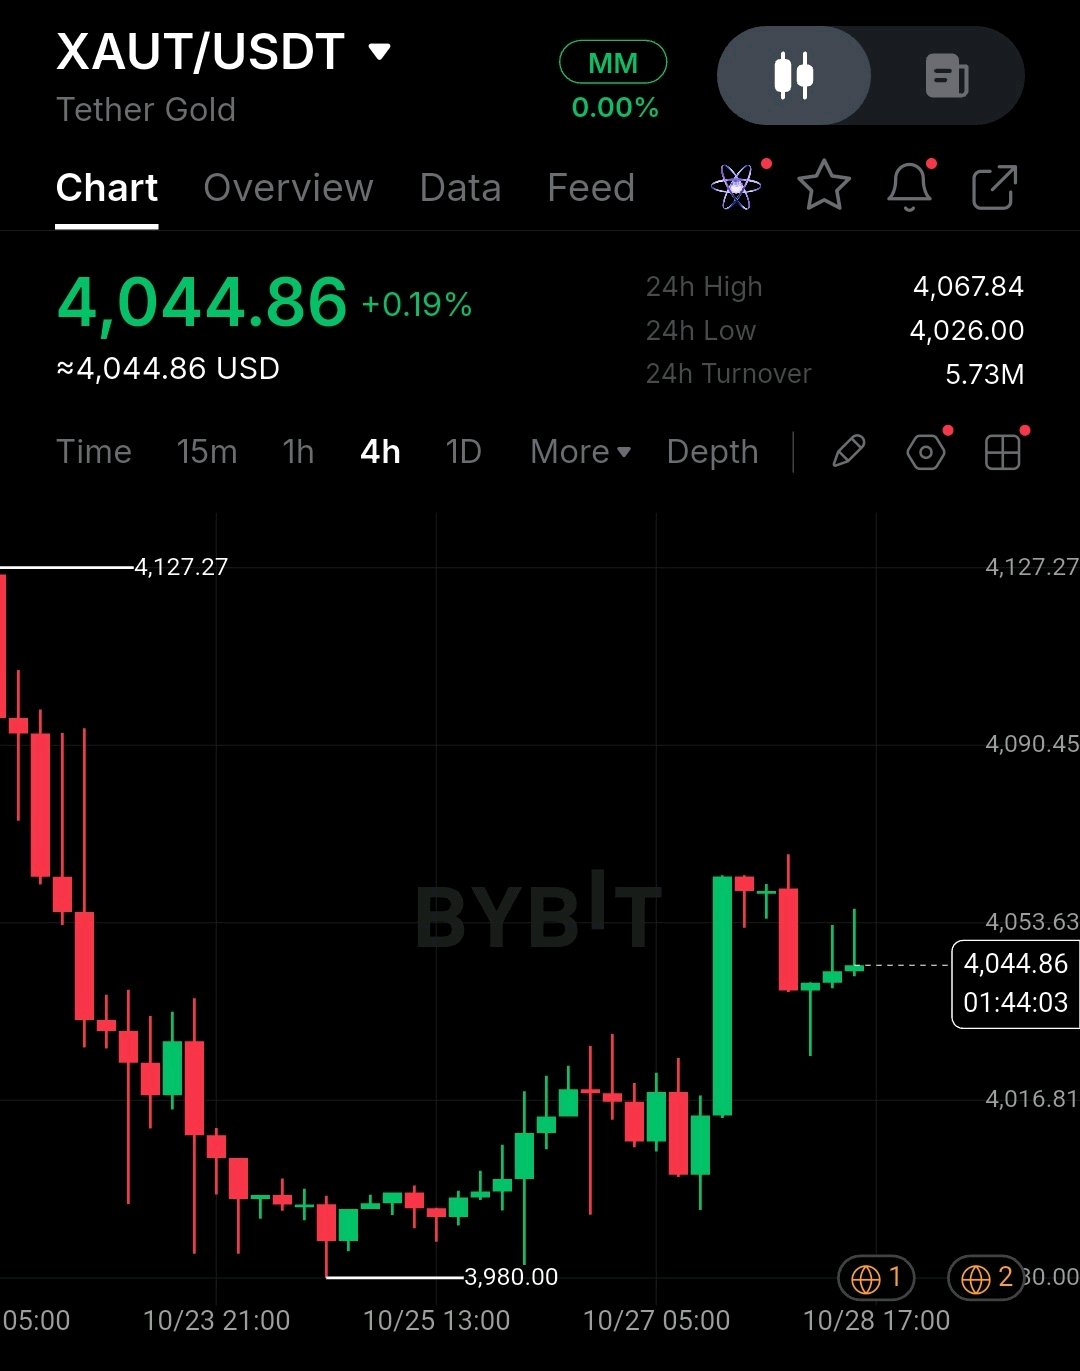
XAUTUSDT at 4,044.86, +0.19% today.
Gold took a beating from the 4,127.27 area, bottomed out at 3,980.00, then snapped back with one big green 4H candle. Since that spike, it's mostly been drifting sideways just under 4,053. What I'm seeing No moving averages on this chart, so I'm going off price action alone. The slide from 4,127.27 is the bigger story, but 3,980.00 has held and the recovery has been orderly. The recent candles are small with wicks poking both ways, which looks like the market pausing after a sharp move rather than committing to a direction. Volume and momentum MACD and RSI aren't showing. What stands out is that sellers keep capping pushes near 4,067 while buyers step in around 4,026. 24h turnover is 5.73M, which is light, so I'd be skeptical of any breakout that doesn't come with a real jump in volume. Levels on my radar Above: - 4,053.63 - 4,067.84 (24h high) - 4,090.45 - 4,127.27 (the swing high) Below: - 4,026.00 (24h low) - 4,016.81 - 3,980.00 (the swing low) How I'd approach it Long: wait for a 4H close above 4,067.84 with volume behind it. First target 4,090.45, then 4,127.27. Stop goes under 4,026.00. Short: a 4H close below 4,026.00 brings 4,016.81 into play, with 3,980.00 as the next stop on the way down. Between 4,026 and 4,067, I'm staying out. It's a tight box, and I'd rather wait for a candle to close outside it than guess which way it breaks. What would change my mind A close under 3,980.00 wipes out the bounce and puts sellers back in charge. A close above 4,127.27 would flip the bigger picture bullish. With volume this thin, moves can overshoot fast, so keep size modest and trust closes over wicks. Not financial advice. DYOR. $XAUTUSDT #MyByXTake #ByXIMPACT
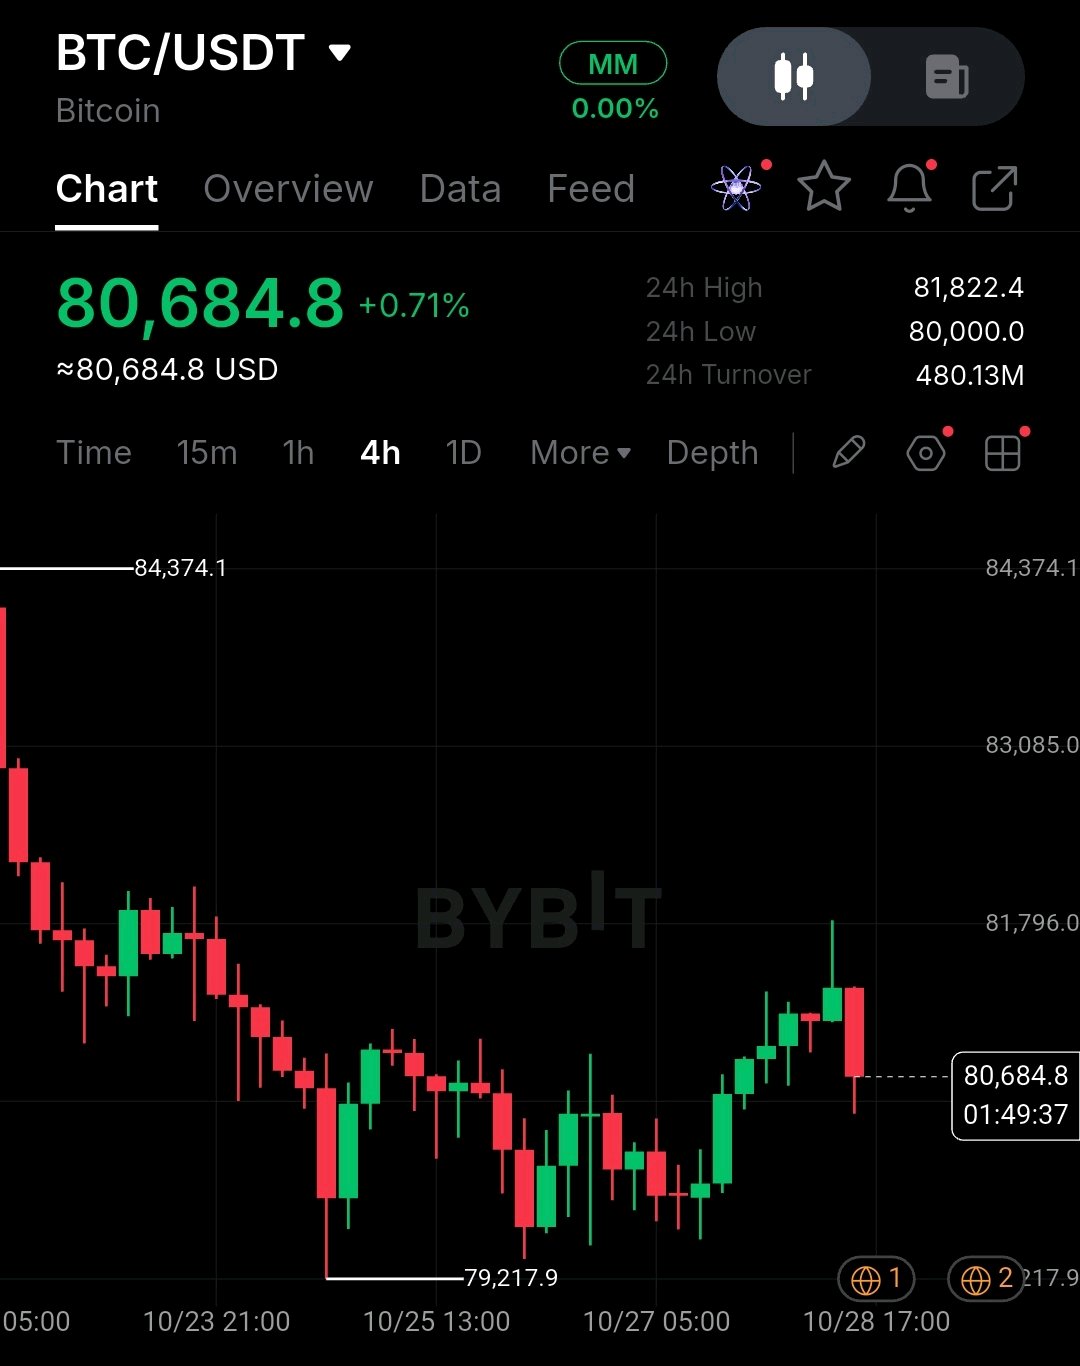
BTCUSDT at 80,684.8, +0.71% today.
Bitcoin has spent the last few sessions grinding off the 84,374.1 area, bottomed at 79,217.9, and is now trying to claw back. It poked up to 81,800 and got sold right away, and the 4H candle that's open now is red. Where we are No moving averages on this screenshot, so this is a pure price-action read. The bigger picture is still lower highs stepping down from 84,374.1. But since the 79,217.9 low, the dips have been getting shallower, and that's the first hint sellers are running out of steam. It looks like a base forming, not a reversal yet. Volume and momentum MACD and RSI aren't on the chart. What I can see is that wick near 81,800 getting rejected fast, so buyers haven't shown real conviction up there. 24h turnover is 480.13M, which is solid, but the tape feels balanced rather than directional. I'd want a close above resistance with volume expanding before trusting any trend change. Levels on my radar Above: - 81,822.4 (24h high) - 83,085.0 - 84,374.1 (the swing high that started the slide) Below: - 80,000.0 (24h low and a big round number) - 79,217.9 (swing low) How I'd approach it Long: wait for a 4H close above 81,822.4 with real volume behind it. First stop on the way up is 83,085.0, then 84,374.1. Invalidation sits under 80,000. Short: a 4H close below 80,000 puts 79,217.9 back in play, and a close under that opens the door to another leg down. Between 80,000 and 81,822 I'm happy to sit on my hands. It's a tight box, and the edge only appears once price closes outside it. What would prove me wrong A close under 79,217.9 kills the higher-low base and hands control back to the downtrend. A close above 84,374.1 flips the whole structure bullish. BTC loves to whip around round numbers like 80k, so keep size modest and trust closes over wicks. Not financial advice. DYOR. $BTCUSDT #ByXIMPACT #BybitStocks #MyByXTake
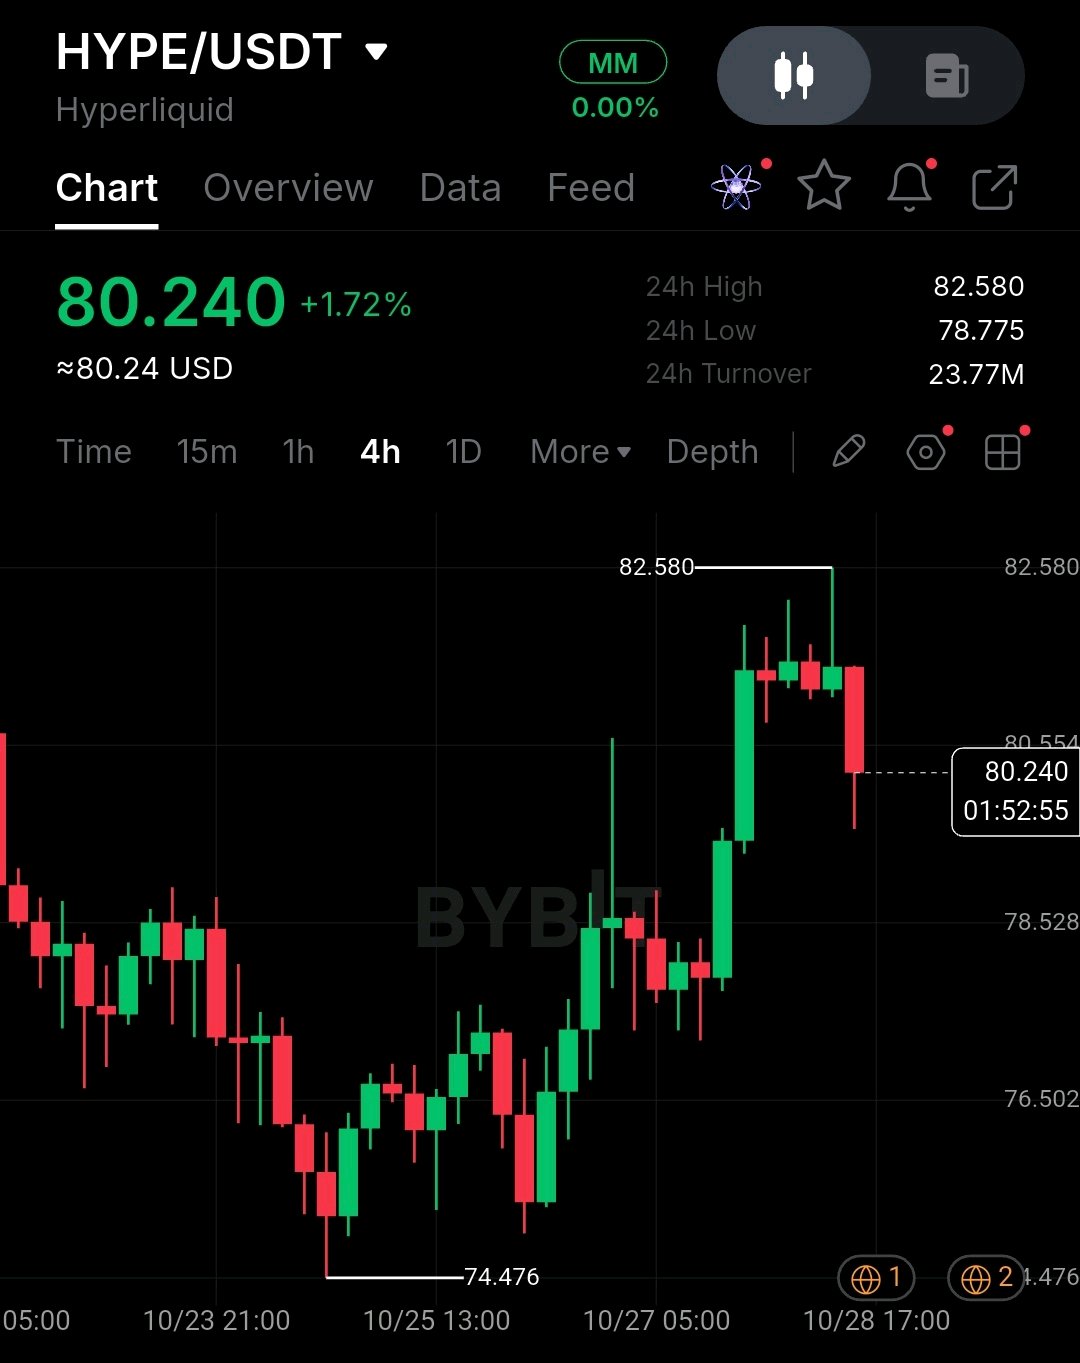
HYPEUSDT at 80.240, +1.72% on the day.
$HYPEUSDT bounced hard from the 74.476 low and ran straight into 82.580, where it got rejected fast. Now it's giving some of that move back, and the current 4H candle is red and still open. What the chart is saying There are no moving averages on this screenshot, so I'm reading raw price action. The structure since 74.476 is clean: higher lows, one big impulse leg, then a stall. The last few candles up top are small with long wicks, which tells me buyers got tired near 82. The trend is still up, but it's catching its breath. Volume and momentum No MACD or RSI visible here either. 24h turnover is 23.77M, which is decent but nothing explosive. For a real breakout I'd want to see volume pick up on the push, not just price drifting higher. Levels I'm watching Above: - 80.554 - 82.580 (24h high and the rejection point) Below: - 78.775 (24h low) - 78.528 - 76.502 - 74.476 (the swing low that started it all) How I'd play it Long: wait for a 4H close above 82.580 with volume behind it. There's nothing overhead on this chart, so I'd trail it rather than set a fixed target. Stop goes under 78.775. Short: a 4H close below 78.775 puts 76.502 in play first, then 74.476. Anywhere between 78.775 and 82.580 I'm flat. It's chop with no real edge, and I'd rather let the candle close than guess. What would change my mind A close under 78.775 weakens the higher-low structure, and losing 76.502 would put the whole run in question. After a move this fast, pullbacks can get sharp, so keep size reasonable and trade off closes, not wicks. Not financial advice. DYOR. #ByXIMPACT #BybitStocks
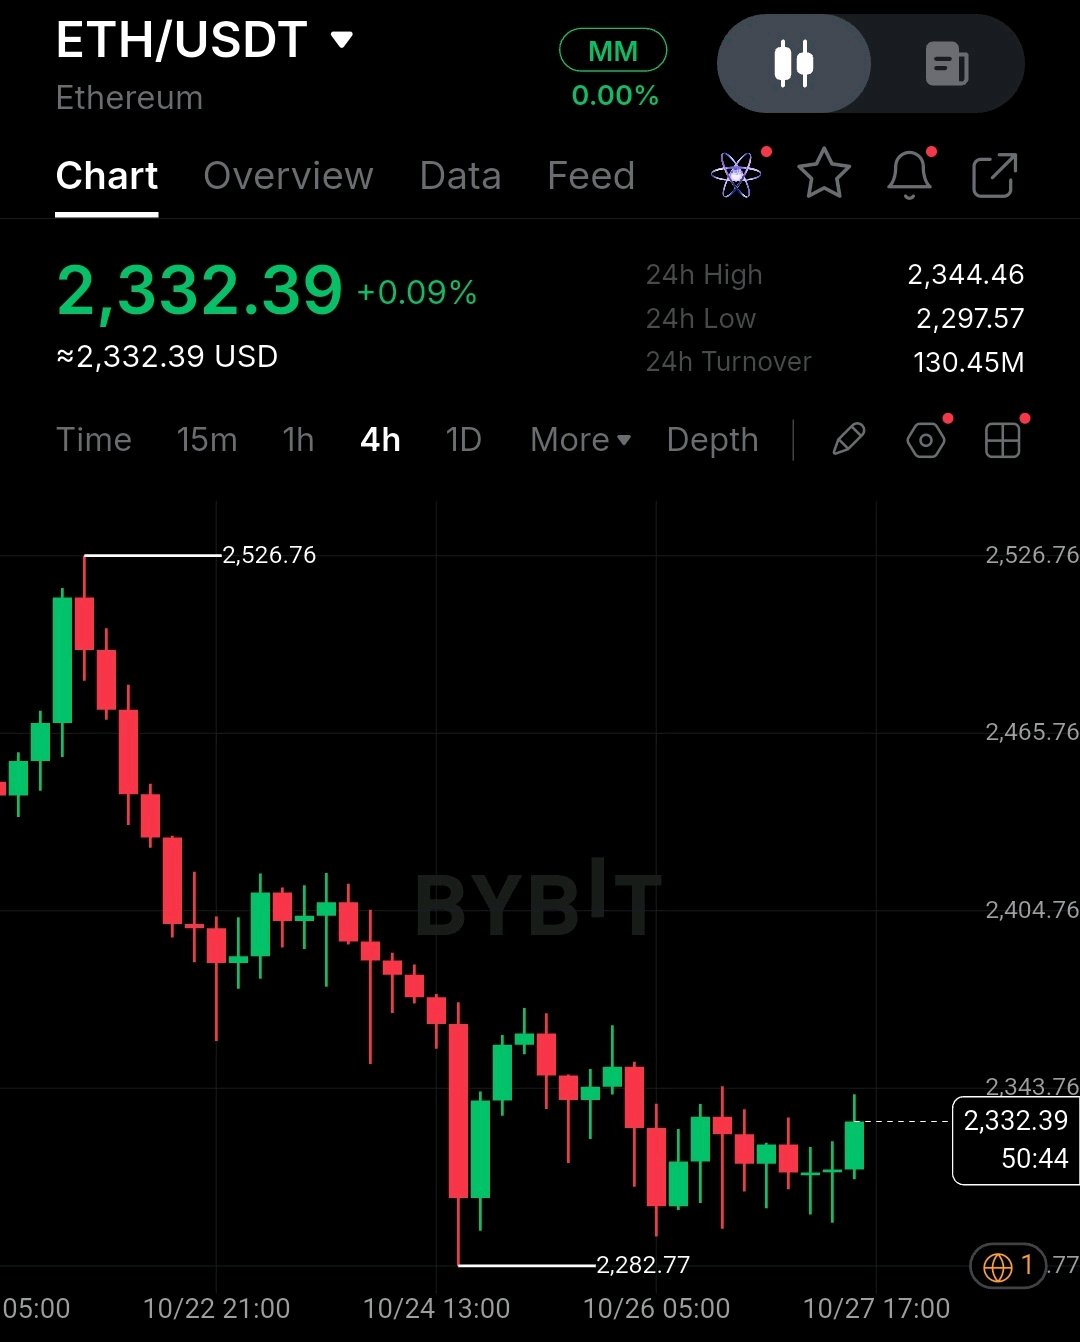
$ETHUSDT is still under pressure, trading around 2,324.31 after dipping to 2,291.02. Price is down 1.32% today, and I'm watching this area closely because the next move could tell us whether buyers are ready to step in or sellers still have control. Since hitting 2,777.83, ETH has been making its way lower, with lower highs and lower lows defining the trend. Buyers tried to push it back toward 2,529.14, but the recovery didn't last. Selling pressure returned, and price dropped to a fresh 24-hour low of 2,291.02. Now we're consolidating just above that low. The question is whether this support holds or gives way to another leg down. The RSI readings aren't showing much strength yet: - 6-period RSI: 42.17 - 12-period RSI: 40.54 - 24-period RSI: 41.88 All three are sitting in the low 40s. Momentum remains weak, but ETH isn't deeply oversold either. That leaves the market in an awkward spot: shorting here means selling close to potential support, while buying means going against a downtrend that hasn't formed a higher low. Personally, I'd rather wait for price to show its hand than rush into either side. The Levels That Matter 2,291.02 is the level I'm watching first. If ETH breaks below this 24-hour low and fails to reclaim it, the next area of interest is the 2,280.46 demand zone. But if buyers defend this area and price forms a clear rejection wick, a relief bounce toward 2,404.80 could be possible. Even if that bounce develops, I'd still treat it as a counter-trend trade until the market gives stronger evidence of a reversal. My Long Setup I'm watching the 2,290–2,320 zone for a potential entry, with invalidation at 2,270. My targets are: - TP1: 2,357.00 - TP2: 2,404.80 - TP3: 2,529.14 if momentum continues. Using 2,305 as the entry midpoint, the risk is around 25 points. The first target offers approximately a 1:2.1 risk-to-reward ratio, which is reasonable. The setup looks more attractive at 2,404.80, where the potential ratio improves to roughly 1:4.0. That's the move I'd be more interested in, provided buyers can maintain enough momentum to support it. The invalidation at 2,270 is important. If ETH drops below that level and can't recover, I'd leave the long idea alone rather than try to catch a deeper sell-off. What Could Change My Outlook? If ETH reclaims 2,404.80 and holds above it, I'd start taking the possibility of a genuine reversal more seriously. From there, 2,529.14 becomes the next upside target. On the bearish side, a break below 2,270 without a successful reclaim would keep sellers in control. I'd then look for potential short opportunities on a retest of 2,380. For now, I'm staying patient. ETH is close to support, but the overall trend remains weak, and I don't want to mistake a small bounce for a change in direction. I'd rather wait for confirmation than force a trade just because price is sitting near the lows. What's your take on ETHUSDT? Are you looking to buy this dip for a quick bounce, or waiting for a stronger reclaim before entering? #ByXIMPACT #BybitStocks
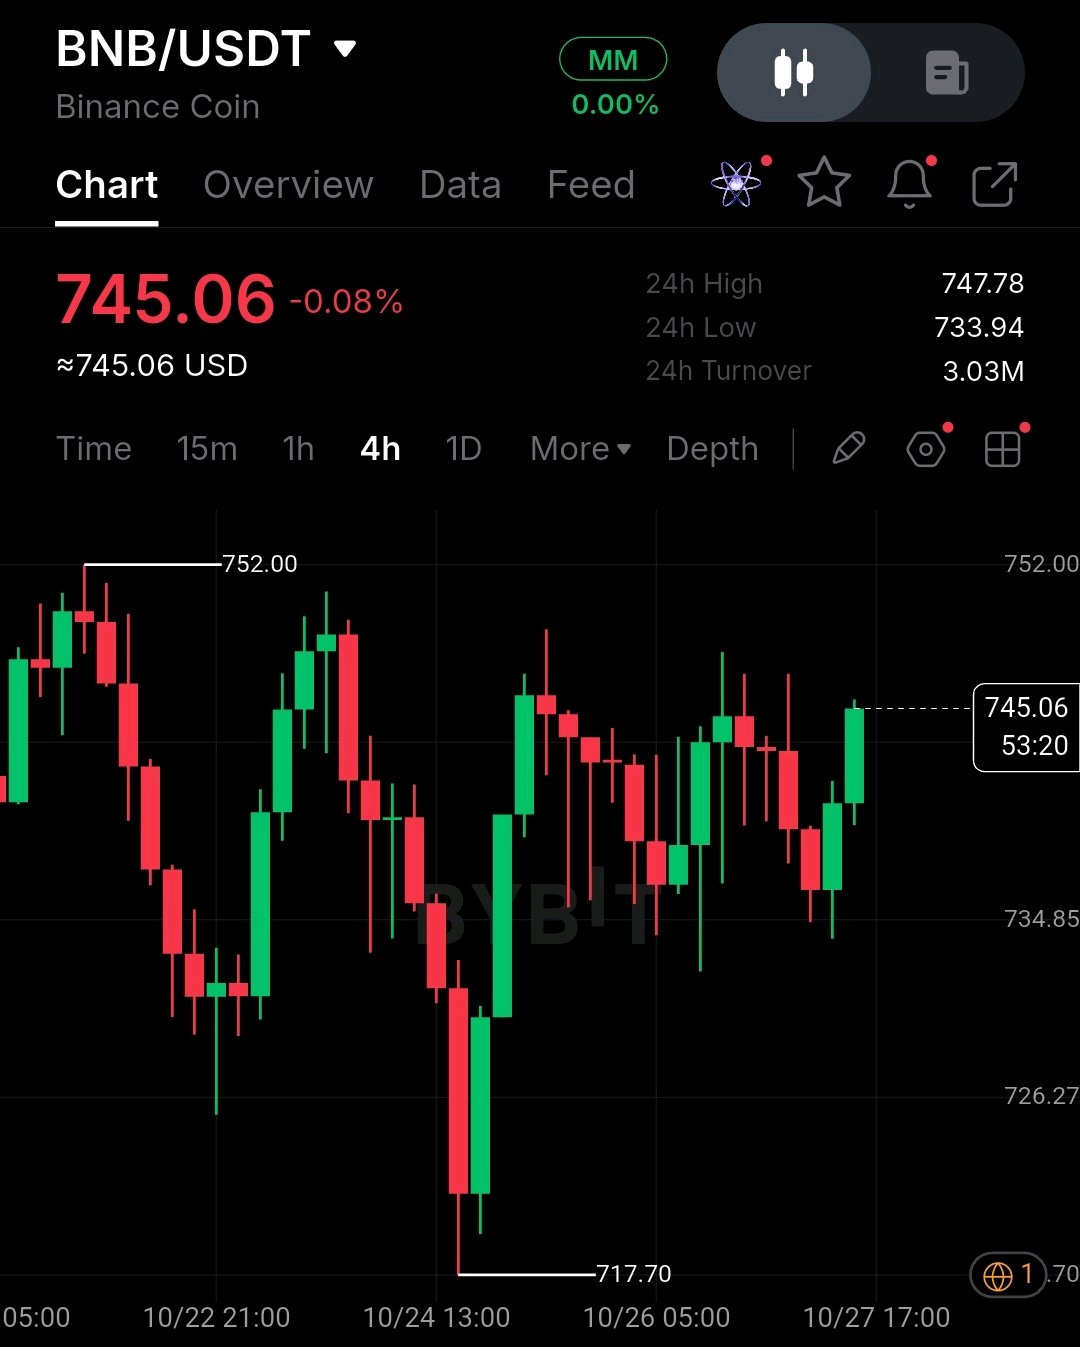
$BNBUSDT is starting to look interesting again after bouncing from 705.02 and climbing back to 745.08. Price is up +0.42% today, but what I'm paying attention to isn't the daily gain. It's the way the market has been behaving since that sharp sell-off from 810.00. Instead of continuing to make lower lows, BNB has started forming higher lows and slowly working its way back toward the upper end of the range. That's a positive sign for buyers, although there's still resistance ahead that needs to be cleared before I'd get too confident. The RSI readings are supporting the recovery so far: - 6-period RSI: 65.12 - 12-period RSI: 57.90 - 24-period RSI: 54.59 What I like here is that momentum is improving across all three periods without becoming excessively stretched. The short-term RSI is leading the move, while the higher-period readings are also holding above neutral. For now, the recovery looks healthy, but price still needs to prove it can push through resistance. Here's What I'm Watching BNB is approaching the 24-hour high at 747.38, which is the immediate resistance level. Below the current price, 731.72 is the support area I want to see buyers defend. With price already sitting at 745.08, buying right here feels a little rushed. I'd rather see BNB break above 747.38 and hold that level before considering a continuation trade. If the recovery starts to fade, 731.72 becomes the level to watch. A 4H candle close below it would weaken the current structure and could send price back toward the 705.02 demand zone. My Long Setup I'm watching the 732.00–740.00 entry zone, with invalidation at 725.00. My targets are: - TP1: 747.38 - TP2: 757.51 - TP3: 783.75 if momentum continues. Using 736.00 as the entry midpoint, the risk is around 11 points. The first target offers approximately a 1:1.0 risk-to-reward ratio, which isn't enough to interest me on its own. At 757.51, the ratio improves to roughly 1:1.9, which is better but still fairly modest. The more attractive scenario is a move toward 783.75, offering an estimated 1:4.3 reward-to-risk ratio. That's where the trade starts to look more worthwhile, assuming buyers can maintain control. What Would Change My Outlook? If BNB closes a 4H candle above 757.51, I'd take the bullish continuation scenario more seriously and look for a retest before entering. If price instead breaks below 725.00 and fails to reclaim it, I'd step away from the long idea and turn my attention toward the 705.02 demand zone. For now, I'm cautiously bullish. The higher lows and improving RSI are encouraging, but I don't want to confuse a recovery with a confirmed breakout. I'd rather let price show its hand than buy directly into resistance and hope for the best. What's your take on BNBUSDT? Are you entering near resistance, or waiting for a breakout and retest before making a move? #ByXIMPACT #BybitStocks
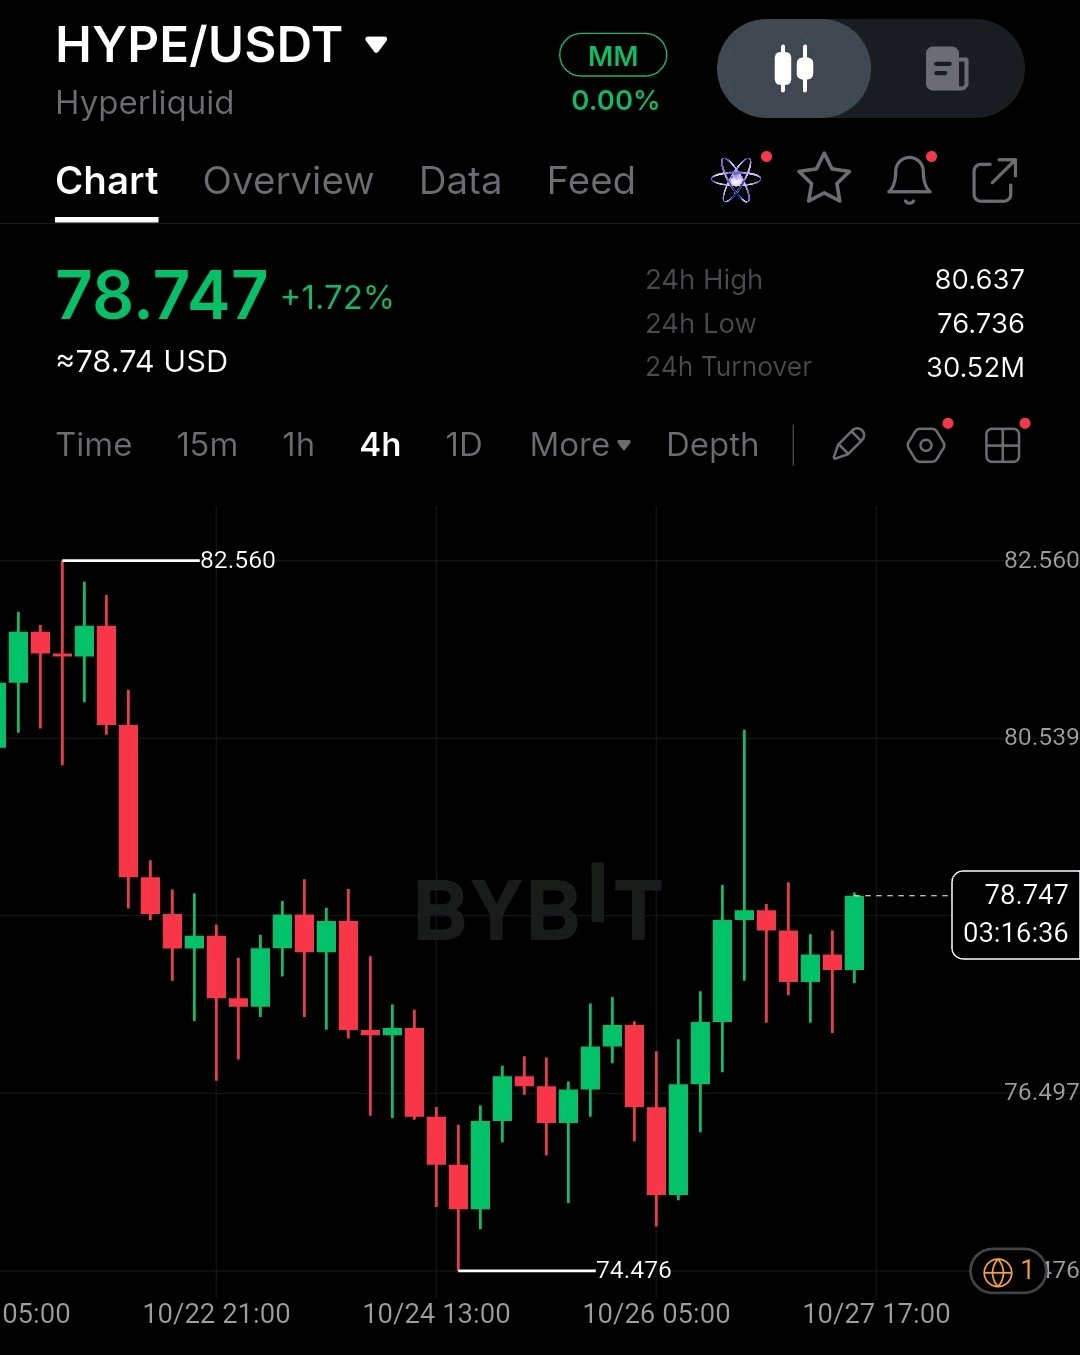
$HYPEUSDT has bounced back from 74.418 and is now trading around 78.516, up +1.59%. Buyers have stepped in, but I'm not ready to call this a reversal just yet. After such a prolonged downtrend, I want to see whether this recovery has real strength behind it or if sellers are simply waiting for another chance to take control. Since hitting 95.240, HYPE has continued to form lower highs and lower lows. The latest drop found support at 74.418, and we've now seen a sharp recovery back into the 78 zone. The bounce is encouraging, but the RSI readings tell an interesting story: - 6-period RSI: 69.76 - 12-period RSI: 58.73 - 24-period RSI: 51.32 Short-term momentum has picked up quickly, with the 6-period RSI already approaching overbought territory. Meanwhile, the 24-period RSI is only slightly above neutral. To me, that suggests a strong relief rally within a larger downtrend, not a confirmed change in direction. That's why I'm hesitant to buy at 78.516, especially with resistance nearby. Chasing a move after such a sharp recovery can leave very little room for error. The Levels on My Radar The first level I'm watching is 79.112, the 24-hour high. Below it, 74.916 is the floor I'm keeping an eye on. If price pushes into 79.112 and gets rejected with a strong wick, I'd consider the possibility of another move toward the lows. But if HYPE breaks above 79.623 and holds that level on a 4H candle close, the picture starts to improve. I'd still prefer to wait for a retest rather than jump straight into the breakout. Until that happens, I'm treating this recovery as a bounce against the prevailing trend. My Long Plan I'm watching the 75.000–77.000 zone for a possible entry, with invalidation at 74.000. My targets are: - TP1: 79.112 - TP2: 79.623 - TP3: 84.829 if momentum continues. Using 76.000 as the entry midpoint, the risk is around 1.5 points. The first target offers roughly a 1:2.1 risk-to-reward ratio, which is reasonable. The bigger opportunity would be a move toward 84.829, where the potential reward-to-risk ratio reaches approximately 1:5.9. That's the target that makes this setup worth watching, provided the market continues to support the bullish move. The invalidation at 74.000 is equally important. If price breaks below it and fails to reclaim it, I'd drop the long idea and turn my attention toward the 70.000 demand zone. What Would Change My View? A reclaim of 84.829, followed by price holding above it, would make me take the reversal scenario more seriously. From there, 90.034 would be the next upside target. On the downside, losing 74.000 without a successful reclaim would keep the bearish trend in control, with the 70.000 demand zone becoming the next area of interest. For now, I'm not buying just because the bounce looks strong. HYPE has recovered nicely, but one rally doesn't erase the structure that brought it down in the first place. I'd rather wait for confirmation than get caught chasing the move. What's your take on HYPEUSDT? Are you expecting another leg up, or would you rather wait for a pullback toward 76.000 before considering an entry? #ByXIMPACT #BybitStocks
$MNTUSDT is still under pressure, and I'm keeping a close eye on the 0.5104 support level. Price is down 1.47% today and currently hovering around 0.5164. But for me, the bigger concern isn't the daily drop itself. It's the fact that MNT has been trending lower for a while, with no clear sign of a proper reversal yet. Since peaking at 0.7045, the price has continued making lower highs and lower lows. Buyers tried to push it back toward 0.5521, but the recovery didn't last. Sellers stepped in again, sending MNT down to a 24-hour low of 0.5104. Now we're seeing price consolidate just above that low, and this is where I'm watching to see whether buyers can finally defend the area. The RSI readings are mixed, but they still lean toward weak momentum: - 6-period RSI: 50.51 - 12-period RSI: 45.78 - 24-period RSI: 44.54 The short-term RSI has recovered to neutral, while the 12 and 24-period readings remain in the mid-40s. So, although the immediate momentum has improved a little, the broader picture hasn't changed much. That's why I'm not rushing into a position. Opening a short here could mean selling too close to support after an extended decline. Going long isn't an easy decision either, because the market still hasn't formed a higher low to suggest that buyers are taking control. For now, I'd rather wait for price to show a clear reaction. The Levels That Matter 0.5104 is the first level I'm watching. If MNT breaks below this 24-hour low and can't reclaim it, the next area to watch is the 0.5014 demand zone. That would keep the bearish scenario in play. If the level holds and buyers produce a convincing rejection wick, however, a short-term bounce toward 0.5257 becomes possible. Even then, I'd treat any long as a quick counter-trend scalp, not confirmation that the downtrend has ended. My Long Setup I'm watching the 0.5100–0.5180 zone for a potential entry, with invalidation at 0.5050. My targets are: - TP1: 0.5257 - TP2: 0.5521 - TP3: 0.6029 if momentum continues. Using 0.5140 as the entry midpoint, the risk is approximately 0.009 points. The first target offers roughly a 1:1.3 risk-to-reward ratio, which isn't particularly attractive. The setup becomes more interesting at 0.5521, where the potential ratio improves to around 1:4.2. That's the kind of upside I'm looking for to justify taking a counter-trend trade, provided price action supports the setup. The 0.5050 invalidation is non-negotiable for this plan. If price drops below it and fails to recover, the sell-off could continue, and I'd step away from the long idea. What Would Change My Outlook? If MNT reclaims 0.5521 and holds above it, I'd take the possibility of a genuine reversal more seriously. From there, 0.6029 would be the next upside target on my radar. But if price loses 0.5050 and can't reclaim it, the downtrend remains in control. I'd then shift my attention toward potential short entries on a retest of 0.53. For now, patience makes more sense than trying to catch every move. MNT is approaching an important support area, but until buyers prove they can defend it, I'm not treating this as a bottom. What's your plan for MNTUSDT? Are you looking to buy near support for a possible bounce, or waiting for a stronger reclaim before entering? #ByXIMPACT #BybitStocks

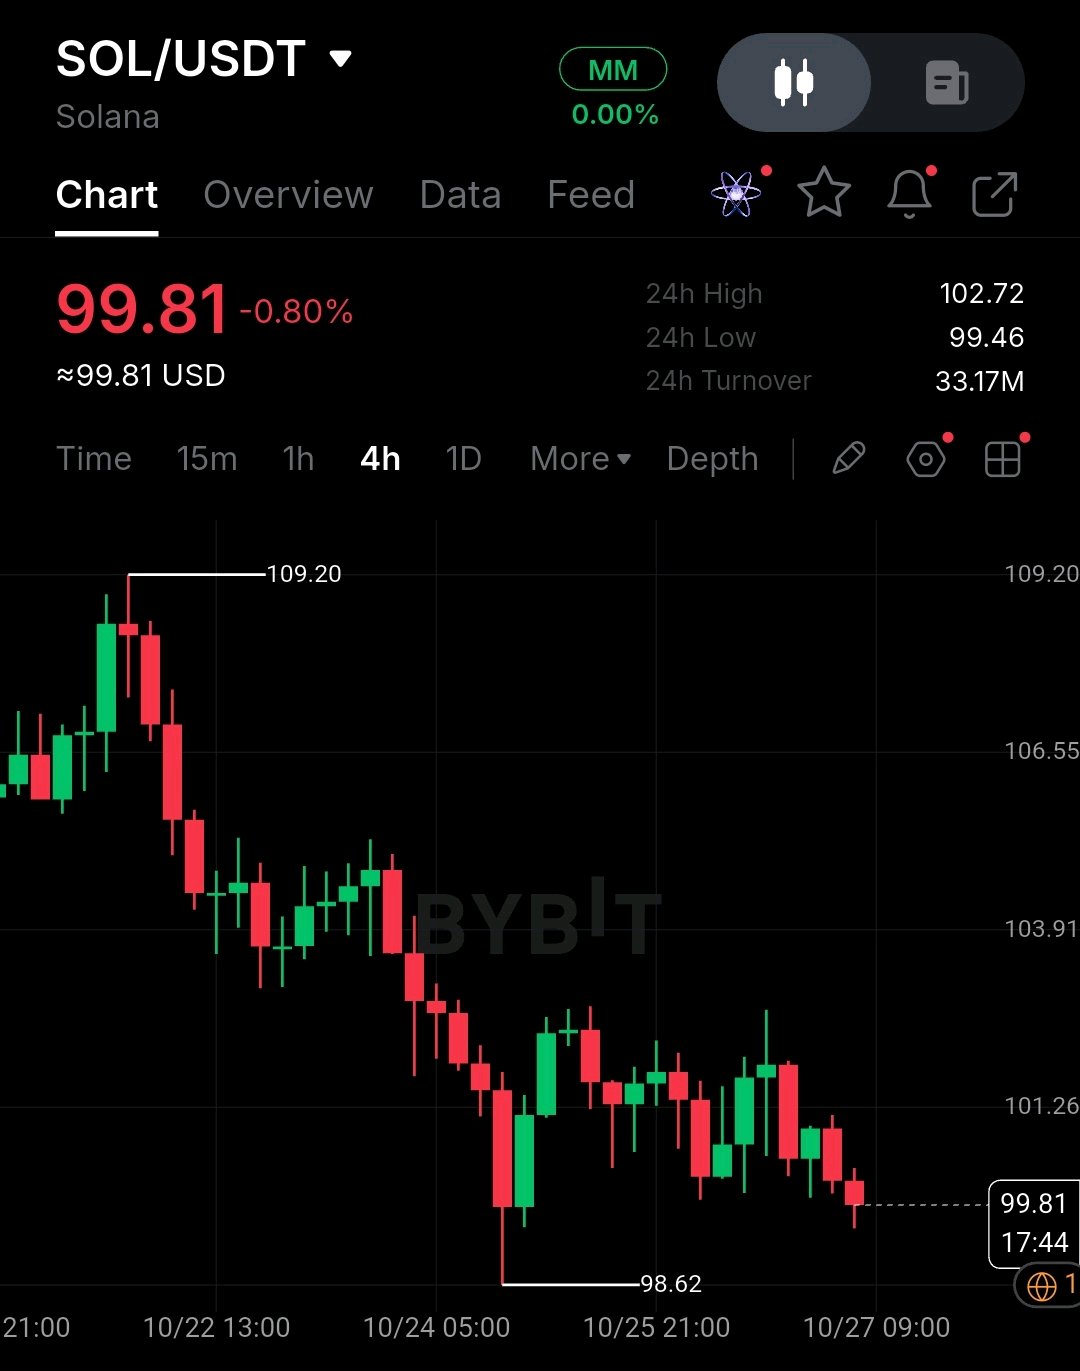
$SOLUSDT is hovering around 101.07, close to the 24-hour low, and this is where things start getting interesting. Price is down 0.31%, but the bigger concern for me is that the overall trend still hasn't shown any real signs of strength. SOL has been sliding lower since reaching 123.79, consistently forming lower highs and lower lows along the way. Buyers made an attempt to push the price back toward 111.17, but the recovery quickly lost steam, and sellers took control again. That sent SOL down to 99.79, its latest 24-hour low. Now the price is consolidating just above that level. The next move could tell us a lot about whether buyers are ready to step in or sellers still have more room to push. The RSI readings are fairly consistent across all three periods: - 6-period RSI: 43.98 - 12-period RSI: 42.68 - 24-period RSI: 43.20 All three are sitting in the low 40s. Momentum is clearly on the weak side, although SOL isn't deeply oversold yet. That's why I'm not rushing into a trade here. Opening a short after an extended decline could mean selling right into support, while buying now would mean going against a downtrend that hasn't produced a higher low. For me, neither side offers a clear advantage at the moment. The key level I'm keeping an eye on is 99.79. If SOL breaks below this level and fails to reclaim it, the next area I'm watching is the 98.56 demand zone. That would keep the bearish scenario in play. On the other hand, if buyers defend 99.79 and price forms a clear rejection wick, a short-term bounce toward 104.86 could be on the table. Even if that bounce happens, I'd still treat a long as a counter-trend scalp rather than assume the market has reversed. My Trading Plan If the setup develops, I'm watching the 99.80–101.50 entry zone, with invalidation at 98.80. My upside targets are: - TP1: 102.73 - TP2: 104.86 - TP3: 111.17 if momentum picks up and the move continues. Using 100.65 as the midpoint entry, the risk is around 1.35 points. Reaching 102.73 offers approximately a 1:1.5 risk-to-reward ratio, which is decent but not particularly compelling. The more interesting target is 104.86, where the potential reward-to-risk ratio improves to roughly 1:3.1. That's where the setup starts to make more sense to me. The invalidation at 98.80 is important. If price loses that level, the sell-off could extend, and I'd have little reason to stay in a long trade. What Could Change My Bias? A reclaim of 104.86 followed by a sustained hold above it would make me reconsider the bearish outlook. If buyers can manage that, 111.17 becomes the next level to watch. But if SOL breaks below 98.80 and can't get back above it, I'd continue favoring the downside. In that case, I'd look for potential short entries on a retest of 103. For now, I'm happy to wait. SOL is still in a clear downtrend, but entering blindly near support isn't the move I'm looking for. I want to see whether 99.79 holds before committing to either direction. What's your take on SOL right now? Are you looking to buy this dip for a bounce, or would you rather wait for a stronger recovery before entering? #ByXIMPACT #BybitStocks
$TSLAXUSDT just went on a serious run, climbing 5.97% and touching 397.31 before pulling back slightly to 394.82. The momentum is undeniable, but with the 6-period RSI sitting at 92.58, I'm not comfortable chasing this move at the top. Here's what stands out to me: this rally didn't come out of nowhere. Price dropped to 346.46, spent some time moving around the 371.88 level, and then buyers came in aggressively. Once 384.59 gave way, the price took off and pushed straight to the 24-hour high of 397.31. That's a powerful move, but the question now is whether buyers can keep it going. The RSI readings are pretty telling: - 6-period RSI: 92.58 - 12-period RSI: 79.80 - 24-period RSI: 66.97 Short-term momentum is extremely hot. An RSI above 90 on the 6-period of a 4H chart is a clear sign that this rally has become stretched. Buyers are firmly in control of the immediate move, but that doesn't mean jumping in here is a good idea. After such a sharp push, even a routine pullback could catch late buyers off guard. My overall bias is still bullish, but I'm not treating this as a confirmed reversal just yet. Right now, the risk comes from entering too late. Buying around 394.82 means chasing a near-vertical candle and potentially needing a stop below 384 just to give the trade enough room to handle normal volatility. The level I'm watching most closely is 384.59. If price pulls back, holds above it, and forms a clear rejection wick, I'd be more interested in a continuation long. That would suggest buyers are willing to defend the breakout. But if a 4H candle closes below 384.59, I'd become more cautious. It could mean the rally is losing steam, with the 371.88 demand zone becoming the next area to watch. The 24-hour low at 370.51 also remains an important structural reference. My Trade Plan I'm not looking to buy blindly at the current price. I'd rather wait for a better entry between 385.00 and 390.00, with invalidation at 382.00. Here's how I'd map out the upside: - TP1: 397.31 - TP2: 405.00 - TP3: 415.00 if momentum continues. Using 387.50 as the entry midpoint, the risk is around 5.5 points. Reaching 397.31 offers roughly a 1:1.8 risk-to-reward ratio, which isn't particularly attractive on its own. The setup becomes more interesting at 405.00, where the reward-to-risk ratio improves to approximately 1:3.2. That's the target I'd pay closer attention to, assuming the breakout structure remains intact. What Would Change My Mind? If price falls below 382.00 and can't reclaim it quickly, I'd drop the long idea. There's no reason to keep a bullish bias if the setup itself starts falling apart. I'd also rather stay out if price keeps chopping between 393 and 397 without giving a clear breakout or a decent pullback. After a move this aggressive, there's no need to force an entry just because the candles look exciting. For now, I'm leaning bullish, but I want confirmation before committing. The rally has already covered a lot of ground, and I'd rather let the market settle down and show whether 384.59 can hold than buy into the excitement. What's your approach to $TSLAXUSDT here? Are you riding the breakout, or waiting for a retest before getting involved? #ByXIMPACT #BybitStocks

$XAUTUSDT has bounced from 3,973.34 to 4,018.91 after hitting a fresh low, but I'm not rushing to buy into this recovery just yet. The price is up +0.62%, and while the bounce looks strong on the surface, that 6-period RSI at 76.58 is telling me to be careful. Here's what I'm watching: the bigger trend is still bearish. Since topping out at 4,279.60, price has continued making lower highs and lower lows. The latest sell-off pushed XAUTUSDT to a new low before buyers stepped in and drove a sharp V-shaped recovery back above 4,000. The RSI readings are where things get interesting: - 6-period RSI: 76.58 - 12-period RSI: 51.30 - 24-period RSI: 40.09 Short-term momentum has heated up quickly, but the longer-period RSI is still sitting around 40. That tells me the bounce is happening inside a much weaker overall structure. For now, I'd rather treat this as a relief rally than assume the trend has reversed. Buying at 4,018.91 means entering after a strong move, with the 6-period RSI already in overbought territory and resistance close overhead. The 4,049.90 level is particularly important here. My immediate focus is on the range. The 24-hour high at 4,026.19 is the first hurdle, while 3,980.68 is the support level I'm keeping an eye on. If price pushes into 4,026 and gets rejected with a clear wick, I may look for a short opportunity back toward the lows. But if buyers manage to break above 4,049.90 and hold it on a 4H candle close, that would give the recovery more credibility. Even then, I'd prefer to wait for a retest rather than chase the breakout. The Long Setup I'm Watching I'm interested in a potential entry between 3,980 and 4,005, with invalidation at 3,960. My targets are: - TP1: 4,049.90 - TP2: 4,126.47 - TP3: 4,203.03 if momentum continues to build. Using 3,992.50 as the entry midpoint, the risk is around 22.5 points. Reaching 4,049.90 would offer approximately a 1:2.5 risk-to-reward ratio, which makes the setup worth watching. The invalidation level is important. If price falls below 3,960, the sell-off could continue, and I'd have no reason to stay in the long trade. What Would Change My Bias? A reclaim of 4,126.47, followed by price holding above it, would make me take the reversal scenario more seriously. From there, 4,203.03 would be the next upside target. On the bearish side, if price loses 3,960 and fails to recover it, I'd stick with the broader downtrend and look for potential short entries on a retest of 4,050. For now, I'm keeping things simple: no chasing, no forcing entries, and no assuming one sharp bounce means the trend has changed. I want to see how price reacts at these key levels before committing. What's your take on $XAUTUSDT right now? Are you expecting another push higher, or would you rather wait for a pullback toward 3,990 before entering? #ByXIMPACT #BybitStocks
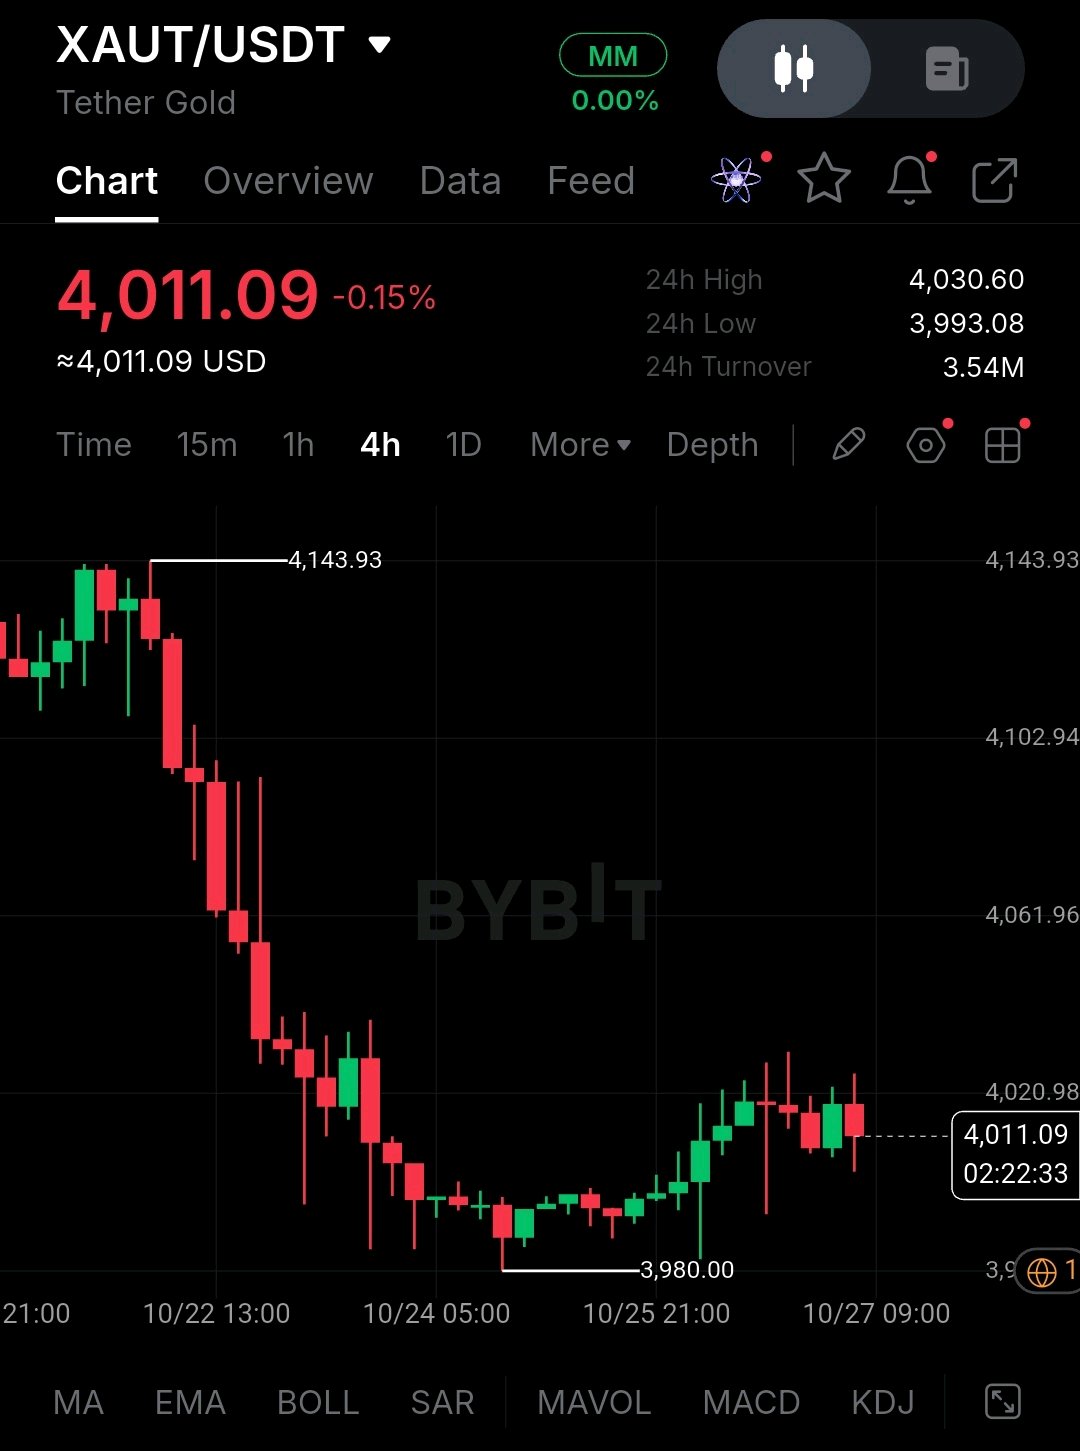
$BTCUSDT just printed a fresh low at 79,217.9 and is now trading around 79,868.0. The selling pressure is still there, but I'm not rushing into a short just yet. With the RSI sitting at 37.53, I think it's worth being a little more patient before making a move. What stands out to me isn't just the -0.63% drop. It's how consistently bearish the structure has been. Since peaking at 87,256.3, Bitcoin has continued to make lower highs and lower lows. Buyers tried to push the price back toward 83,237, but the recovery couldn't hold. Sellers stepped in again, driving BTC down to its 24-hour low of 79,362.9. Now we're hovering just above that level. The momentum indicators tell a similar story. The 6-period RSI is at 37.53, the 12-period at 38.06, and the 24-period at 40.97. All three are sitting in the high 30s to low 40s. That's clearly weak momentum, but we're not deeply oversold either. That's exactly why I'm holding back. Shorting after such an extended drop could mean selling right into support, while buying here means going against a downtrend that hasn't produced a higher low yet. Neither setup looks particularly convincing at the moment. For me, 79,362.9 is the level to watch closely. If BTC breaks below it and struggles to reclaim it, the next area of interest is the demand zone around 79,217.9. But if buyers defend the level and price forms a clear rejection wick, we could see a short-term bounce toward 81,227.5. My Long Plan If I take a long here, it'll be a quick counter-trend trade, not a bet that the entire downtrend is over. - Entry zone: 79,400–80,000 - Invalidation: 78,800 - TP1: 80,961.0 - TP2: 81,227.5 - TP3: 83,237.1, if momentum supports further upside. Using 79,700 as the entry midpoint, the risk is roughly 1,100 points. That gives a reward-to-risk ratio of around 1:1.1 at TP1, which isn't particularly attractive. At 81,227.5, it improves to approximately 1:1.4. The more interesting payoff comes if price reaches 83,237.1, where the ratio is roughly 1:3.2. What Would Make Me Change My Mind? If BTC reclaims 81,227.5 and manages to hold above it, I'd start taking the possibility of a genuine reversal more seriously. From there, 83,237.1 would be the next level I'd watch for continuation. On the downside, a break below 78,800 without a successful reclaim would keep the bearish structure in control. If that happens, I'd lean toward looking for short opportunities on a retest of 81,000 rather than trying to catch a falling market. For now, I'm not interested in forcing a trade just because price has dropped sharply. The trend still favors sellers, but the proximity to support makes chasing a short risky, and the long side still needs confirmation. What's your move here? Are you buying this dip for a quick bounce, or waiting for BTC to reclaim a key level before entering? #ByXIMPACT #BybitStocks #MyByXTake
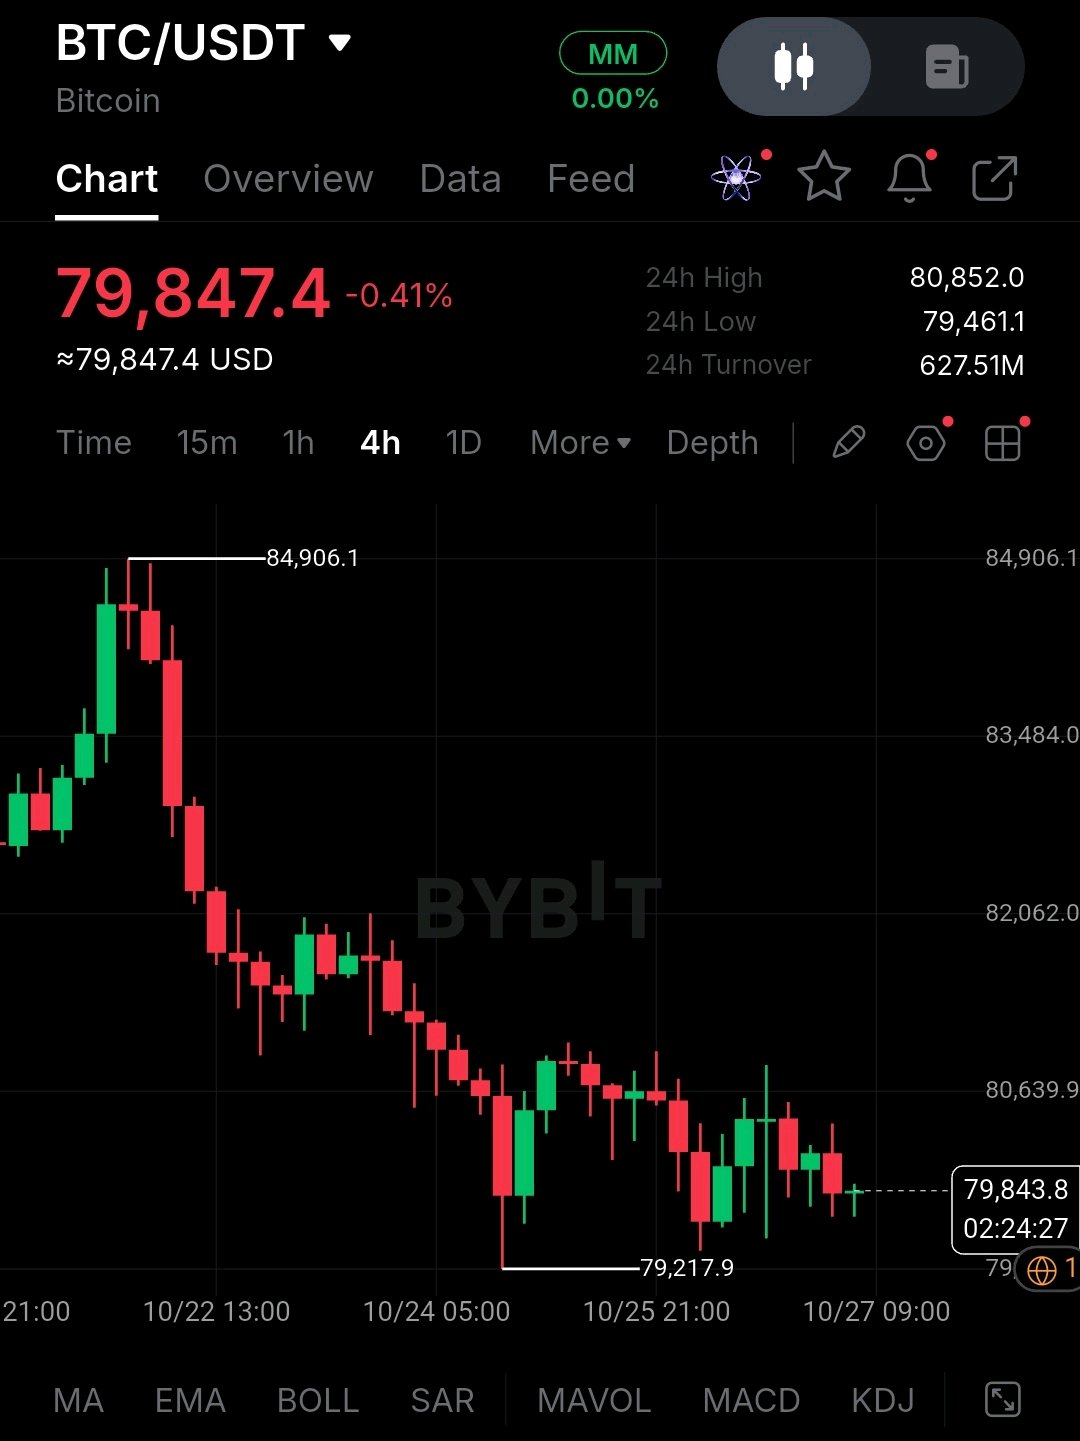
$SOLUSDT is showing a short-term bullish structure after recovering strongly from the lower levels and pushing toward the 106.70 resistance zone. Price is currently around 105.55 and holding above the 105.14 support area. The key decision zone is between 105.90–106.00. If buyers reclaim 106.00 and hold above it, the move could extend toward 106.70 and potentially 107.20. But if SOL gets rejected and breaks 105.14 with a clean 15M close, sellers could retest 104.36. PLAN Pair: $SOL/USDT Timeframe: 15M Bias: Bullish above 105.14 Entry: 105.40–105.80 on confirmation SL: 104.95 TP1: 106.00 TP2: 106.70 TP3: 107.20 Support: 105.14 / 104.36 Resistance: 106.00 / 106.70 Major Resistance: 107.20 Invalidation: Strong 15M close below 105.14 SOL is sitting near the decision zone, so I’m not chasing the move. Waiting for confirmation is the cleaner setup. #BybitAIBestReplies #BybitAIBoughtTheDip
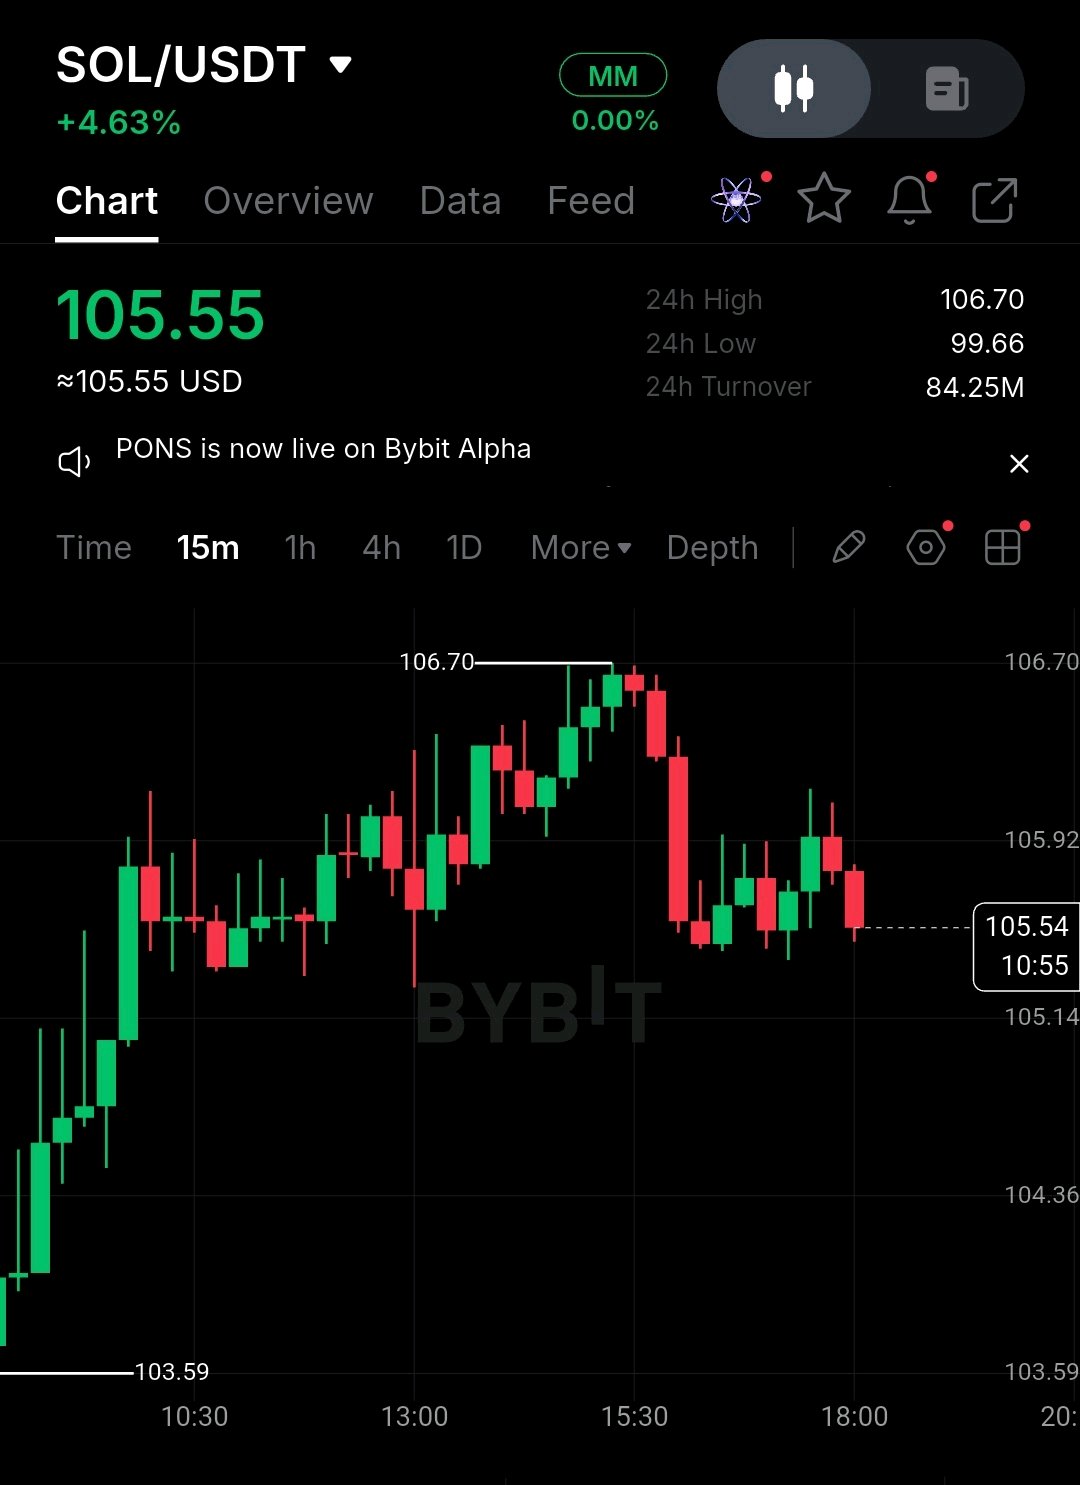
$BTCUSDT is showing a short-term bullish recovery after bouncing strongly from the 77,007.7–77,497.3 area. Price is currently around 78,315.7 and consolidating below the recent high at 78,476.5. This is the key decision area. If buyers reclaim 78,476.5 and hold above it, the move could extend toward 78,700 and potentially 79,000. But if BTC gets rejected around 78,476.5 and breaks 77,986.9 with a clean 15M close, sellers could retest 77,497.3 and 77,007.7. PLAN Pair: $BTC/USDT Timeframe: 15M Bias: Bullish above 78,476.5 Entry: 78,300–78,450 on confirmation SL: 77,900 TP1: 78,700 TP2: 79,000 TP3: 79,300 Support: 77,986.9 / 77,497.3 / 77,007.7 Resistance: 78,476.5 / 78,700 Major Resistance: 79,000 Invalidation: Strong 15M close below 77,986.9 BTC is sitting just below the key resistance zone, so I’m not chasing the move. Waiting for confirmation is the better setup. #BybitAIBestReplies #MetaMuse
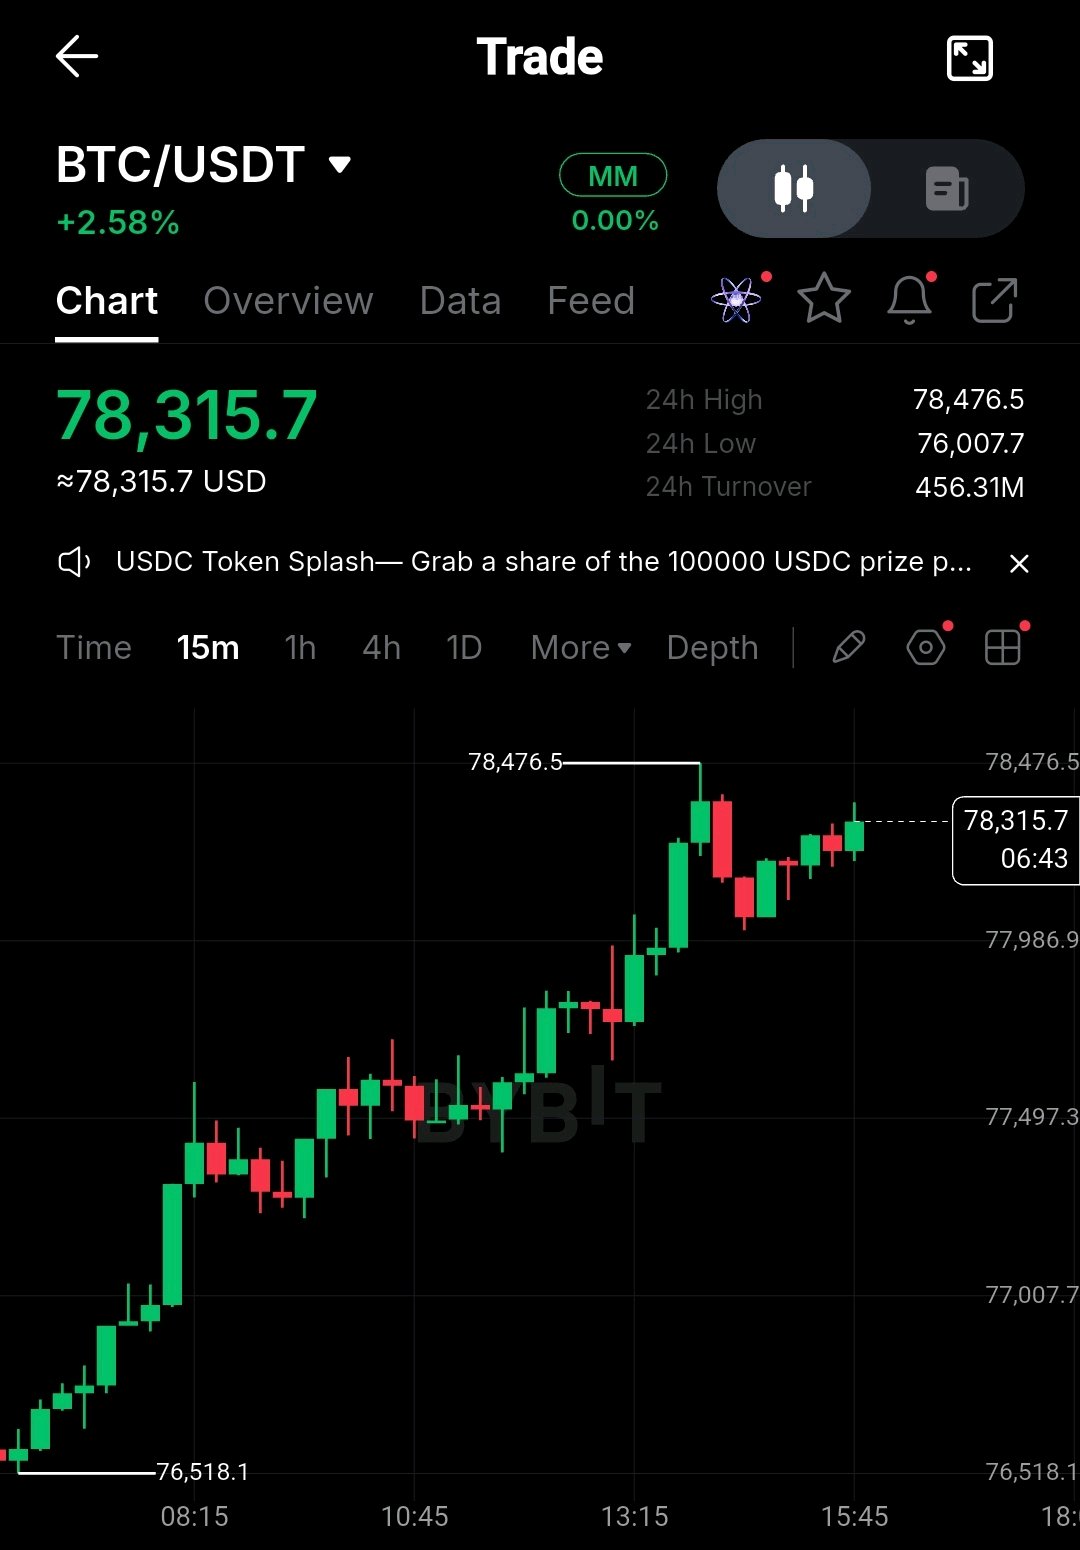
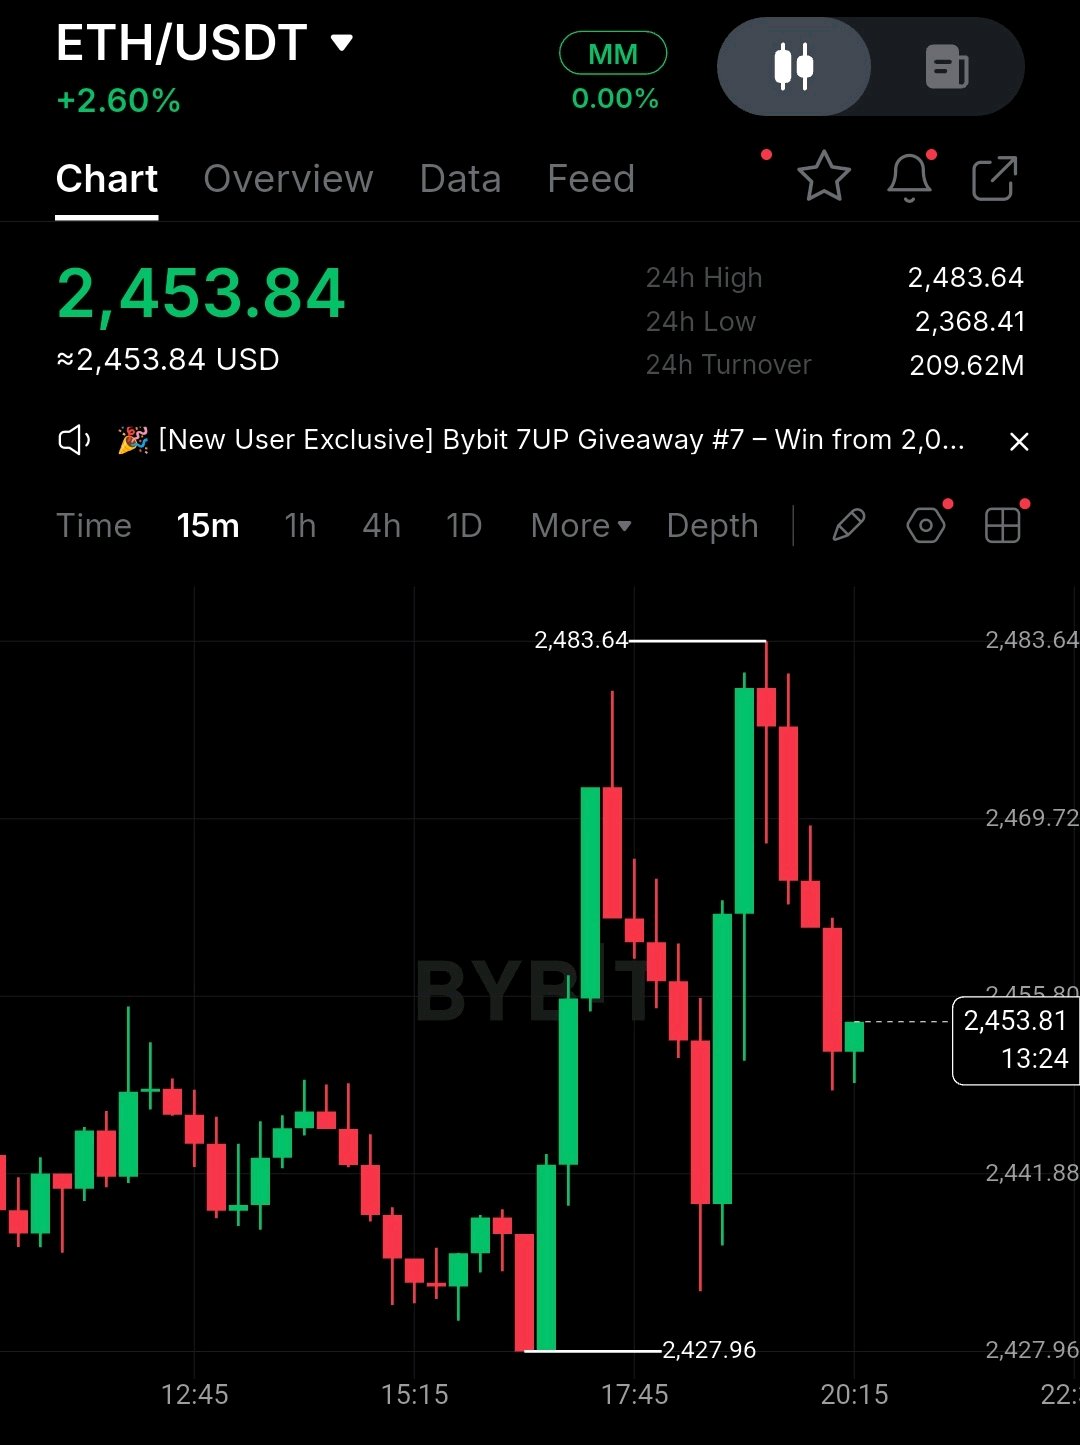
$ETHUSDT is showing a short-term recovery after bouncing strongly from the 2427.96 support zone. Price is currently around 2453.84 and approaching the 2455.80 resistance area. This is the key decision zone. If buyers reclaim 2455.80 and hold above it, the move could extend toward 2469.72 and potentially 2483.64. But if ETH gets rejected and breaks 2441.88 with a clean 15M close, sellers could retest 2427.96. PLAN Pair: $ETH/USDT Timeframe: 15M Bias: Bullish above 2455.80 Entry: 2453–2456 on confirmation SL: 2441.50 TP1: 2469.72 TP2: 2476.00 TP3: 2483.64 Support: 2441.88 / 2427.96 Resistance: 2455.80 / 2469.72 Major Resistance: 2483.64 Invalidation: Strong 15M close below 2441.88 ETH is sitting near the decision zone, so confirmation is important before entering. #BybitAIBestReplies #MetaMuse
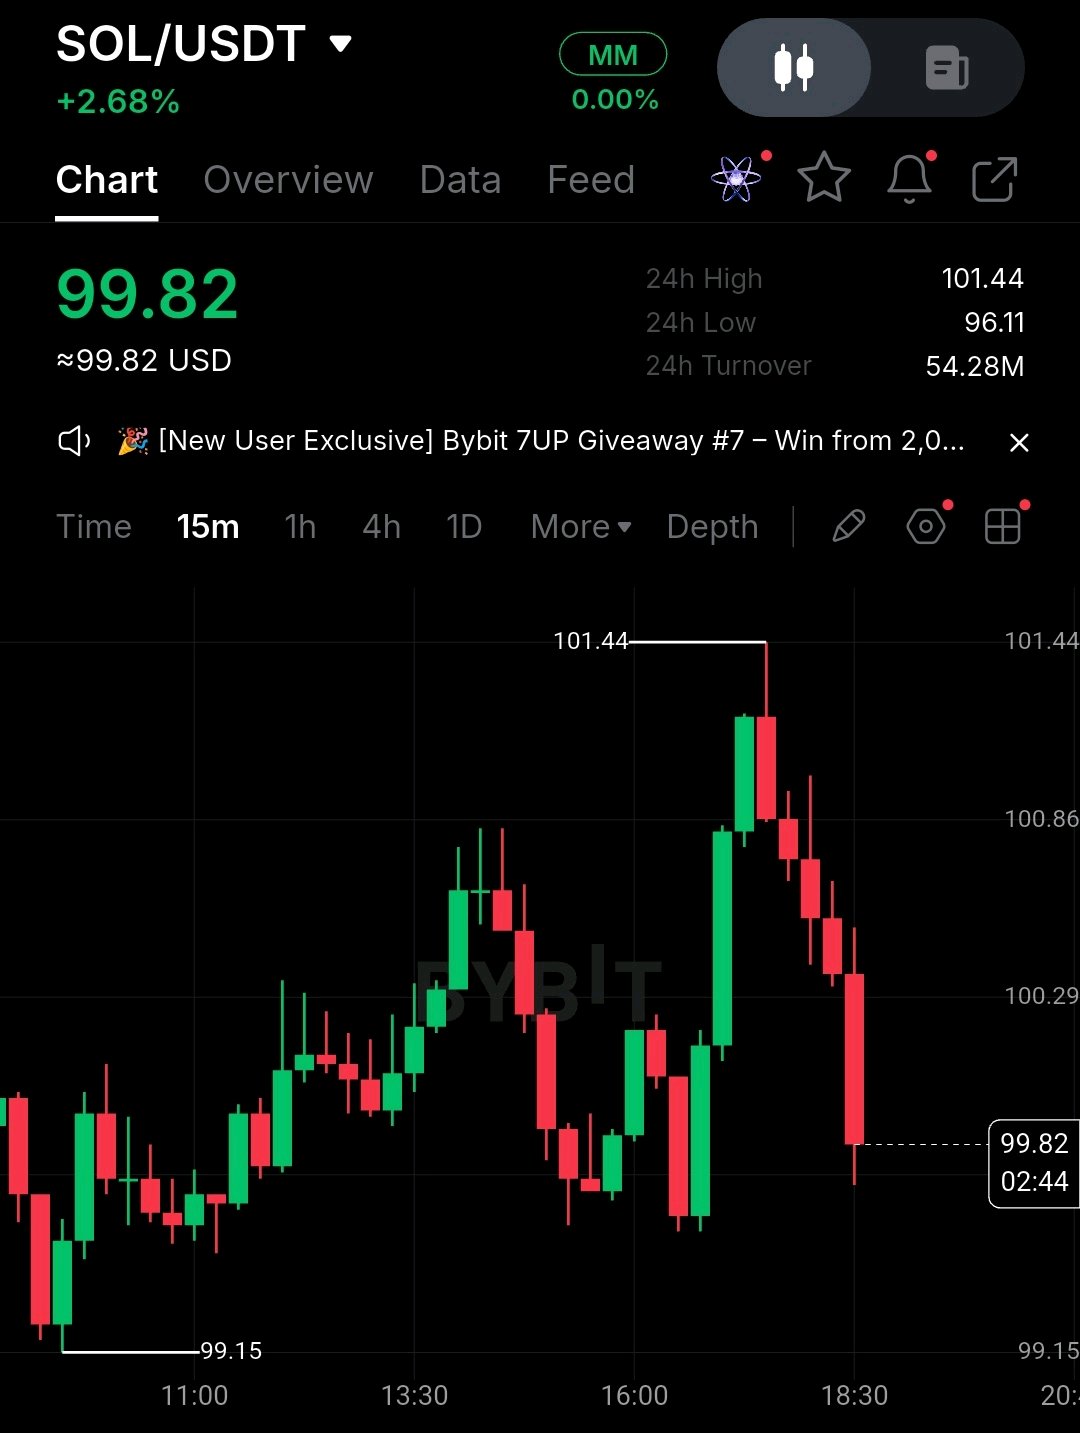
$SOLUSDC is showing a short-term recovery, but price is currently pulling back from the 101.44 resistance area. Price is around 99.82 and sitting near the key 99.15–100.29 decision zone. If buyers reclaim 100.29 and hold above it, the move could extend toward 100.86 and 101.44. But if SOL loses 99.15 with a clean 15M close, sellers could push price lower. PLAN Pair: $SOL/USDT Timeframe: 15M Bias: Bullish above 100.29 Entry: 100.30–100.50 on confirmation SL: 99.10 TP1: 100.86 TP2: 101.20 TP3: 101.44 Support: 99.15 Resistance: 100.29 / 100.86 Major Resistance: 101.44 Invalidation: Strong 15M close below 99.15 SOL is at a key decision zone. No chasing — wait for confirmation. #BybitAIBestReplies #BybitAIBoughtTheDip
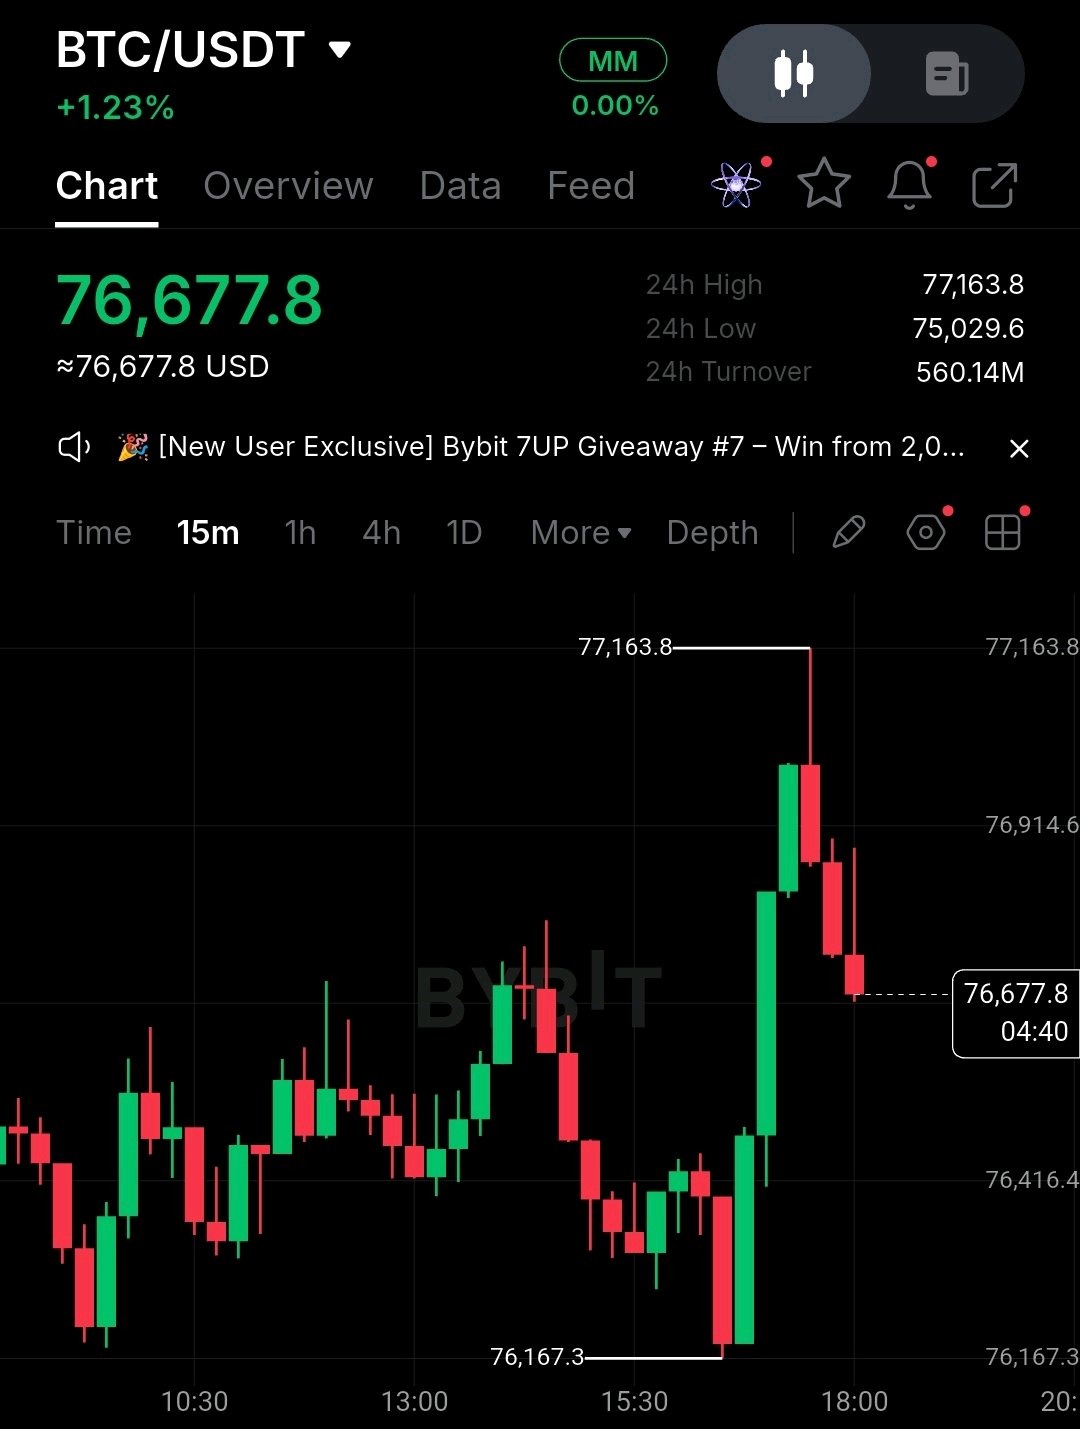
$BTCUSDT is showing a short-term bullish recovery after bouncing strongly from the 76,167–76,200 area. Price is currently around 76,678 and pulling back after testing the 77,163 resistance zone. This is the key decision area. If buyers hold above 76,500 and reclaim 76,915, the move could extend toward 77,163 and potentially 77,400. But if BTC breaks 76,416 with a clean 15M close, sellers could retest 76,167. PLAN Pair: $BTC/USDT Timeframe: 15M Bias: Bullish above 76,500 Entry: 76,550–76,750 on confirmation SL: 76,350 TP1: 76,915 TP2: 77,160 TP3: 77,400 Support: 76,416 / 76,167 Resistance: 76,915 / 77,163 Major Resistance: 77,400 Invalidation: Strong 15M close below 76,416 BTC is sitting in a key decision zone, so I’m not chasing the move. Waiting for confirmation is the better setup. #BybitAIBestReplies #BybitAIBoughtTheDip
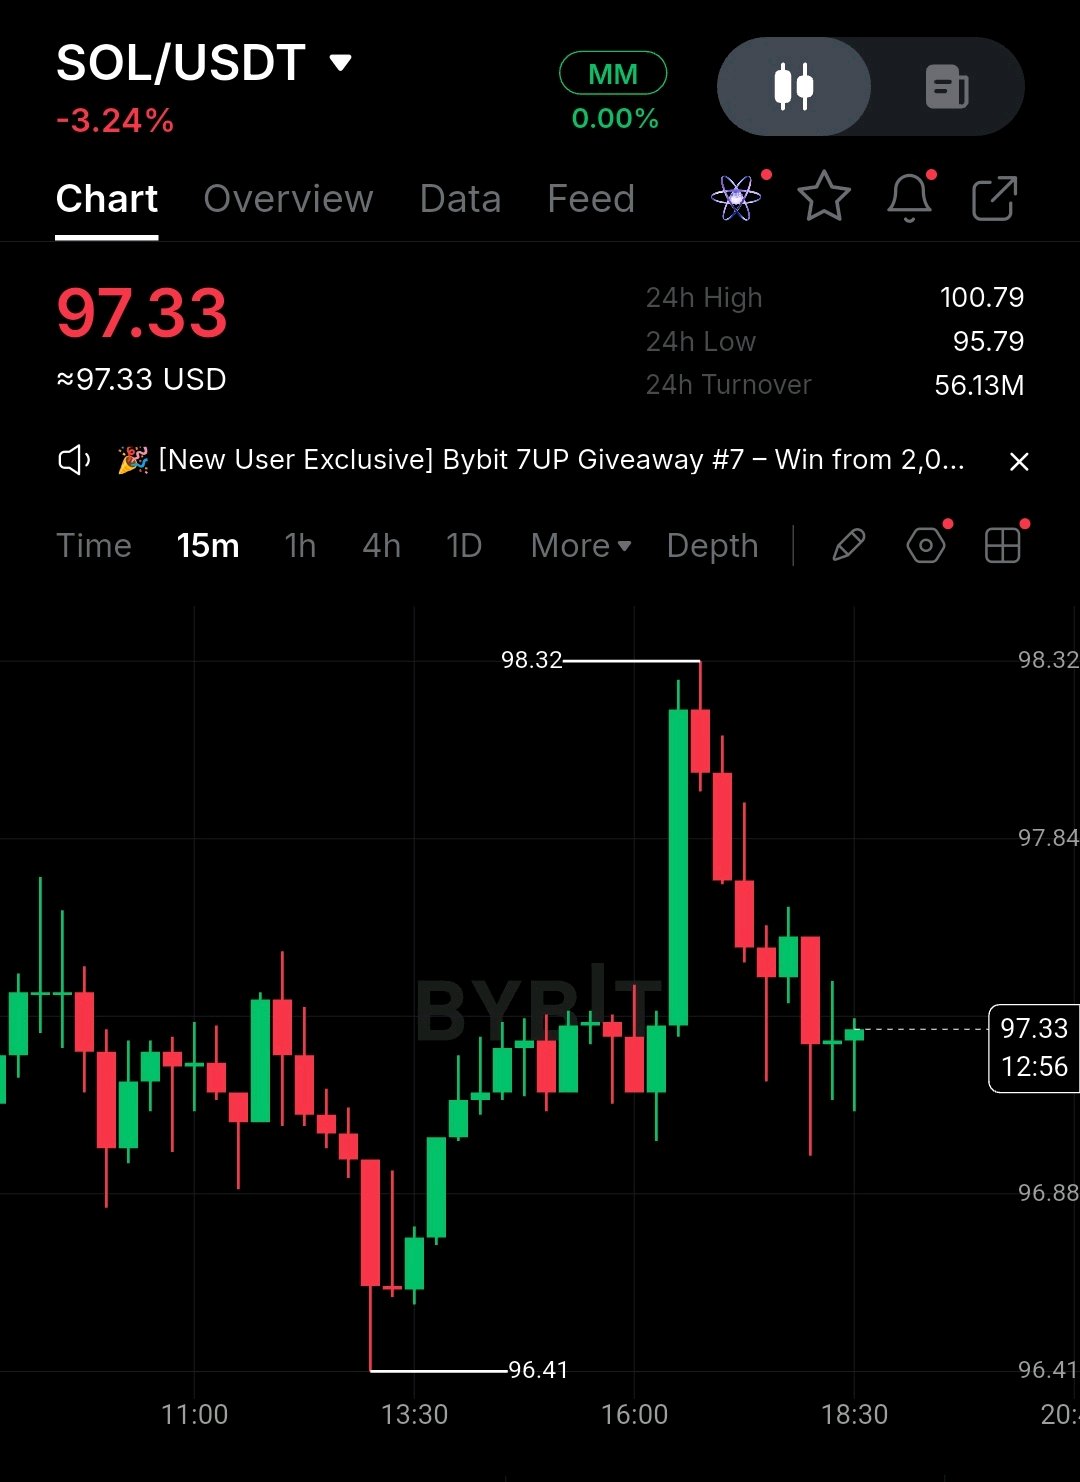
$SOLUSDT is showing a short-term recovery after bouncing strongly from the 96.41 area. Price is currently around 97.33 and attempting to stabilize after rejection from 98.32. This is the key decision zone. If buyers reclaim 97.50 and hold above it, the move could extend toward 97.84 and potentially 98.32. But if SOL gets rejected and breaks 96.88 with a clean 15M close, sellers could retest 96.41 and potentially 95.79. PLAN Pair: $SOL/USDT Timeframe: 15M Bias: Bullish above 97.50 Entry: 97.20–97.50 on confirmation SL: 96.80 TP1: 97.84 TP2: 98.10 TP3: 98.32 Support: 96.88 / 96.41 / 95.79 Resistance: 97.50 / 97.84 Major Resistance: 98.32 Invalidation: Strong 15M close below 96.88 SOL is sitting near the decision zone, so I’m not chasing the move. Waiting for confirmation is the cleaner setup. #BybitAIBestReplies #TradFiOptions24/7
$BTCUSDT is showing a strong short-term recovery after bouncing from the 75,345 area. Price is currently around 75,991 and testing the key resistance near 76,115. If buyers break and hold above 76,115, the move could extend higher. But rejection here could send BTC back toward 75,730 and 75,537. PLAN Pair: $BTC/USDT Timeframe: 15M Bias: Bullish above 76,115 Entry: 75,950–76,050 on confirmation SL: 75,730 TP1: 76,115 TP2: 76,300 TP3: 76,500 Support: 75,730 / 75,537 / 75,345 Resistance: 76,115 Invalidation: Strong 15M close below 75,730 BTC is sitting right below resistance, so I’m waiting for confirmation instead of chasing. #BybitAIBestReplies #BybitAIBoughtTheDip

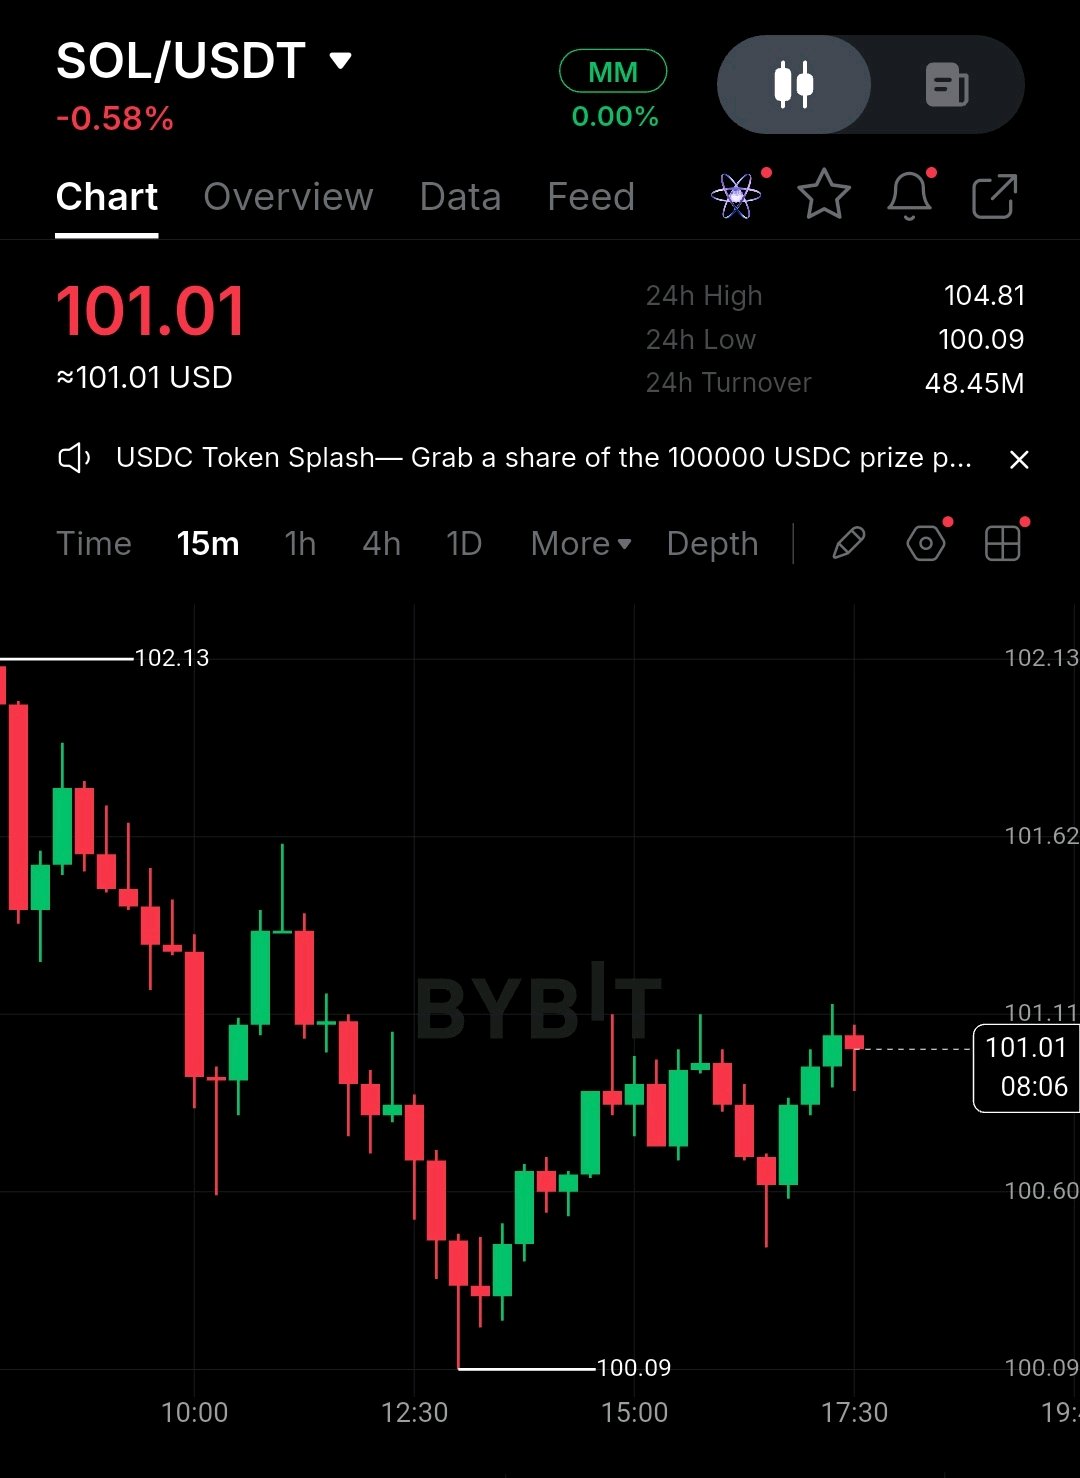
$SOLUSDT # is showing a short-term recovery after bouncing from the 100.09 support area. Price is currently around 101.01 and testing the 101.11 resistance zone. This is the key decision area. If buyers reclaim 101.11 and hold above it, the move could extend toward 101.62 and potentially 102.13. But if SOL gets rejected and breaks 100.60 with a clean 15M close, sellers could retest 100.09. PLAN Pair: $SOL/USDT Timeframe: 15M Bias: Bullish above 101.11 Entry: 101.00–101.15 on confirmation SL: 100.55 TP1: 101.62 TP2: 102.00 TP3: 102.13 Support: 100.60 / 100.09 Resistance: 101.11 / 101.62 Major Resistance: 102.13 Invalidation: Strong 15M close below 100.60 SOL is sitting near a key resistance zone. No chase — wait for confirmation. #BybitAIBestReplies #AdobeEarnings
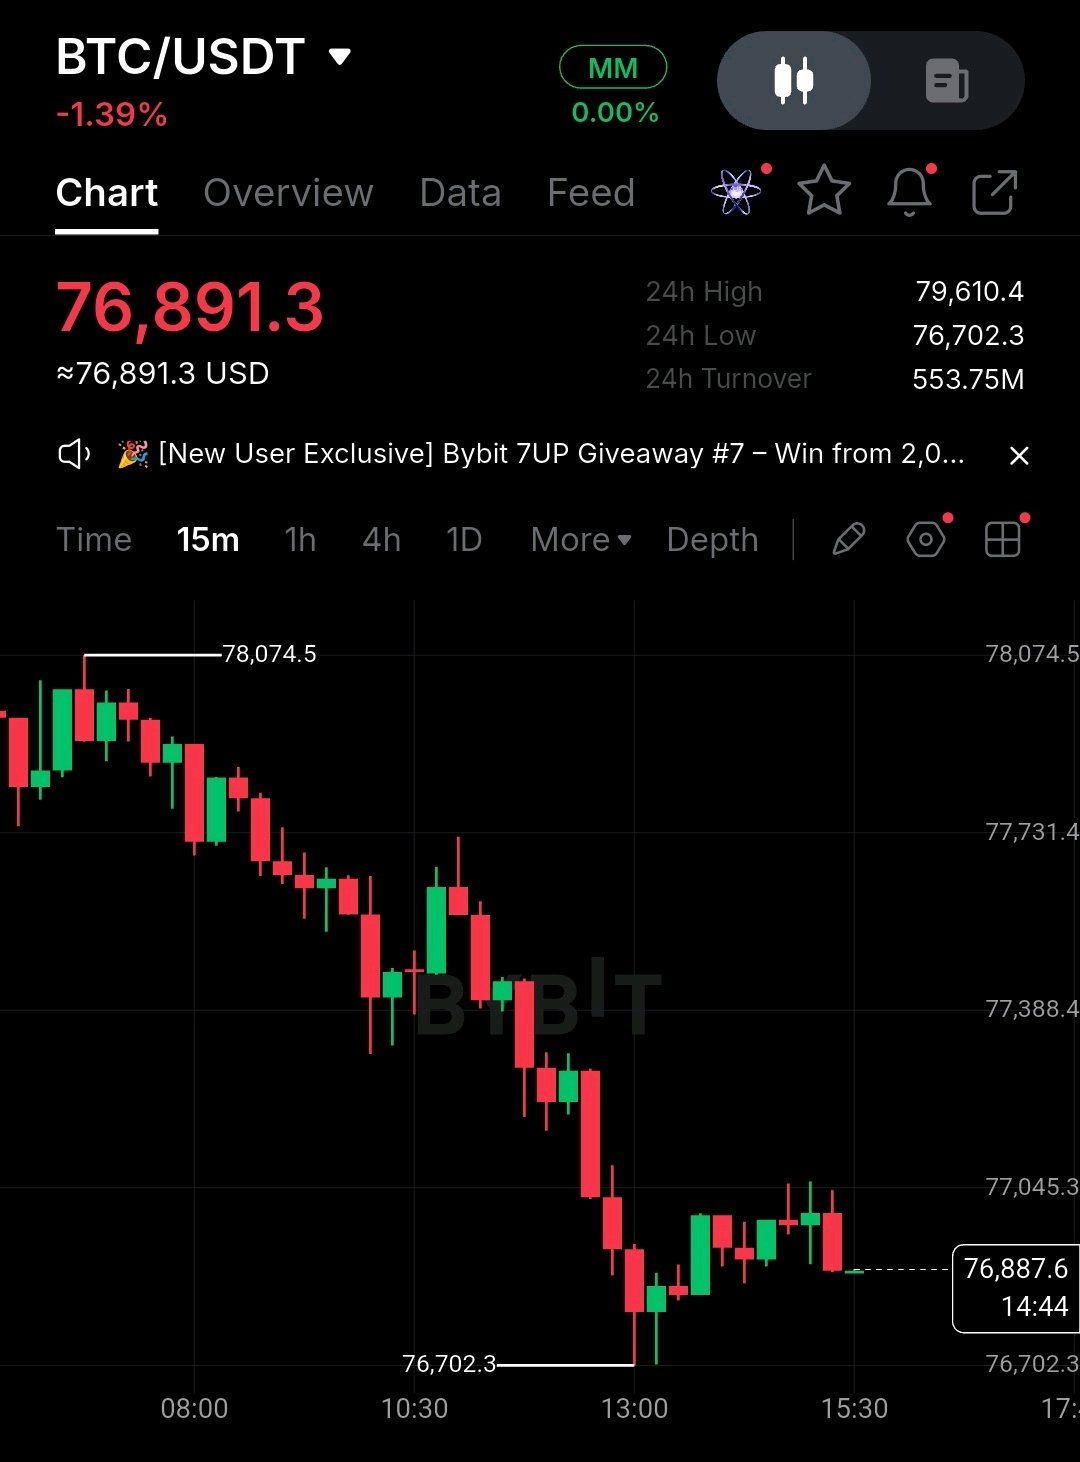
$BTCUSDT is showing a short-term recovery after bouncing strongly from the 76,702.3 support area. Price is currently around 76,891.3 and consolidating just below the near-term resistance zone. This is the key decision area. If buyers reclaim 77,045.3 and hold above it, the move could extend toward 77,388.4 and potentially 77,731.4. But if BTC gets rejected around 77,045.3 and breaks 76,702.3 with a clean 15M close, sellers could push price lower toward the next support area. PLAN Pair: $BTC/USDT Timeframe: 15M Bias: Bullish above 77,045.3 Entry: 76,850–77,000 on confirmation SL: 76,650 TP1: 77,388.4 TP2: 77,731.4 TP3: 78,074.5 Support: 76,702.3 Resistance: 77,045.3 / 77,388.4 Major Resistance: 77,731.4 / 78,074.5 Invalidation: Strong 15M close below 76,702.3 BTC is sitting just below the decision zone, so I’m not chasing the move. Waiting for confirmation above resistance is the better setup. #BybitAIBestReplies #BybitAIWatchMyCharts