rubina
Crypto lover
Crypto is starting to prove its value beyond trading. Tether, Bybit, Kraken, Solana Foundation and other major players have joined forces to launch FASE, a Swiss nonprofit focused on financial security, scam prevention and support for trafficking survivors. The scale is what caught my attention: • Up to 10M young people targeted with digital education and anti-scam tools • Stablecoin-based humanitarian aid pilot could reach 1M people • Support planned for organizations helping trafficking survivors across Africa This is a different side of crypto: not just markets, but access, protection and real-world financial utility. For the industry, initiatives like this could matter far beyond the next market cycle. $SUSDT $SOLUSDT #ByXIMPACT #IMPACTbyTrade #WSOT2026


$LDOUSDT has stopped falling aggressively, but that alone doesn’t mean sellers have lost control. LDO is trading near $0.375, up around 2.6% over 24 hours in the latest market snapshot. Price has recovered from the recent $0.36 area, yet it remains well below the $0.40–$0.41 zone where the previous rally stalled. The more interesting signal is in derivatives. Open interest is around $14.25M, down roughly 2% over 24 hours, while funding is slightly positive. Price rising as open interest falls can indicate positions are being closed rather than fresh leverage powering the move. It doesn’t prove the rally is weak, but it does mean I want confirmation before calling this a new trend. The chart shows the immediate battle clearly: resistance sits around $0.379, with support near $0.373. On the 4H timeframe, LDO remains below its 50- and 200-period moving averages. The short-term bounce is improving, but the broader structure has not yet turned bullish. There’s also a fundamental distinction worth remembering: Lido is a major Ethereum liquid-staking protocol, but LDO governance-token demand is not the same thing as demand for staked ETH. Protocol usage alone does not guarantee that LDO’s price will rise. What I’m watching - Current price: ~$0.375 - 24H change: approximately +2.6% - Open interest: ~$14.25M - 24H OI change: approximately −2% - Nearest resistance: $0.379 - Nearest support: $0.373 Bullish confirmation: LDO breaks and holds above $0.379, then builds support instead of immediately slipping back into the range. Bearish confirmation: Price loses $0.373 and fails to reclaim it, opening the possibility of another test of the recent $0.360 area. Current stance: WAIT — RANGE TO BREAKOUT WATCH. Take Profit — conditional on confirmed breakout - TP1: $0.386 - TP2: $0.395 My read: LDO is showing signs of stabilization, not a confirmed reversal. I’d rather see resistance turn into support before treating this bounce as a tradeable trend change. #ByXIMPACT #IMPACTbyTrade #WSOT2026
Solana is back above $102, but the derivatives data tells me not to chase the first green candle. SOL is trading near $102.00, up approximately 2.5% over 24 hours. Price has rebounded from around $99.16 and is now approaching the $102.40–$103.00 resistance area. The recovery is real, but SOL remains down roughly 4.2% over seven days, so the wider pullback has not yet been reversed. Here’s the part worth watching: around $3.2 million in SOL positions were liquidated over 24 hours, with short liquidations slightly exceeding long liquidations. That suggests forced short covering helped the rebound, but it does not prove that fresh spot buyers are taking control. Open interest is around $3.5 billion, while funding is positive at roughly 0.0082% per eight hours. About three-quarters of Binance accounts holding SOL positions are long. That positioning can support a rally if price breaks resistance, but it also creates vulnerability if the breakout fails and crowded longs rush for the exit. The battle is now around $102.40–$103.00. A clean 4H close above this zone, followed by a successful retest, would strengthen the recovery case. Until then, this could remain a relief bounce inside a broader downtrend. Trade map — SOLUSDT - Current stance: BREAKOUT WATCH - Resistance: $102.40–$103.00 - Support: $100.00, then $99.15 - Bullish confirmation: Break and hold above $103.00 with stronger spot buying. - Bearish confirmation: Rejection at resistance followed by a loss of $100.00. - Invalidation: A breakout that quickly falls back below the reclaimed zone. Take Profit — only after confirmed breakout - TP1: $104.00 - TP2: $105.20 My read: SOL has recovered, but long positioning is already crowded enough to make confirmation important. I would rather see resistance turn into support than buy simply because shorts are getting squeezed. Educational analysis only, not financial advice. $SOLUSDT #ByXIMPACT #IMPACTbyTrade #WSOT2026
POLYMARKET JUST CUT THE CRYPTO PREDICTION WINDOW TO 5 MINUTES The real competition is no longer just about predicting direction. It is about how quickly traders must make that call. Polymarket has launched 5-minute Up/Down contracts for BTC, ETH, SOL and XRP in its US app, while Kalshi offers 15-minute crypto markets. That creates a much tighter decision window, where short-term volatility and sudden price reversals can quickly change the outcome. The trader's edge: Watch price action, momentum and key support or resistance levels instead of blindly chasing a green or red candle. Five minutes can create more opportunities, but it also leaves less room for mistakes. Faster does not automatically mean better. $BTCUSDT $XRPUSDT #ByXIMPACT #IMPACTbyTrade #WSOT2026

$LITUSDT is recovering, but I’m not interested in the green candle by itself I want to see whether buyers can turn $3.16 into support. LIT is trading around $3.03, with the latest 24H range near $2.97–$3.16 and roughly $60.7M in 24H volume. The important part is that price has recovered from the lower end of the range, but the market is still well below its December 2025 peak near $7.86. That leaves me with a simple question: is this recovery attracting fresh demand, or is LIT simply bouncing inside a larger correction? The underlying project gives the move an interesting backdrop. Lighter is a decentralized perpetuals platform built around verifiable order matching and liquidations. The LIT token is also tied to the ecosystem through staking and liquidity mechanisms, while the project introduced permanent burn mechanics as part of its tokenomics changes. But there is an important counterpoint: only about 250M LIT of the 1B maximum supply is currently circulating. That means the circulating supply is only a fraction of the eventual maximum, so supply dynamics still deserve attention when evaluating a sustained rally. The chart now has a clear battle zone. $3.16 is the immediate resistance. If LIT breaks above it with stronger volume and then successfully retests the level, the recovery starts looking much more credible. If buyers fail there and price falls back below $2.97, the current bounce becomes much less convincing. Key figures - Current area: ~$3.03 - 24H range: ~$2.97–$3.16 - 24H volume: ~$60.7M - Market cap: ~$758M - Circulating supply: 250M LIT - Maximum supply: 1B LIT - Major resistance: $3.16 - Immediate support: $2.97 Bullish confirmation: 4H close above $3.16 followed by a successful retest with sustained buying volume. Bearish confirmation: Rejection near $3.16 followed by a clean break below $2.97. Current stance: BREAKOUT WATCH. Take Profit only after confirmed breakout - TP1: $3.25 - TP2: $3.38 My read: LIT has enough momentum to keep traders interested, but $3.16 is where the market has to prove that this is more than a short-term bounce. I would rather see resistance become support than chase the first breakout candle. #ByXIMPACT #IMPACTbyTrade #WSOT2026
GROVE just made the kind of move that can attract traders quickly but the first question is whether this is accumulation or a liquidity-driven spike. GROVE is trading around $0.0099–$0.0100, after gaining roughly 95% over 24 hours. The important part is not simply the size of the green candle. The 24H range has expanded from around $0.00488 to $0.01084, meaning volatility has exploded alongside the move. That makes the current area interesting. GROVE's 24H volume has also surged into the $5–6M+ range, while market capitalization remains only around $8.8M. Volume approaching the size of the entire market cap tells me liquidity and speculation are now playing a major role in price discovery. But there is another part of the story I don't want to ignore. GROVE is the governance token of Grove Protocol, which operates around stablecoin liquidity and institutional credit allocation within the Sky ecosystem. GROVE has a 10 billion maximum supply, while only about 897 million tokens are currently circulating. That large gap matters when evaluating a move that has already doubled in a very short period. So I’m not treating today's rally as a simple “price is going up, therefore buy” setup. The $0.0100 area is now the psychological battle zone. If GROVE can consolidate above $0.0100 and reclaim the $0.0108 intraday high with sustained volume, the breakout has a better chance of extending. But if price gets rejected around $0.0100–$0.0108 and falls back below $0.0090, I would be much more cautious. After a move this large, a sharp retracement can happen just as quickly as the initial rally. Key figures - Current area: ~$0.0099–$0.0100 - 24H move: roughly +95% - 24H range: ~$0.00488–$0.01084 - 24H volume: ~$5.8M - Market cap: ~$8.9M - Circulating supply: ~897M GROVE - Maximum supply: 10B GROVE Bullish confirmation: Hold above $0.0100, then break $0.0108 with strong volume and defend the breakout on a retest. Bearish confirmation: Rejection from $0.0100–$0.0108 followed by a loss of $0.0090. Current stance: WAIT / BREAKOUT WATCH. Take Profit — only after confirmed breakout - TP1: $0.0115 - TP2: $0.0122 My read: GROVE has genuine momentum, but after a near-100% daily move, the risk is no longer missing the first candle it's chasing the move after the easy liquidity has already been taken. I want to see whether buyers can actually build support above $0.0100. Educational analysis only, not financial advice. $GROVEUSDT #ByXIMPACT #IMPACTbyTrade #WSOT2026
$ETHUSDT is recovering. The bigger question is whether real demand can sustain the move. ETH is trading around $2,350, up roughly 1.5% over the latest 24-hour snapshot. Price has climbed from an intraday low near $2,296 and is now pressing toward the $2,364 resistance area. That is progress, but it is not yet a confirmed trend reversal. The derivatives market shows why this bounce deserves attention. Roughly $28.3 million in ETH short positions were liquidated over 24 hours, compared with about $5.4 million in longs. Open interest is also up around 1%, while funding remains positive. That combination points to short covering alongside a modest increase in futures exposure. However, liquidation-driven buying can lift price quickly without creating lasting spot demand. The next test is whether buyers keep stepping in after the squeeze loses momentum. There is another piece of the story: institutional-flow data has not yet fully confirmed the recovery. The latest complete U.S. spot ETH ETF figures available through October 23 showed approximately $1.18 billion in net outflows for October up to that date. October 23 itself recorded a small net inflow of $4.4 million, but one positive session is not enough to establish a sustained change in demand. This creates a clear conflict: derivatives positioning is helping ETH rebound, while the recent ETF-flow picture remains a headwind. What matters on the chart Resistance sits near $2,364. A convincing break and successful retest would show that buyers are doing more than reacting to forced short closures. On the downside, $2,320 is a nearby area to monitor, while the recent low around $2,296 is the more important line for this recovery. Losing that low would weaken the rebound considerably. Trade map — ETHUSDT - Current stance: BREAKOUT WATCH - Bullish confirmation: Break above $2,364, followed by a hold on retest with stronger spot volume. - Bearish confirmation: Rejection at resistance, followed by a loss of $2,296. - Invalidation: A breakout attempt that quickly falls back below the reclaimed resistance. - TP1: $2,385 - TP2: $2,413 My read: ETH has momentum, but momentum and durable demand are not the same thing. I would not chase the first breakout candle. I want to see price hold above resistance and spot buying support the move before treating this as a stronger recovery. Educational analysis only, not financial advice. #ByXIMPACT #IMPACTbyTrade
GOLD IS TESTING SUPPORT. SILVER IS SHOWING WEAKNESS. THE NEXT MOVE MATTERS. The biggest question in precious metals right now isn't whether gold and silver can recover. It's whether buyers can defend the levels that still matter. GOLD ($XAU): A BOUNCE IS POSSIBLE, BUT THE BOTTOM ISN'T CONFIRMED Gold has broken below its weekly bull-bear trend line and is approaching the lower Bollinger Band. That creates a potential rebound zone, but it doesn't automatically signal a reversal. Key levels: - $4,000–$3,950: First support zone - $3,850: Next downside area if support fails - $4,400–$4,500: Major recovery resistance The 4H structure still suggests another downward leg is possible. Bullish trigger: Buyers defend $3,950–$4,000 and reclaim nearby resistance. Bearish trigger: A sustained breakdown below $3,950 puts $3,850 in focus. Invalidation: A decisive recovery through resistance would weaken the immediate bearish thesis. SILVER ($XAG): THE $53 REACTION IS IMPORTANT Silver has broken below $54 and touched $53. The $49–$53 region is the next support area to watch. If buyers reclaim $54, recovery momentum could improve. If selling pressure continues and support fails, silver could face another leg lower. My trading read: Gold currently offers the more attractive structure to monitor, while silver needs stronger evidence that selling pressure is fading. But here's the distinction that matters: a support zone is a place to watch, not an automatic entry. I want to see price confirmation before choosing a direction. Protecting capital matters more than catching the exact bottom. Which setup would you watch first: a gold support bounce or a silver recovery above $54? $XAUTUSDT $XAGUSDT #ByXIMPACT #IMPACTbyTrade


ROBINHOOD'S CRYPTO REVENUE IS REBOUNDING, BUT ONE NUMBER CHANGES THE STORY Robinhood’s Q3 crypto revenue climbed 20% quarter over quarter to $120M. That looks encouraging until you compare it with last year: revenue is still down 55%. The real development is happening beyond the quarterly rebound. Robinhood Chain generated $26M in its first quarter on mainnet, introducing a new potential revenue driver alongside its existing crypto business. Here’s the important distinction: 1. Recovery: The 20% quarterly increase signals improvement, but it doesn't prove a sustained comeback. 2. Expansion: Robinhood Chain adds another potential growth engine. Its long-term value depends on whether activity and revenue can continue growing. 3. The risk: A 55% annual decline remains significant. One stronger quarter cannot erase the broader slowdown. MY TAKE The next milestone isn't simply another quarter of growth. It's whether Robinhood can turn this rebound into sustained revenue expansion while building a meaningful business around its new chain. For crypto markets, this is worth watching as a signal of how financial platforms are expanding beyond traditional token trading. One quarter shows momentum. Consistent growth will determine whether the recovery is real. $ETHUSDT $HOODXUSDT #ByXIMPACT #IMPACTbyTrade


Bitcoin is sending a mixed signal that matters more than a green 24-hour candle: short liquidations have significantly exceeded long liquidations, yet BTC is still trading below its recent intraday high. BTC is hovering around $80,800, up roughly 1.2% over the latest 24-hour snapshot. Price has traded between approximately $79,500 and $81,300. Buyers have recovered from the lower end of that range, but the market has not yet established a convincing breakout. The derivatives data adds an interesting layer. Around $20.6 million in short positions were liquidated over the latest 24 hours, compared with approximately $5.6 million in longs. That imbalance can help explain upward price pressure as bearish positions are forced to close. But short liquidations are not the same as sustained spot buying, so I want to see whether demand continues after the squeeze fades. Open interest is up roughly 0.9%, while funding remains positive. That suggests futures exposure is still building modestly, with longs paying shorts. It is not an extreme reading by itself, but it means late buyers should be careful about assuming the next move must be higher. The real test is $81,300. A clean break above this recent high, followed by a successful retest and stronger buying volume, would make the recovery more convincing. If BTC keeps getting rejected there, the move could remain a range-bound bounce rather than the start of a fresh trend. Key figures - BTC price: approximately $80,800 - 24H price change: +1.2% - Recent observed range: $79,500–$81,300 - Open interest: $18.64B - 24H OI change: +0.9% - Funding: positive - 24H short liquidations: approximately $20.6M - 24H long liquidations: approximately $5.6M Bullish confirmation: BTC reclaims $81,300 and holds above it on a retest, with follow-through buying rather than liquidation-driven momentum alone. Bearish confirmation: Another rejection near $81,300 followed by a break below $79,500 would put the recovery under pressure. Current stance: BREAKOUT WATCH. I would rather wait for confirmation than chase a move that may have been partly driven by forced short covering. Take Profit — conditional on a confirmed breakout - TP1: $82,000 - TP2: $82,700 My read: the squeeze has helped BTC recover, but the next leg needs real follow-through. The key question is whether buyers can take control after the forced selling ends. Educational analysis only, not financial advice. $BTCUSDT #ByXIMPACT #IMPACTbyTrade
$SPCXXUSDT is approaching a level where buyers need to prove they can do more than defend the price. The SpaceX tokenized stock is trading near $150.07, with the latest 24-hour range around $147.09–$151.53. Price has recovered, but the upper end of that range is still acting as a hurdle. The 4H picture is mixed. RSI is near 48, suggesting momentum has not decisively shifted toward buyers, while several moving averages remain overhead. That makes a breakout more convincing if it comes with stronger trading volume not just a brief wick above resistance. Here’s the level I’m watching: $151.50. - Bullish path: A 4H close above $151.50, followed by a successful retest, could open room toward the next nearby resistance. - Bearish path: Rejection near $151.50 followed by a loss of $149 could bring $147 back into focus. - Invalidation: A sustained move below $147 weakens the short-term recovery structure. Current stance: WAIT / BREAKOUT WATCH. I wouldn’t chase the middle of the range; I’d wait for price to confirm which side is taking control. Take Profit conditional on a confirmed breakout TP1: $153.00 TP2: $155.00 SPCXX tracks a tokenized version of SpaceX equity, so its price can also react to underlying equity-market conditions. It is not the same as owning shares directly. #IMPACTbyTrade #ByXIMPACT #WSOT2026
CHIP has momentum, but there’s a detail I wouldn’t ignore: price is rising alongside a sharp increase in open interest. CHIP is trading around $0.0508, up roughly 12% over the latest 24-hour snapshot. The move has been volatile, with price reaching as high as $0.05725 before pulling back. That tells me buyers are active, but sellers have already shown up after the rally. The derivatives picture makes this more interesting. Open interest recently jumped nearly 50% over 24 hours. That means substantially more futures exposure entered the market, although it doesn't tell us whether those positions are predominantly long or short. With positive funding, long positions are paying shorts, so late buyers should be careful about chasing. The decision zone is $0.0521. A strong 4H close above it, supported by volume, would suggest buyers are ready to attempt another leg higher. If CHIP keeps getting rejected there, a return toward $0.0491 becomes a realistic possibility. Current stance: BREAKOUT WATCH — avoid chasing the spike. - Bullish confirmation: 4H close above $0.0521 and a successful retest. - Support to defend: $0.0491. - Invalidation: A sustained breakdown below $0.0491 weakens the immediate bullish setup. Take Profit — conditional on breakout confirmation - TP1: $0.0546 - TP2: $0.0596 My read: the momentum is real, but rising leverage can amplify both directions. I want confirmation at resistance before treating this as a continuation trade. Educational analysis only, not financial advice. $CHIPUSDT #IMPACTbyTrade #ByXIMPACT #WSOT2026
$HYPEUSDT is recovering, but the next resistance zone will decide whether this is a genuine push higher or just another bounce. After slipping toward $74.40 on October 24, HYPE rebounded into the $78–$79 area. Momentum has improved, with MACD turning positive and RSI near 55 in the latest available technical snapshot. Buyers have a reason to stay interested—but the trend still needs confirmation. Here’s what I’m watching: $78.90–$79.50. HYPE needs to break through this supply zone and hold it on a retest. Without that follow-through, another rejection could send price back toward $77.60, with $76.90 as the next support to monitor. Derivatives data adds another clue: open interest has dropped sharply over the recent tracking window. That suggests leverage has been cleared out, but it also means the rebound needs fresh participation to sustain a larger move. Positive funding alone is not a bullish confirmation. Current stance: BREAKOUT WATCH — no need to chase. Bullish confirmation: A 4H close above $79.50, followed by a successful retest. Bearish warning: A sustained break below $77.60. Invalidation: Failure to hold the breakout zone after reclaiming it. Take Profit — only if the breakout confirms - TP1: $80.50 - TP2: $81.40 I’d rather wait for buyers to prove they can reclaim resistance than assume one rebound has reversed the trend. #IMPACTbyTrade #ByXIMPACT #WSOT2026
XRP has a positioning problem: too many traders are leaning long before the chart confirms a breakout. XRP is hovering around $1.30, caught between nearby support and the $1.32 resistance zone. The rebound looks encouraging on the surface, but the broader daily structure remains weak. One detail deserves attention: recent futures data showed roughly three-quarters of tracked Binance accounts positioned long, while open interest had declined. That combination can reflect positions being closed rather than fresh money confidently entering the market. It is not proof of an imminent drop, but it makes chasing the bounce less attractive. My trading plan: WAIT for the range to break. - Bullish trigger: A strong 4H close above $1.32, followed by a successful retest, would strengthen the recovery case. - Bearish trigger: A decisive break below $1.289 could expose $1.28, with $1.26 as the next major support area. - Invalidation: If XRP breaks above resistance and holds it, the immediate bearish setup loses strength. Take Profit — conditional on a confirmed upside breakout - TP1: $1.34 - TP2: $1.376 Trader's view: I would rather miss the first part of a confirmed move than enter early while the broader trend and crowded positioning remain uncertain. Educational analysis only, not financial advice. $XRPUSDT #IMPACTbyTrade #ByXIMPACT #MyByXTake
$TRIAUSDT I’m Watching Whether This Recovery Can Survive Its First Real Test TRIA has recovered from the $0.00254 area to around $0.00284, gaining roughly 5% over the latest 24-hour period. What caught my attention isn't the green candle itself; it's that buyers are pushing back after a prolonged decline, while the daily trend still hasn't confirmed a reversal. That creates an important conflict. The 4H momentum has improved, with RSI around 62, but the daily RSI remains near 42 and price is still below its key daily moving averages. In other words, short-term buyers are gaining ground, but the broader trend remains vulnerable. The $0.002918 level is where I want to see proof. It aligns with nearby resistance and the daily EMA20. If TRIA breaks through it with stronger volume and holds the level on a retest, the recovery becomes more convincing. A move toward $0.003061 would then be a reasonable next test. There is another detail worth watching: futures open interest has increased around 2% over 24 hours, while funding is positive. Larger futures traders have also shown a more cautious positioning bias than retail accounts. That doesn't predict a reversal by itself, but it means the current bounce could still face resistance from sellers. On the downside, $0.002753 is the first support that matters. Losing it would weaken the recovery and put the recent low area near $0.002574 back in focus. My approach here is straightforward: I would not chase TRIA after its rebound. I want to see whether buyers can reclaim resistance and defend it, rather than simply push price into another rejection. Setup: BREAKOUT WATCH Bullish confirmation: A convincing 4H close above $0.002918, followed by a successful retest. Bearish warning: Rejection at resistance followed by a breakdown below $0.002753. TP — Bullish confirmation scenario: - TP1: $0.003061 - TP2: $0.003268 Invalidation: A failed reclaim followed by sustained weakness below $0.002753 would cancel the immediate breakout thesis. The distinction I’m watching is simple: is TRIA building a base, or is this only a relief bounce inside a larger downtrend? The next resistance test should provide better evidence than guessing the direction now. Educational analysis only, not financial advice. #IMPACTbyTrade #ByXIMPACT #WSOT2026
XAUT is sitting almost exactly where the next move can start to separate itself from the noise: around $4,008. What caught my attention is how tightly price is trading after the recent pullback. The 24H range is only around $3,985–$4,025, which tells me the market is compressing rather than aggressively choosing a direction. For me, $4,000 is the immediate battle zone. If buyers continue defending $4,000 and XAUT pushes through $4,025 with a strong 4H close, I would start looking for continuation rather than assuming the range will hold forever. But I don't want to call a long just because price is sitting near support. A rejection around $4,020–$4,025 followed by a clean loss of $3,985 would change the short-term picture. In that case, the recent consolidation would be breaking to the downside rather than building a fresh base. There is another reason I’m treating this differently from a normal altcoin setup: XAUT is designed to represent ownership of physical gold, so its price is closely tied to the underlying gold market rather than a typical crypto project narrative. That makes the next move in gold itself just as important as the XAUT chart. The current setup is therefore simple: 4H breakout above $4,025 + acceptance = recovery watch 4H breakdown below $3,985 + failed reclaim = downside watch Between those two levels, I’m not forcing a trade. My preference here is patience. Let XAUT show which side can actually take control instead of predicting the breakout before it happens. TP TP1: $4,040 TP2: $4,060 Invalidation: A sustained 4H move below $3,985 weakens the recovery setup. For now, WAIT / RANGE WATCH. The range is tight enough that the breakout direction should give us a much cleaner signal than trying to trade every small candle inside it. $XAUTUSDT #IMPACTbyTrade #ByXIMPACT #WSOT2026


$CAPUSDT I’m Watching the Leverage, Not Just the Green Candles CAP has been moving violently in both directions, and that is exactly why I’m not treating the latest rebound as an automatic long opportunity. The price is hovering around $0.099–$0.100 across market trackers, after an exceptionally wide trading range. The recent rally pushed CAP close to $0.117 before selling pressure returned. For me, the important question is whether buyers can build a base here or whether this is simply another pause before the next liquidation-driven move. One detail stands out in the derivatives data: open interest was reported higher even as price fell sharply, while funding remained positive. That combination suggests leveraged positions were still active during the decline, with long holders paying funding. It doesn't prove that a squeeze is coming, but it does mean a sudden move in either direction could catch overextended traders off guard. The chart now needs to settle down. The $0.095 area is the first support I’m watching, while the $0.103–$0.108 zone represents a meaningful recovery test. If buyers reclaim that resistance area with sustained volume and hold it on a retest, the bullish case becomes more credible. If support gives way, I would rather step aside than assume the dip must bounce. There is another risk that deserves attention: circulating supply is approximately 1.56 billion CAP against a maximum supply of 10 billion. That gap between circulating and maximum supply is worth considering when evaluating rallies, even though it does not tell us when additional tokens will enter the market. My current read: WAIT for confirmation. CAP has enough volatility to reward patience and punish late entries. I want to see price structure improve before committing to a direction. TP — Bullish confirmation scenario: - TP1: $0.109 - TP2: $0.112 Invalidation: A decisive breakdown below $0.095 weakens the recovery setup. The next move matters, but the quality of the move matters more. I’m looking for a confirmed reclaim—not another candle that looks bullish until the next wave of selling arrives. Educational analysis only, not financial advice. #IMPACTbyTrade #ByXIMPACT #WSOT2026
$SOLUSDT keeps coming back to the $100 area, and that is exactly why I’m not treating this as just another random dip. The price is sitting around $100.9, while the market is trying to decide whether $100 becomes a base or another level that eventually breaks. The recent structure is still fragile, but buyers have not completely lost control of the zone. What makes this interesting is the divergence between Solana’s network story and its price action. Alpenglow is now live on mainnet, targeting dramatically faster finality, while tokenized-equity activity on Solana has continued expanding. Yet SOL itself is struggling around $100. That tells me fundamentals alone are not driving this chart right now. The derivatives picture also deserves attention. Recent data shows SOL open interest around $6.32B, down almost 14% over the recent period, while ETF flows have turned negative. Falling OI alongside weak price action suggests leverage has been getting cleared rather than a clean new trend being established. On the chart, $99.5–$100 is the level I’m watching first. If buyers defend it and reclaim $102–$103 with stronger 4H volume, I would start taking the recovery seriously. The next realistic test would be around $105–$107, where sellers could appear again. But I don't want to manufacture a long signal here. If SOL loses $99.5 on a convincing 4H close and then fails to reclaim it, the setup changes completely. In that case, the market could start looking toward the $96–$97 area instead. So my read is simple: WAIT / DECISION ZONE I’m not chasing SOL above $100 just because it is holding support. I want to see buyers prove that $102–$103 can turn into support. Until that happens, the market is still caught between a strong $100 psychological floor and persistent selling pressure above it. Trade map Confirmation: 4H reclaim of $102–$103 with rising volume Key support: $99.5–$100 Breakdown trigger: 4H close below $99.5 followed by failed reclaim TP1: $105 TP2: $107 For me, the next move is less important than the reaction at $100. If buyers finally defend it properly, SOL can start rebuilding. If they don't, I would rather wait for lower support than force a trade. Educational analysis only, not financial advice. #IMPACTbyTrade #ByXIMPACT #WSOT2026

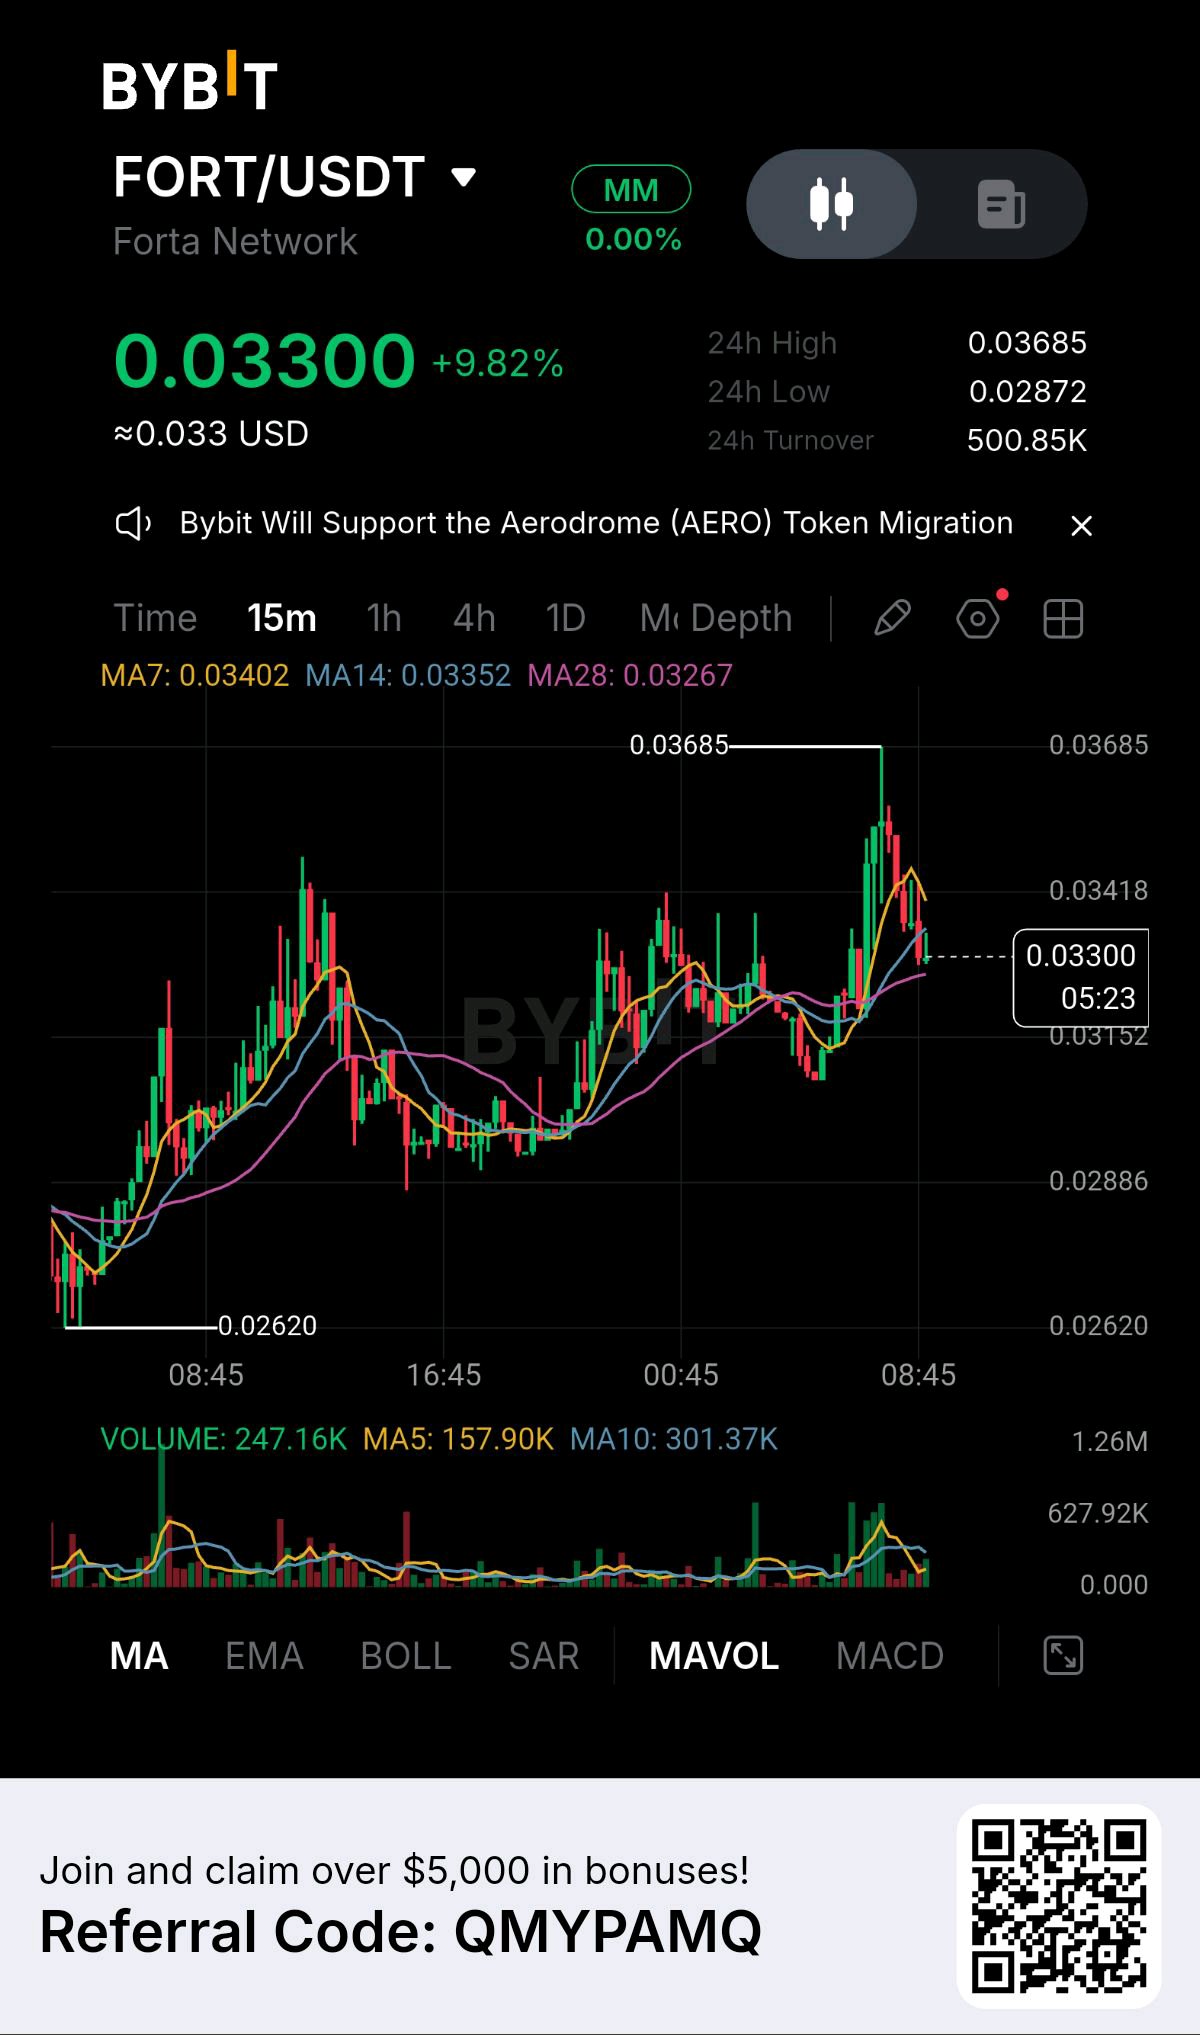
FORTUSDT Momentum Is Back, but Chasing Could Be Risky FORT has made an aggressive recovery, climbing roughly 10% in 24 hours and trading near $0.0322 after bouncing from the $0.0268 area. Trading activity has expanded sharply, showing renewed market interest—but the size of the move also raises the risk of short-term profit-taking. The key detail is the price reaction around the recent high near $0.0347. Buyers have momentum, but they still need to prove they can absorb selling pressure near that level. Another green candle alone is not enough confirmation after such a volatile move. For a continuation setup, I want to see FORT hold above $0.0310–$0.0315 and then reclaim the $0.0328 area with sustained volume. That would strengthen the case for another test of the recent high. If price loses the $0.0300 area, the recovery could weaken and a deeper retest toward $0.0285 becomes possible. FORT is associated with decentralized Web3 security, giving the token a clear use-case narrative. Still, the current move is a market-structure trade—not proof that fundamentals have suddenly changed. My trading read: BREAKOUT WATCH. I would avoid buying directly into resistance. A confirmed breakout or a controlled pullback that holds support offers a more disciplined entry than chasing the spike. TP — Bullish confirmation scenario: TP1: $0.0347 TP2: $0.0360 Invalidation: A sustained move below $0.0300 weakens the immediate bullish setup. Educational analysis only, not financial advice. $FORTUSDT #IMPACTbyTrade #ByXIMPACT #WSOT2026
$BTCUSDT JUST FAILED TO CLEAR $85K — AND THAT MATTERS Bitcoin’s rejection near $85K hasn’t fully flushed the leverage from the market. Glassnode data shows longs are still paying elevated funding, while futures open interest remains around $37.5B. That creates an interesting setup: $85K remains the key reclaim zone. If BTC breaks back above $85K with OI rising alongside spot demand, the trapped positioning could fuel another upside attempt. But if price keeps rejecting $85K while leverage stays elevated, another flush becomes increasingly likely. My read: don’t chase the first move. Watch how BTC reacts around $85K and whether leverage starts clearing. BREAKOUT = continuation watch REJECTION = leverage flush risk $82K remains an important downside area $ETHUSDT #IMPACTbyTrade #ByXIMPACT