
Robin
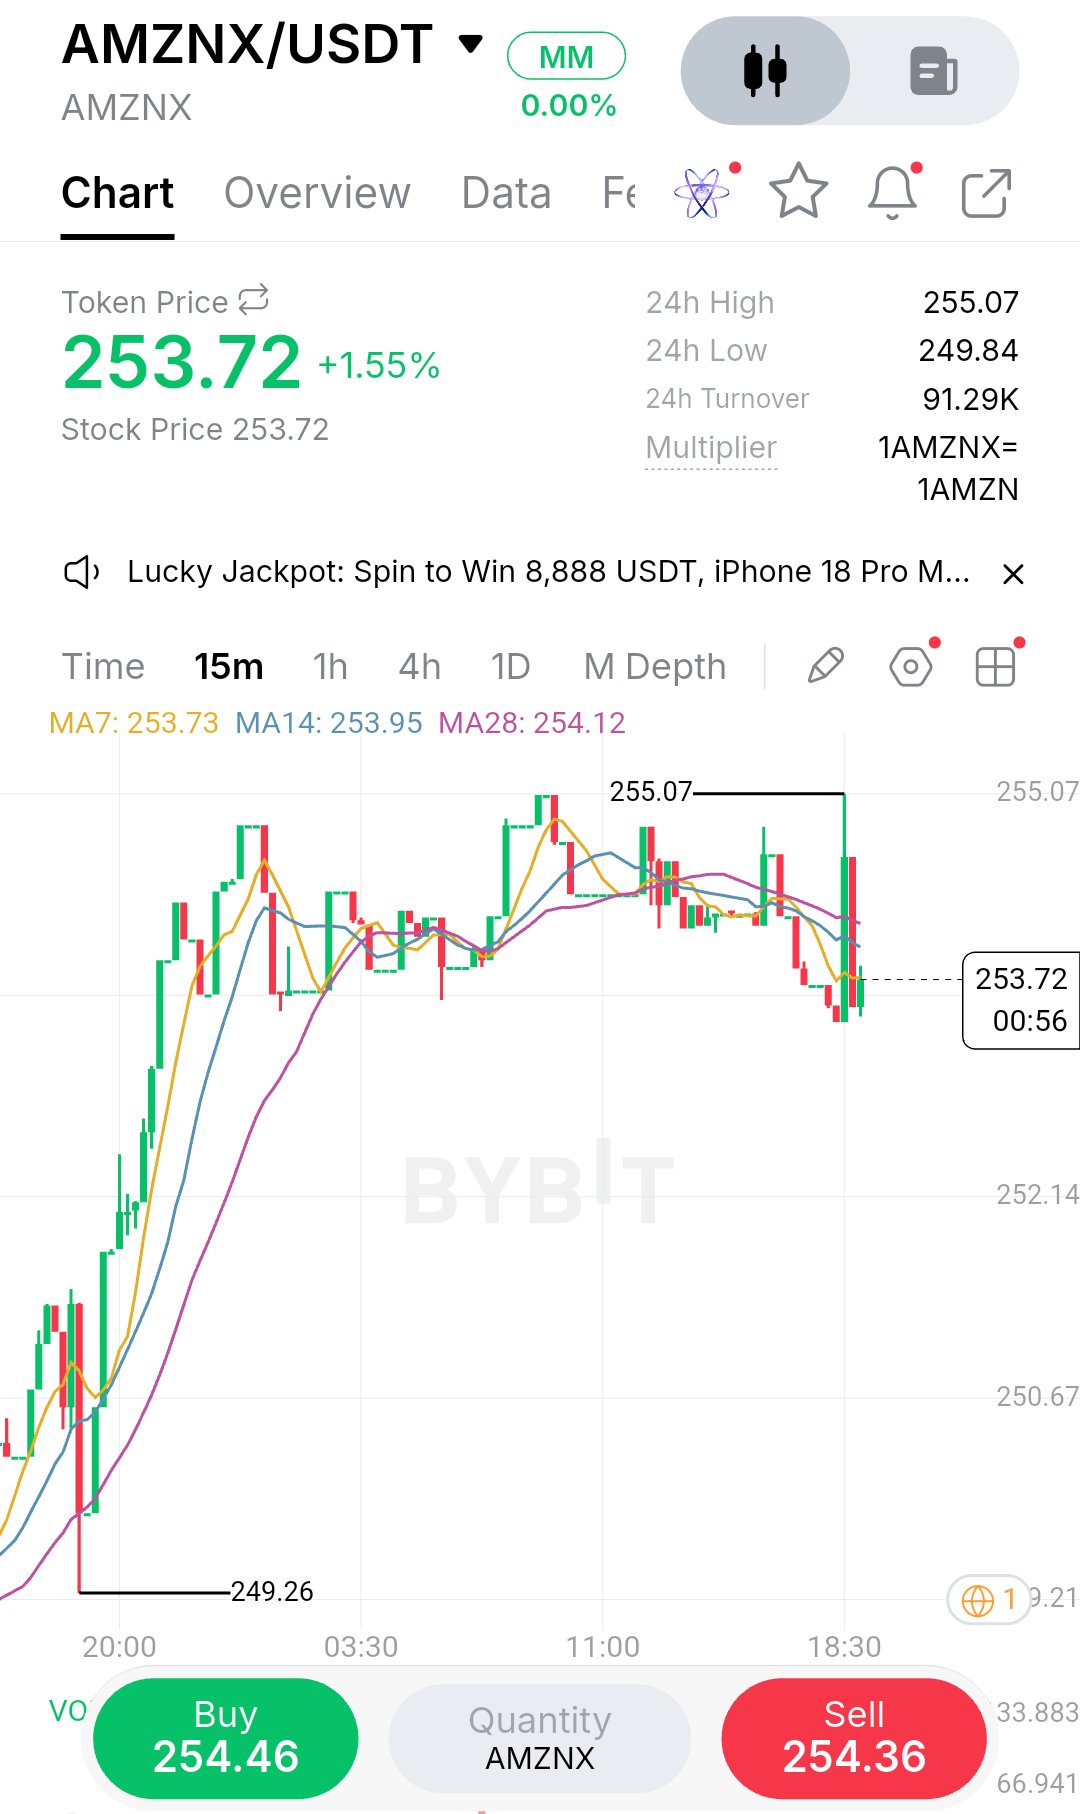
What caught my attention here wasn't the initial rally, but the way price is currently hesitating right below the 255.07 ceiling. I’ve seen this exact structure many times before: a strong impulsive push from 249.26, followed by a slow, grinding consolidation. This is where impatient traders get chopped up because they either buy the top of the range expecting a breakout, or they short the middle of the range because they think the momentum has died. Looking at the 15m chart, the market regime has clearly shifted from a strong uptrend into a short-term distribution or compression phase. The move from 249.26 to 255.07 was sharp and decisive, but since tagging that high, price has printed a series of lower highs and higher lows. It’s essentially building a tight range between roughly 252.50 and 255.07. What matters most right now is the moving average cluster. The MA7 at 253.73 and MA14 at 253.95 are starting to flatten out, while the MA28 at 254.12 is acting as immediate dynamic resistance above the current price of 253.72. The single most important feature of this chart is the rejection at the 255.00 psychological level. Price tried to break higher and got slammed back down, leaving a wick. Now, we are sitting right at the lower boundary of this micro-range. I don't see a clean, high-conviction entry at this exact moment because the current candle is sitting mid-structure relative to the MA cluster. To me, this is a wait scenario until price shows its hand at the edges of this range. If I am looking for a long, I want to see price sweep the local liquidity near 252.50 and immediately reclaim the MA28 at 254.12. That would be a classic liquidity sweep and reclaim, trapping early shorts and confirming that buyers are still defending the trend. On the flip side, if price breaks down below 252.50 and retests it as resistance, the short scenario becomes viable, targeting a fill of the inefficiency down toward 250.67. Right now, the bullish structure is still technically intact, but momentum is waning. Here is my disciplined plan based on this structure: Bias: Wait (favoring a long on a confirmed reclaim) Entry Zone: 253.80 to 254.20 (only after a 15m close above the MA28) Confirmation: A clean sweep of 252.50 followed by a strong 15m bullish engulfing candle that closes above 254.12. Stop Loss and Invalidation: 252.30 (a break below the recent swing low invalidates the higher-low structure). Take Profit 1: 255.07 (recent high) Take Profit 2: 257.50 (next psychological resistance) Take Profit 3: 259.00 (extension target) Risk/Reward: Approximately 1:2.5 if entering at 253.90 with a stop at 252.30. I’ve learned the hard way that trading the middle of a compression range is just gambling. The risk here is getting chopped up by the moving averages. If price just slowly bleeds through the MAs without a clear rejection or volume spike, the setup is dead. The invalidation is strict: if we get a 15m close below 252.30, I am canceling this long idea entirely and waiting for a lower structure. I’d rather miss a breakout than force a trade in this chop. Are you waiting for the edge of the range, or are you already positioning for the next leg up? $AMZNXUSDT #ByXIMPACT
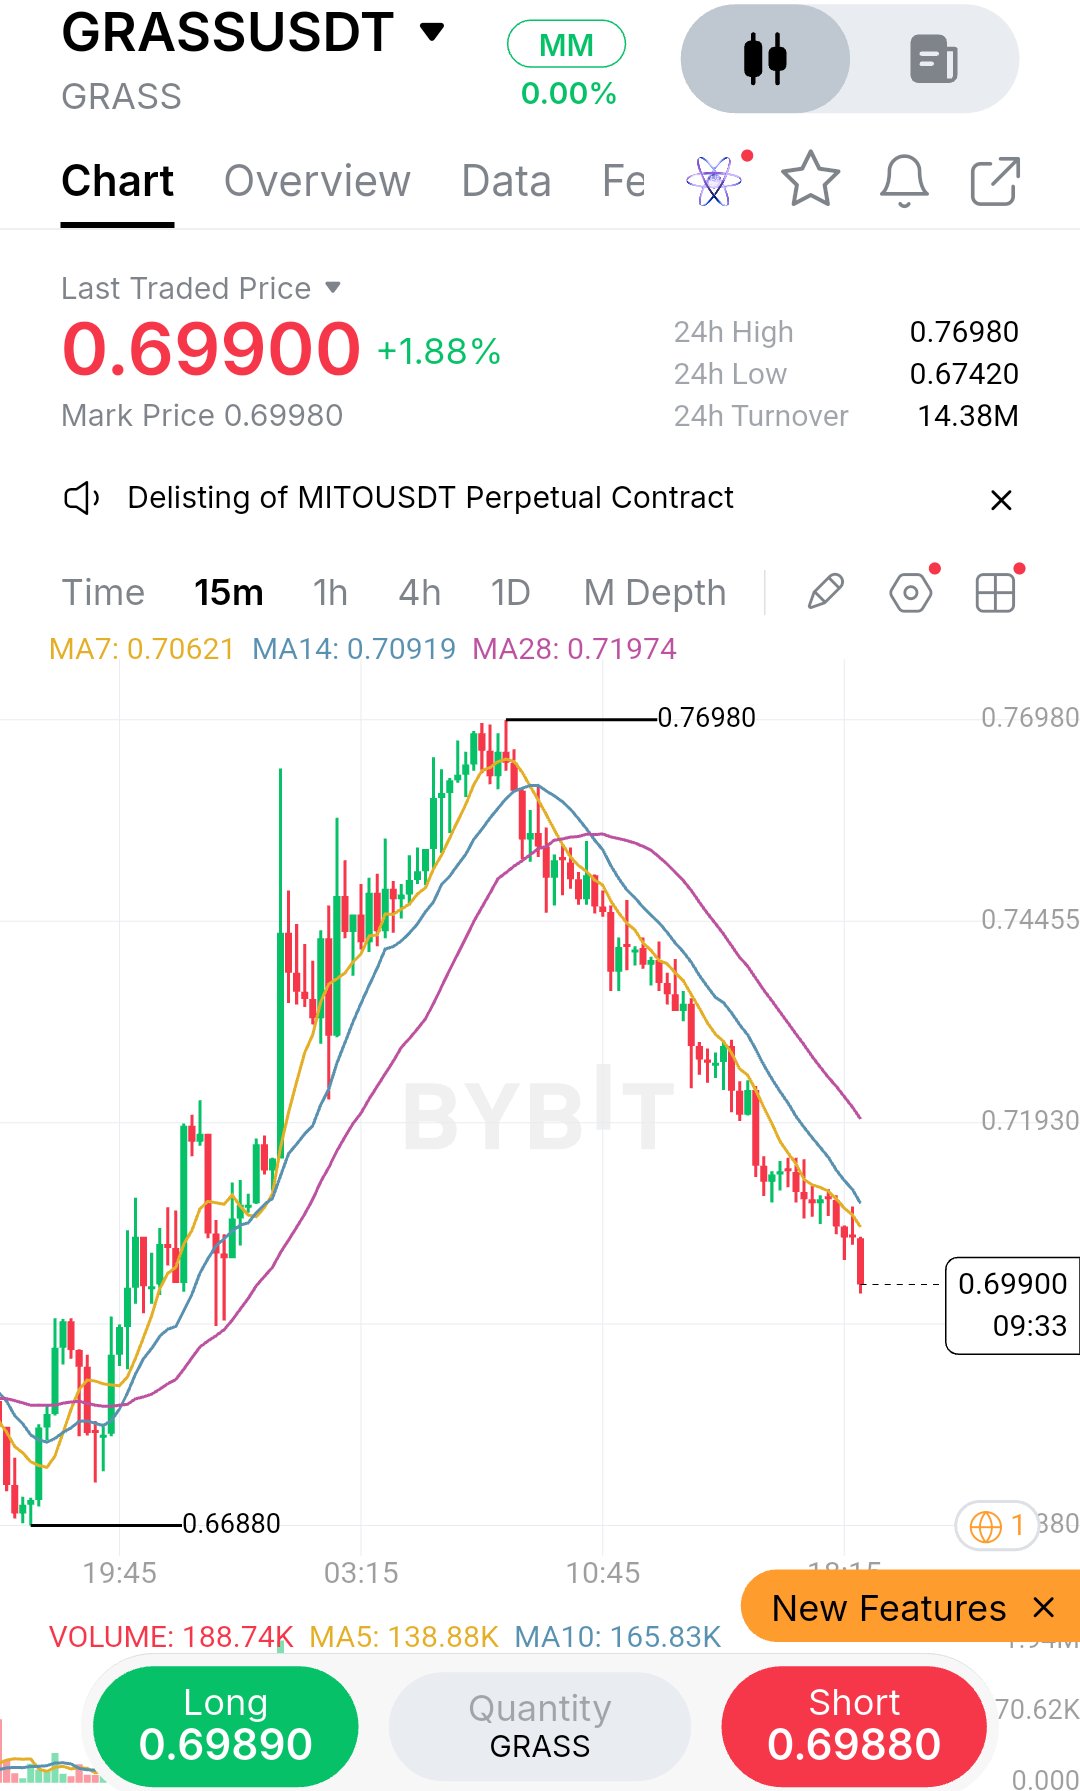
What caught my attention here isn’t the +1.88% daily bounce, but the heavy structural damage on the 15m chart. We’ve clearly shifted from an aggressive uptrend into a sharp distribution phase, dropping from the 0.76980 high down to current levels around 0.69900. The price is currently printing lower highs and lower lows, and the short-term moving averages (MA7, MA14, MA28) are acting as dynamic resistance, pressing down on the price. My read is that the immediate momentum is bearish. The volume profile shows the selling pressure is consistent, and the recent attempt to recover has been weak. However, I wouldn’t chase a short right here at 0.69900. Why? Because we are sitting just above a potential liquidity pocket near the 0.67420 area (the 24h low). Retail traders are likely placing stops below that recent swing low, and the market makers might want to sweep that liquidity before any meaningful reversal. Personally, I’d rather wait for a decisive reaction at the extremes. If price bounces weakly into the 0.70500–0.71000 resistance zone and gets rejected, that’s a clean short continuation. Conversely, if we sweep 0.67400 and print a strong reversal candle with volume, that’s a potential long scalp. Until then, the middle ground is a trap. Trade Plan (Scalp / Swing) · Bias: WAIT (Bearish lean, but avoiding mid-range entries). · Entry: Conditional. · Short: Trigger on a confirmed rejection at $0.70600–$0.71000. · Long: Trigger on a liquidity sweep of $0.67400 followed by a strong 15m reclaim. · Confirmation: For shorts, I need to see a clear lower high form in the resistance zone with a strong bearish close. For longs, a rapid reclaim of $0.68000. · Stop / Invalidation: Shorts invalidate above $0.71900 (near MA28). Longs invalidate below $0.66800 (the major structural low). · TP1: $0.68000 (mid-range support). · TP2: $0.67400 (liquidity sweep target). · TP3: $0.66200 (extension if structure breaks). · R:R: Roughly 1:2.5 if the short confirmation triggers. The biggest risk right now is chop. We are in a narrow zone where a sudden spike can trigger both sides. I’d stay patient and let the candle close before acting. If price pushes straight up past 0.71900 without a retest, my short thesis is dead, and I’ll stand aside. Are you watching that 0.67400 liquidity level, or do you think the 0.70 psychological support holds from here? $GRASSUSDT #ByXIMPACT
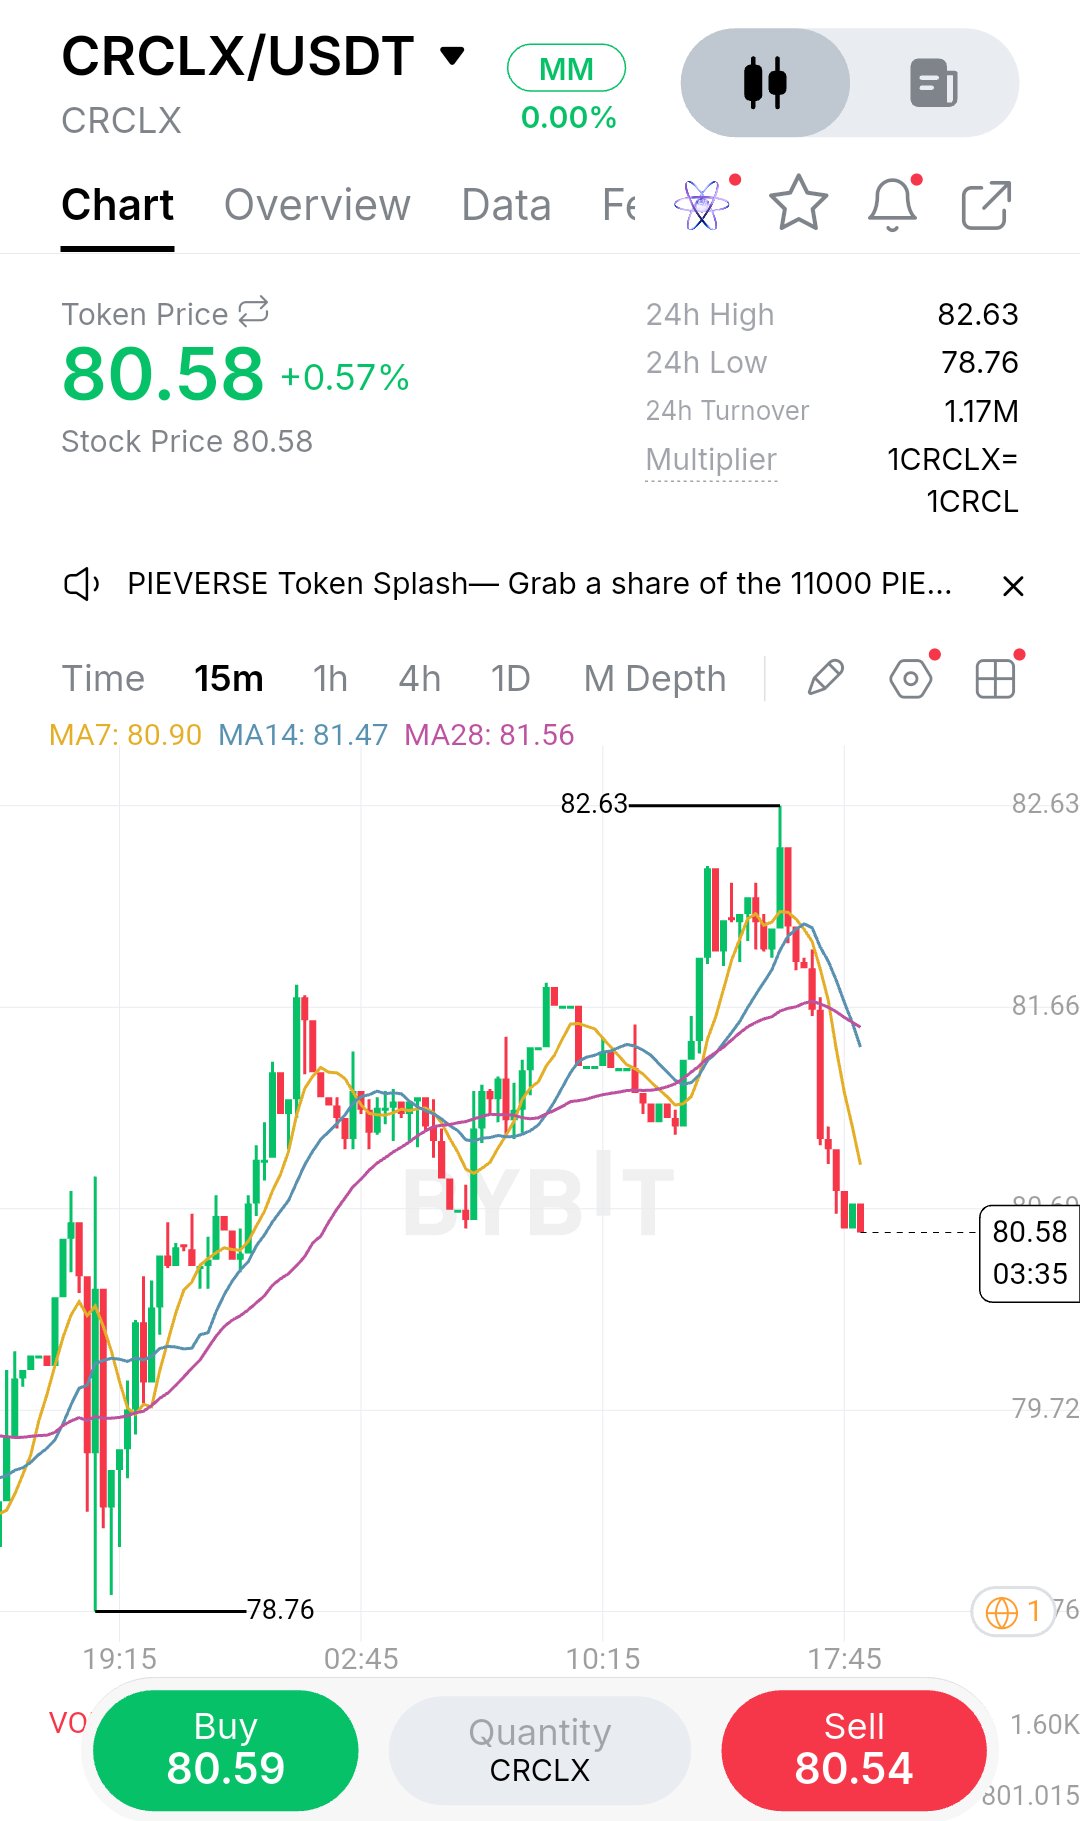
What caught my attention here is how quickly the narrative flipped on this 15-minute chart. We just saw a strong push up to 82.63, which looked like a potential breakout, but the rejection was immediate and brutal. Price didn’t just pull back; it sliced straight through the moving averages and is now sitting heavy around 80.58. The 24-hour high is 82.63, but the reality right now is that the last few candles show sellers completely in control, pressing the price down with very little buying pressure to absorb the supply. This is a classic failed breakout scenario. Retail traders often see a new high and immediately chase the green candles, expecting a continuation. But when you look at the structure here, the push to 82.63 lacked follow-through. It was a liquidity grab. Sellers waited for the breakout buyers to enter, then aggressively sold into that demand, trapping the late longs. Now, those buyers are underwater, and the moving averages—the MA7, MA14, and MA28—are all turning down and acting as dynamic resistance overhead. The current bounce looks weak, and I wouldn't be surprised to see another leg down to clear out the remaining optimists. My read is that this is a short-term distribution phase. The market is telling us that the buyers are exhausted at the top. The part I like about this short setup is the clear invalidation level. If price can reclaim the 82.63 swing high with a strong body close, my bearish thesis is dead, and I'll step aside. Trade Plan Bias: SHORT Entry: 80.70 – 81.20 (on a weak retest of the moving averages) Confirmation: A rejection wick or bearish engulfing candle on the 15m timeframe in the entry zone. Stop / Invalidation: 81.80 (above the recent lower high and MA cluster) TP1: 79.72 (recent support level) TP2: 78.76 (the major swing low and liquidity pool) TP3: Open (trail stop if momentum accelerates) R:R: Approximately 1:2.5 based on entry and TP2. The biggest risk here is a sudden bid coming in that traps the shorts. If price starts consolidating sideways above 81.00 instead of dropping, that’s a warning sign that the bears are losing momentum. I wouldn't chase the short right at the bottom of this current candle; I’d rather wait for the retest of the MA zone to get a better entry and a tighter stop. I’m also watching how the price reacts to the 80.00 psychological level. If it breaks that, the next stop is likely the 78.76 low. Until then, I’m keeping my risk tight and my expectations realistic. What’s your read on this structure? Are you expecting a bounce from here, or do you see the same failed breakout setup? $CRCLXUSDT #ByXIMPACT
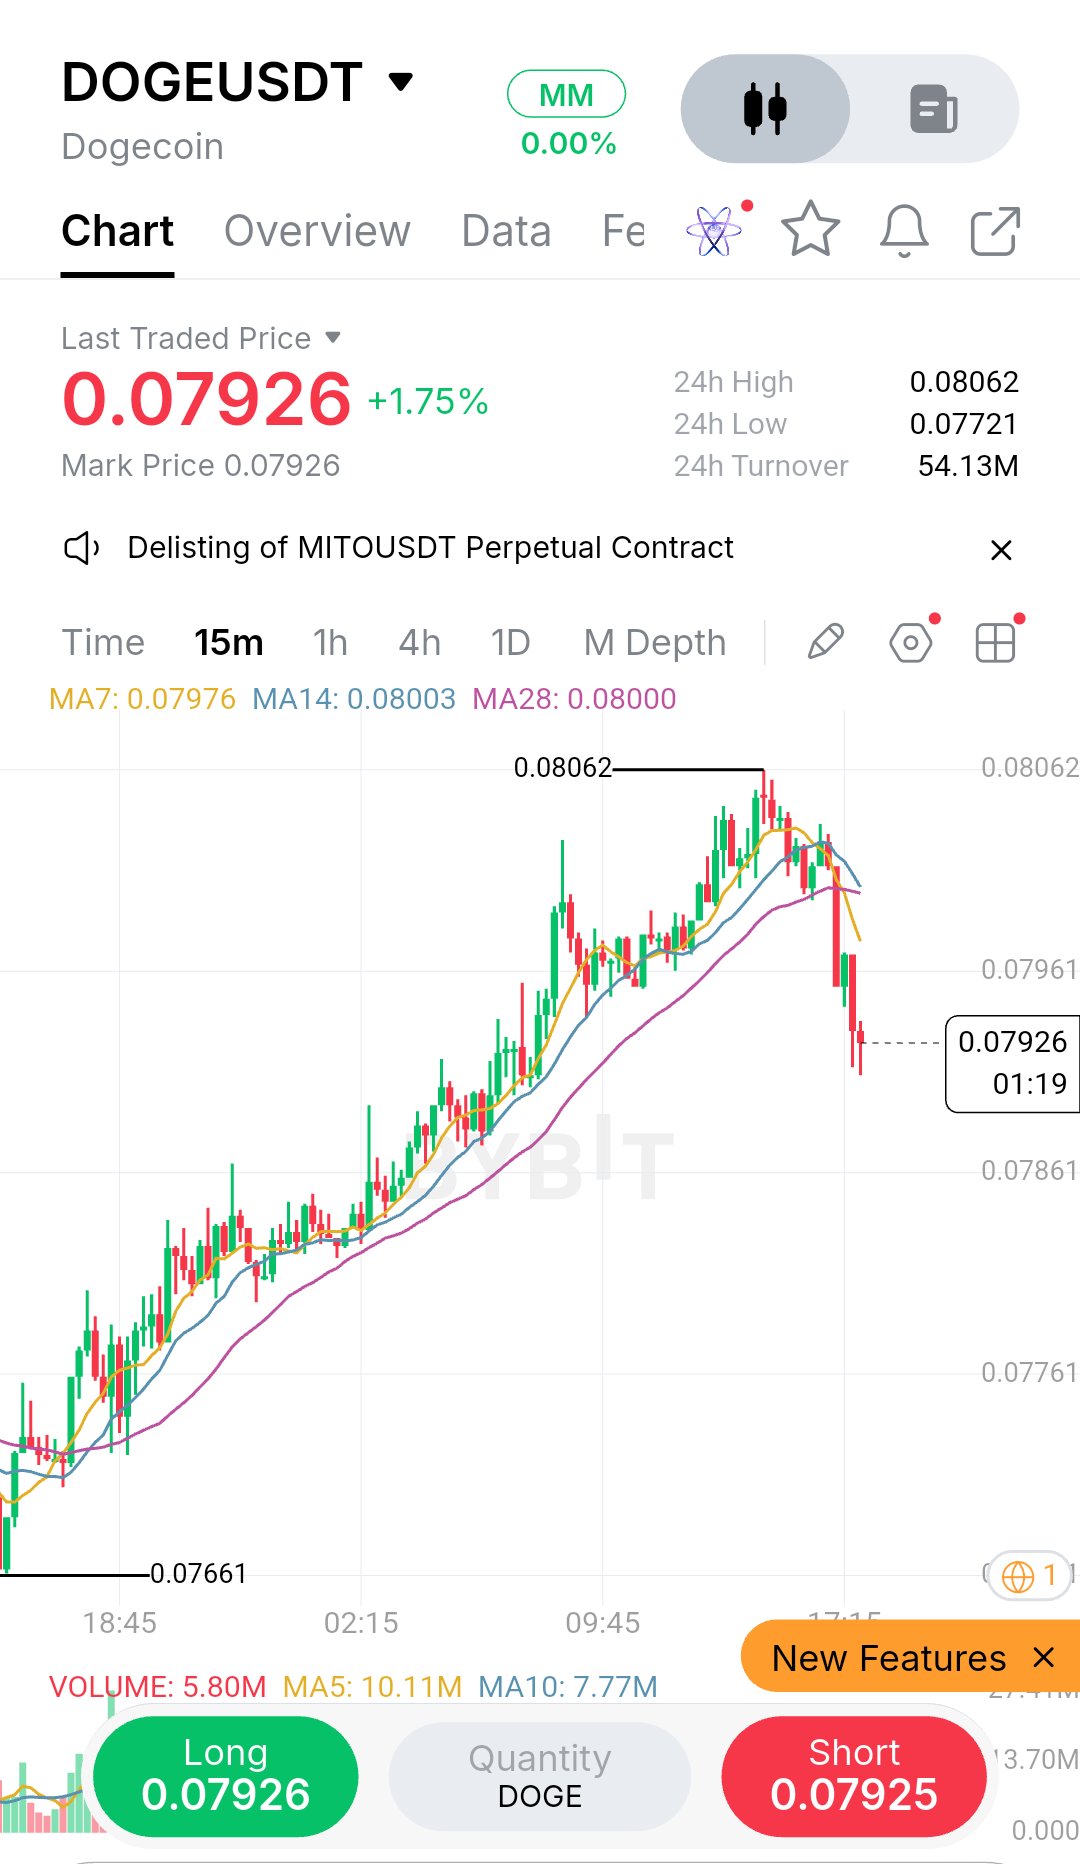
What caught my attention here is how quickly DOGE gave back its gains after tagging that 0.08062 local high. On the 15m chart we had a steady grind higher, but that last push looks like a classic liquidity grab above the recent range before sellers stepped in aggressively. The sharp red candle that followed is not just a pullback, it is a structural warning that momentum has shifted. Right now price is sitting at 0.07926, just below the 7, 14 and 28 moving averages which have all clustered around 0.0798 to 0.0800. That cluster is now acting as dynamic resistance. The market structure on this timeframe has shifted from higher highs and higher lows to a potential lower high. The 24h high at 0.08062 is the key level bulls need to reclaim to invalidate the bearish bias. Until then rallies into that 0.0798 to 0.0802 zone look like selling opportunities. I am watching the 0.0786 level closely as immediate support, but the real structural floor is the previous swing low around 0.0776. If that breaks we could see a faster move down toward the 0.0766 area. The volume profile shows a spike on the sell off which confirms that this was not just profit taking, there was real supply hitting the market. Trade Plan Bias: SHORT on a confirmed breakdown or rejection Entry Zone: 0.0795 to 0.0800 on a weak retest of the MAs Confirmation: A 15m close below 0.0786 with increasing volume, or a clear rejection wick at 0.0800 followed by a lower high Stop / Invalidation: 0.0807 above the recent high TP1: 0.0786 TP2: 0.0776 TP3: 0.0766 R:R: Approximately 1 to 2.5 if entry is at 0.0798 and stop at 0.0807, targeting TP2 Personally I would not chase the current candle. The risk I am most concerned about is a fake breakdown. If price sweeps 0.0786 and immediately reclaims 0.0795 the short thesis is dead. That is why I want to see a confirmed close below support before acting. If price instead breaks and holds above 0.0802 I would flip to a neutral stance and wait for a higher low to consider longs. The part I like about this setup is the clean invalidation. The stop is tight and the targets are logical structural levels. But discipline matters here. If the market chops between 0.0786 and 0.0800 I would rather sit on my hands than force a trade. Are you watching the same 0.0800 resistance, or do you see a different structure forming? $DOGEUSDT #ByXIMPACT
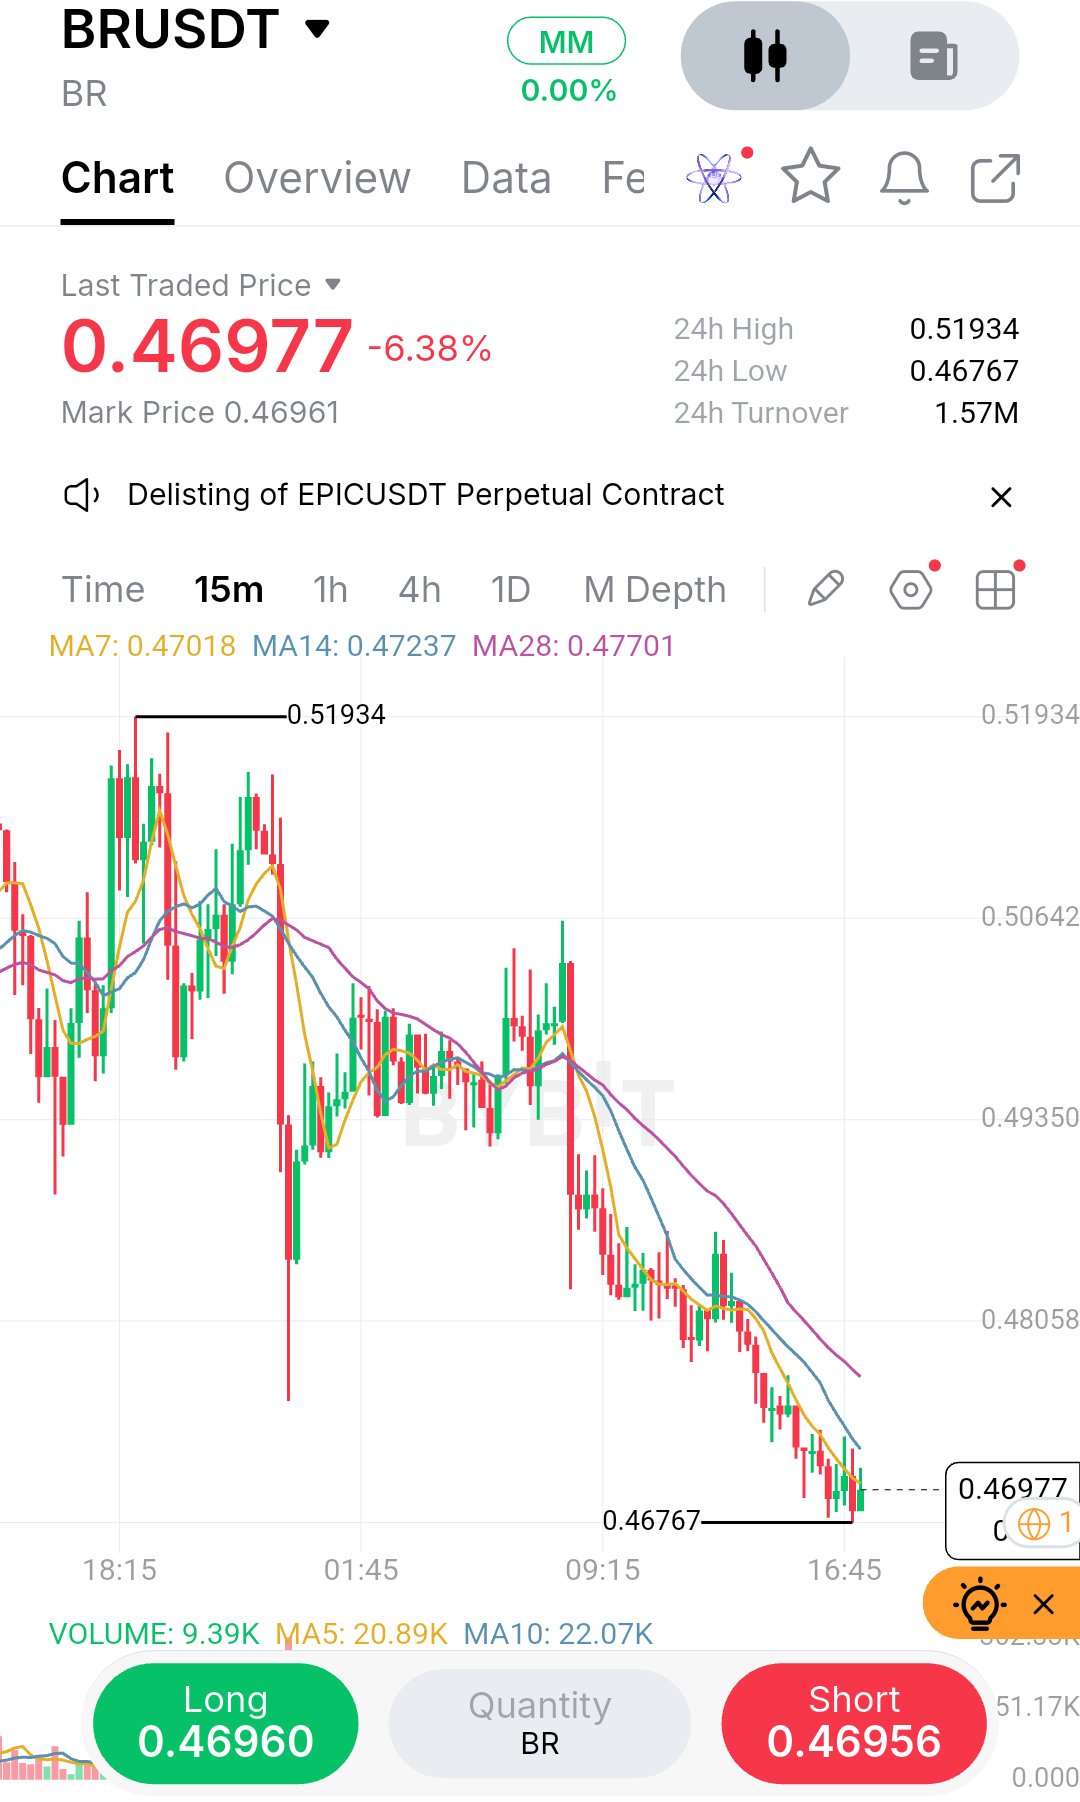
Watching a chart bleed out on a lower timeframe is tricky because the urge to catch a falling knife is always strong, but the structure here tells me patience is the better trade. On this 15m BRUSDT chart, I'm seeing a relentless series of lower highs and lower lows from the 0.51934 peak. Price is currently pinned near the 24h low at 0.46767, and the 7, 14, and 28 MAs are fanning out downwards, acting as dynamic resistance. The momentum is clearly heavy, and trying to catch a long right here without a structural shift feels like guessing. My primary read is bearish continuation, but I wouldn't chase this breakdown at the current price of 0.46977. Instead, I want to see a relief bounce into the 0.472–0.477 zone. That area lines up with the 14 and 28 MAs, which should act as strong supply. If price pushes up into that pocket and gets rejected, that's my trigger to short. My stop goes just above the 0.4800 handle, as a clean break there would signal a shift in momentum. For targets, I'm looking at 0.4600 first, then the recent low at 0.46767, and potentially 0.4550 if the selling pressure accelerates. Bias: SHORT Entry: $0.472 – $0.477 (on rejection) Stop / Invalidation: $0.4805 TP1: $0.4600 TP2: $0.4550 TP3: $0.4480 The main risk here is a sudden liquidity sweep below 0.46767 that sparks a rapid V-shaped reversal. I've seen those traps catch out late shorts. I'd wait for the retest, manage risk tightly, and if the bounce reclaims 0.4800 with volume, the thesis is dead and I'm out. Are you watching for a bounce here, or expecting a breakdown? $BRUSDT #ByXIMPACT
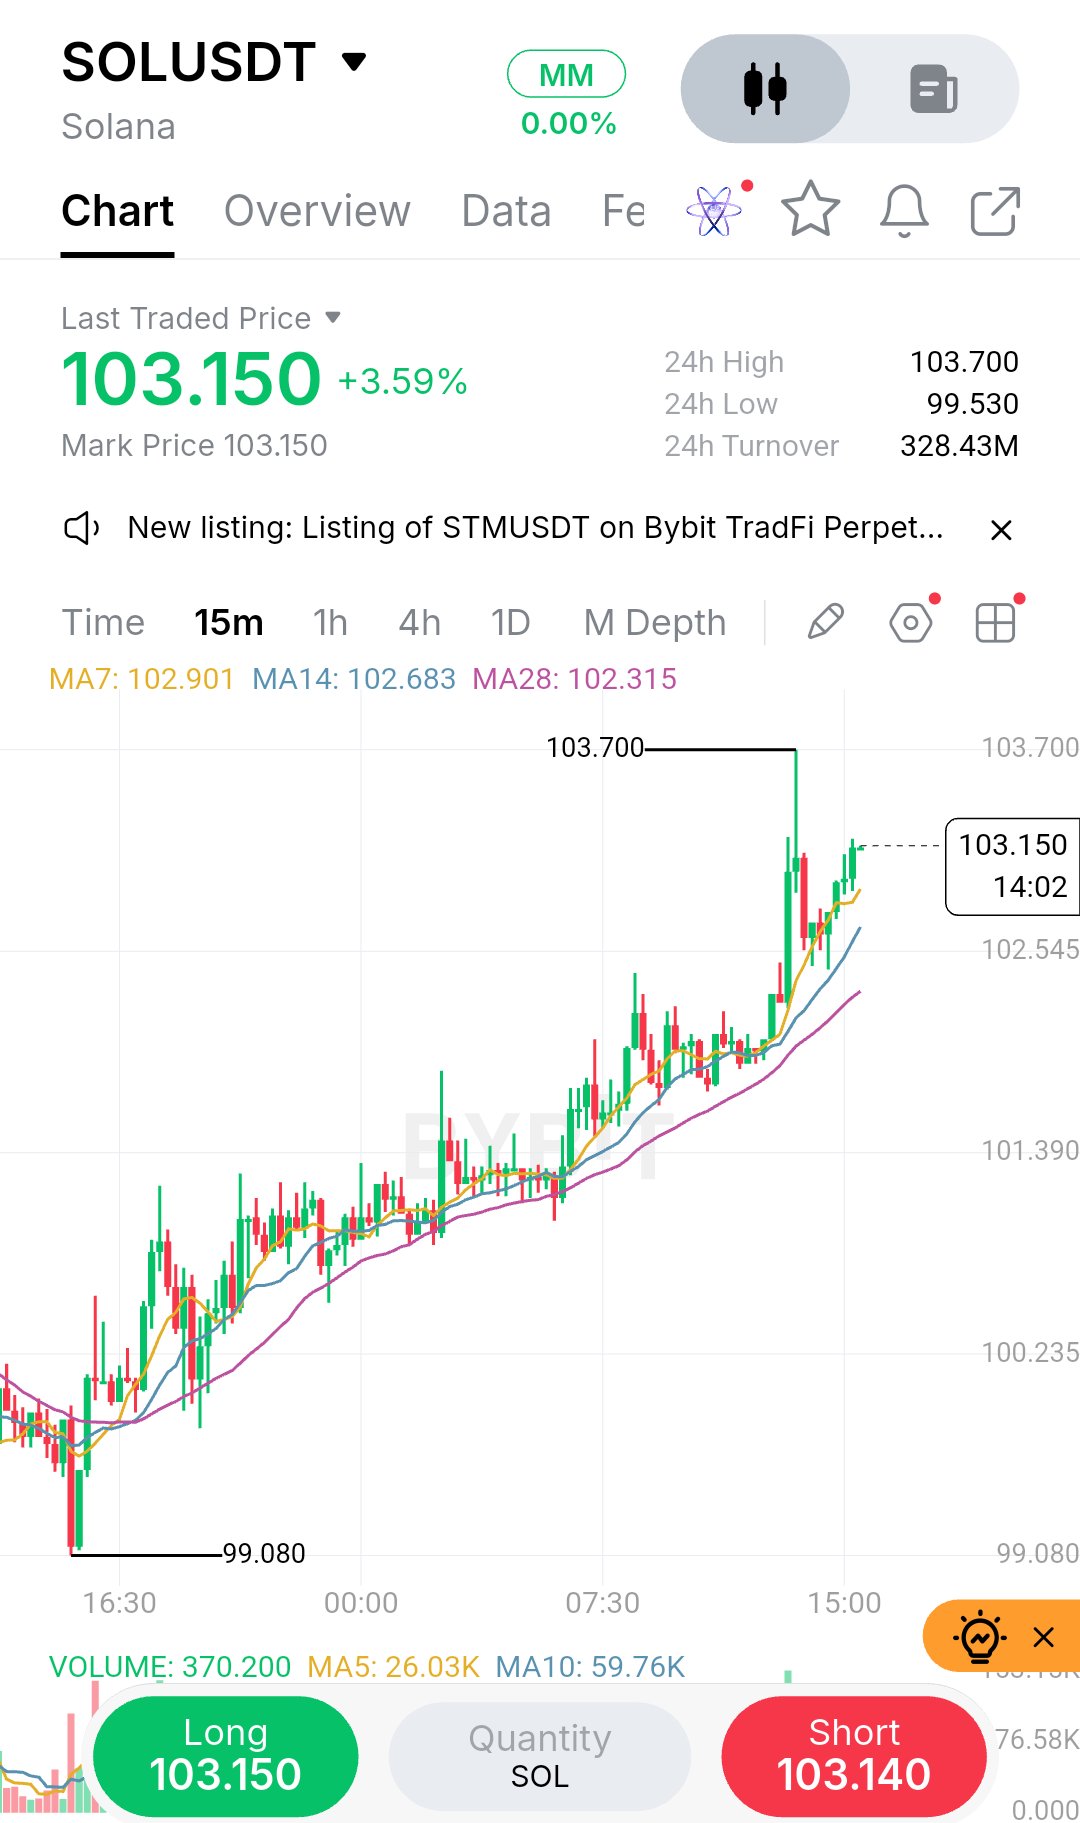
I’m usually skeptical of buying into a vertical candle, but the way SOL is stepping up here has my attention. On the 15m chart, we have a clean sequence of higher highs and higher lows since the sweep down to 99.08. The structure is undeniably bullish, and price is holding above all the key moving averages (MA7, MA14, MA28). What I don’t like is chasing the current price of 103.15 right into the 103.70 local resistance. That’s where early longs might take profit. My read is to be patient and wait for a minor pullback to the 102.90–103.00 zone, letting the 7 and 14 MAs catch up. If buyers defend that area, it gives us a much safer entry to target a breakout above 103.70 and eventually the psychological 105.00 level. If we lose 102.60, the immediate uptrend is broken, and I’d stand aside. Bias: LONG (on pullback) Entry: 102.90 – 103.00 Confirmation: Bullish rejection candle (pin bar/engulfing) on the 15m at the entry zone. Stop / Invalidation: 102.60 (below the recent consolidation and MA14) TP1: 103.70 (local high) TP2: 105.00 (psychological level) TP3: 106.50 (next structural target) R:R: Approx 1:3.5 to TP2 The biggest risk is a sudden rejection at 103.70, creating a double top. I won't move my stop if price dips; I'll just accept the loss if it hits. Are you waiting for the retest, or do you prefer buying the momentum breakout here? $SOLUSDT #ByXIMPACT
What caught my attention here is the sharp V-shaped recovery on this 15m ETHUSDT chart. After sweeping the $2,296 low, price aggressively pushed through resistance to tag a fresh local high at $2,386. The momentum behind this move is undeniable, and the market structure has clearly shifted from that earlier consolidation phase into a strong bullish trend. The higher highs and higher lows are now well-defined, and the 15-minute timeframe shows buyers defending every minor dip. While the momentum is clearly bullish, it's important to note that the 24h high and current price ($2,371) are nearly identical. The last few candles are starting to show some hesitation right at the top, which tells me I wouldn't want to chase this move right here. Chasing a vertical move like this usually leads to poor risk-to-reward, as a sudden pullback can easily stop you out before the trend continues. My read is that the broader structure has shifted bullish, but we are likely due for a pullback to test the moving averages. The MA7 ($2,370), MA14 ($2,361), and MA28 ($2,358) are tightly bundled below, acting as dynamic support. I’d rather wait for price to cool off and retest this zone to see if buyers step back in. This area is my primary point of interest because it offers a logical level for a bounce with a tight invalidation point. Trade Plan Bias: Long (on retest) Entry Zone: $2,360 – $2,366 (the MA cluster) Confirmation: A successful retest, showing rejection wicks or a bullish reversal candle in this zone. Stop / Invalidation: $2,345 (A clean break below the moving average cluster and the recent minor swing low). TP1: $2,386 (Recent local high) TP2: $2,400 (Psychological round number) TP3: $2,415 (Next potential liquidity zone) The main risk here is a failed breakout. If the price rejects hard at $2,386 and the moving averages start to curl downward, the bullish thesis is likely dead. I’d definitely cancel the trade if we break and close below $2,345. Patience is key here; letting the price come to your level is always better than forcing an entry at the top. Are you guys waiting for the pullback to the MAs, or are you already in a position? $ETHUSDT #ByXIMPACT

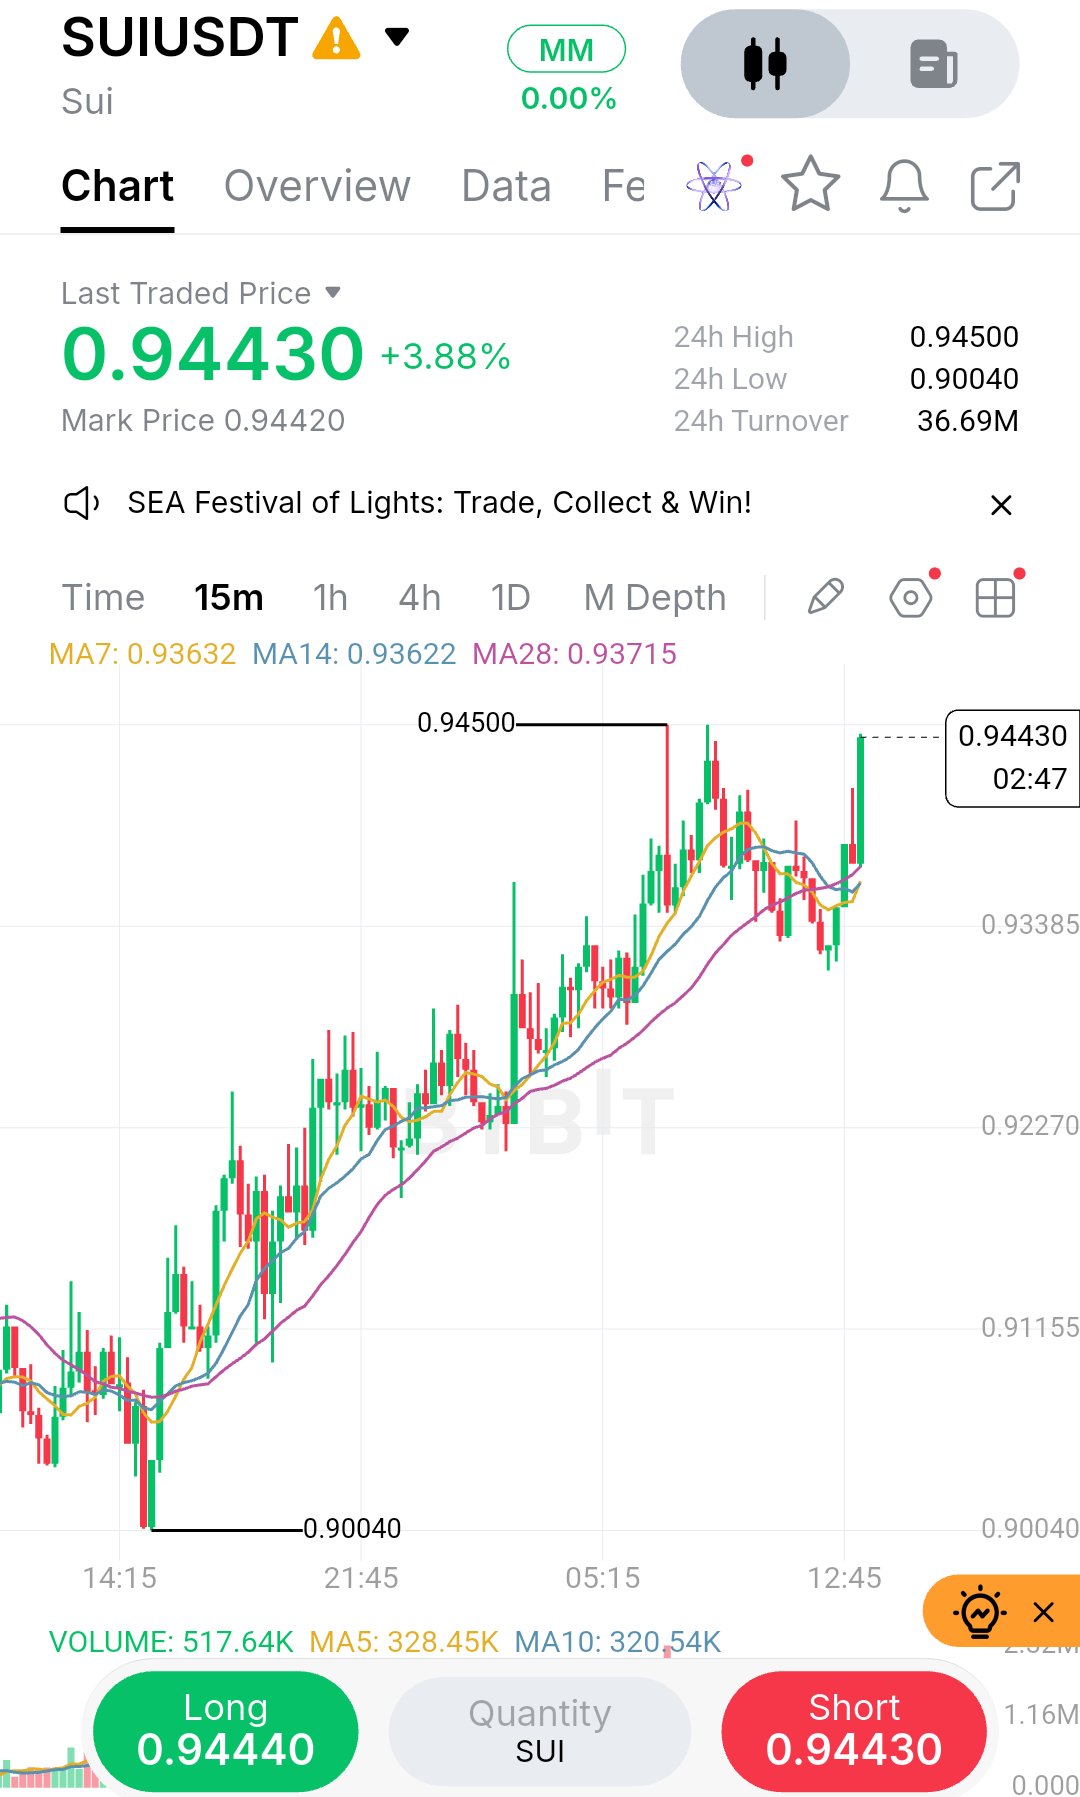
What caught my attention on this 15m SUI chart is the way price has stair-stepped from the $0.900 bottom, and we’re now pressing right up against a familiar ceiling. The structure is clearly bullish, printing consistent higher highs and higher lows with the moving averages fanning nicely underneath. However, price is currently tagging the $0.9445 resistance—the exact level that rejected the previous swing high. The volume spike into this level shows buyers are aggressive, but I’m wary of blindly chasing a long right into a resistance wall. If you look closely at the moving averages, the 7, 14, and 28 periods are tightly clustered around $0.936, which tells me the market is compressing and building energy for its next directional move. That compression often precedes an explosive breakout, but it can just as easily resolve into a fakeout if buyers lack follow-through. My read is that we need to see how the candle closes here. If it breaks and retests, that’s my cue. Trade Plan Bias: LONG (on confirmed breakout) Entry Zone: $0.945 - $0.948 (only after a strong 15m close above this level) Confirmation: A clean break, followed by a hold of the $0.944 area as new support. Stop / Invalidation: $0.9335 (just below the recent local structural low) TP1: $0.958 TP2: $0.968 TP3: $0.982 R:R: Approximately 1:3 at TP2 The primary risk here is a false breakout—a quick wick to $0.95 followed by a harsh rejection back into the range. That’s why I’m not entering blindly; I’d rather wait for a retest to confirm the support is real before stepping in front of it. If price drops back below $0.935, the setup is dead and I’d stay out. Are you trading the breakout here, or waiting for a deeper pullback to $0.93? $SUIUSDT #ByXIMPACT
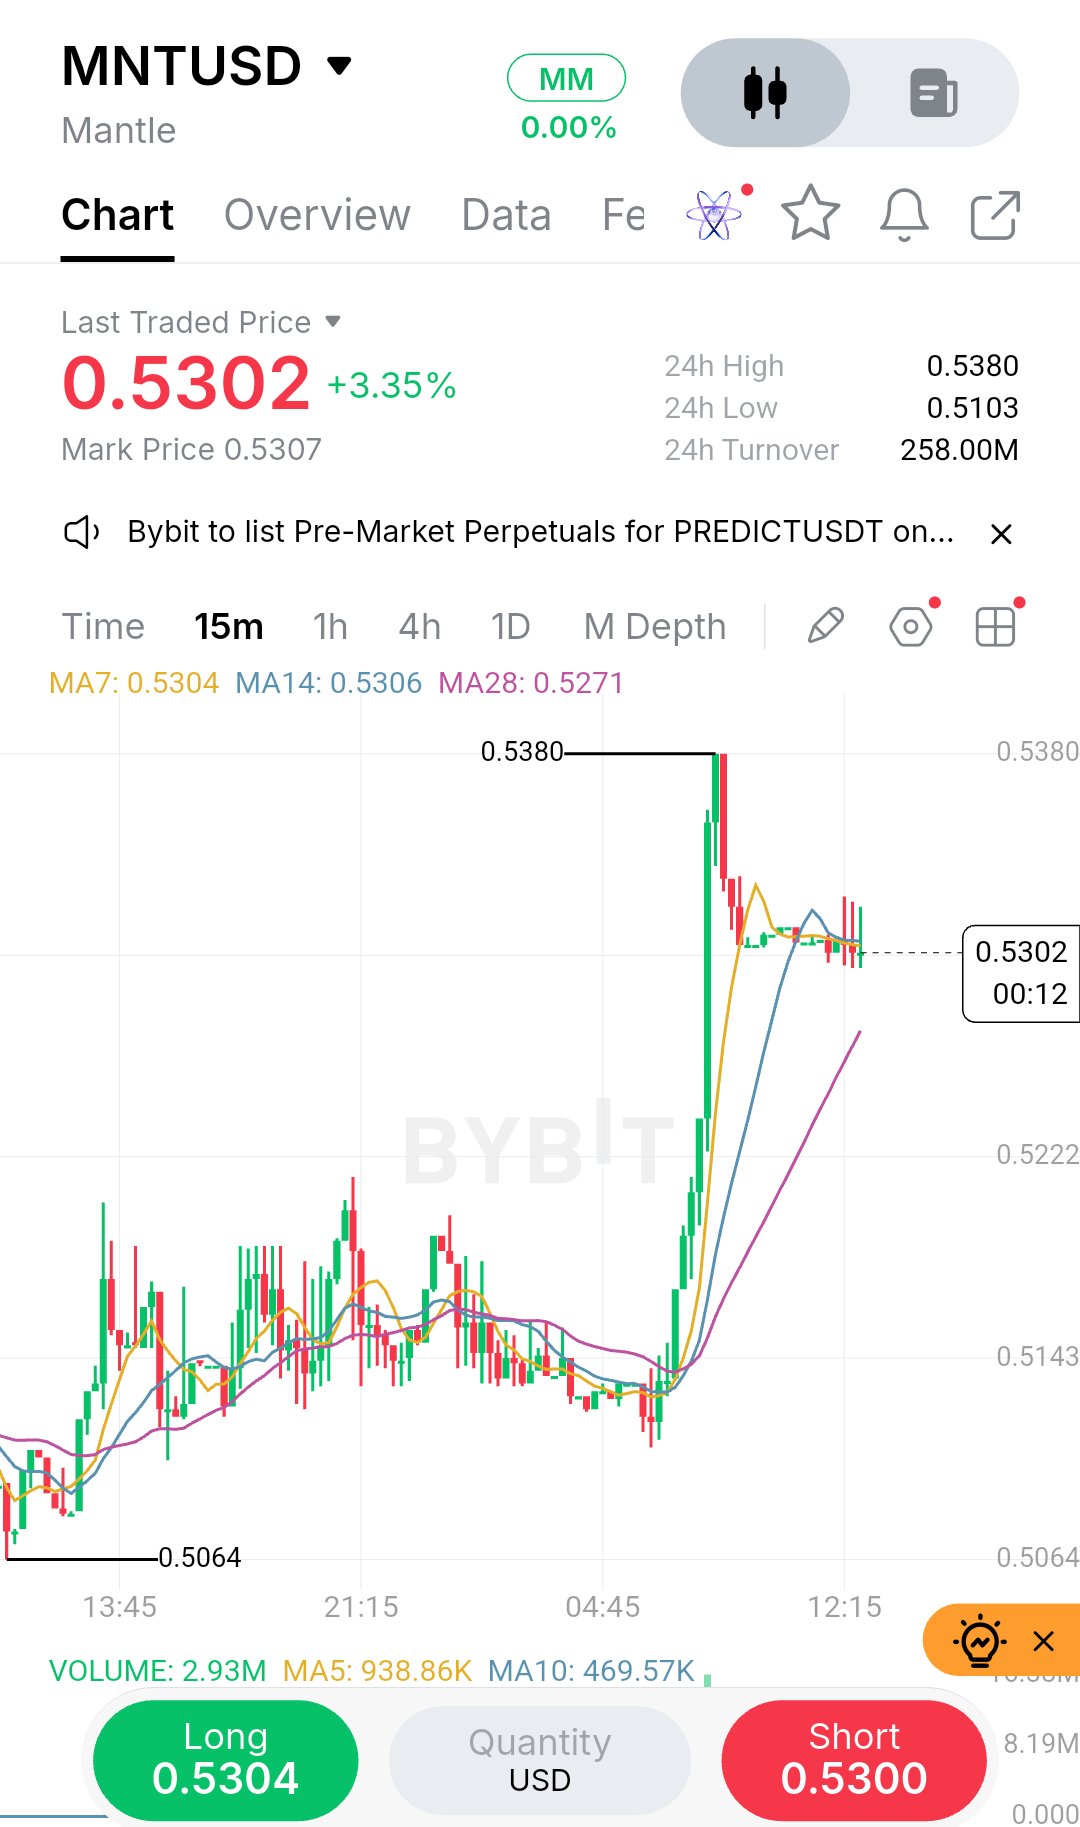
What caught my attention on this MNTUSD 15m chart is that massive vertical spike to 0.5380. That aggressive move looks like a classic liquidity grab or a blow-off top, and right now price is hovering around 0.5302, struggling to push higher. The candle that created that high left a long upper wick, which tells me buyers tried to push through and got immediately rejected by sellers. That is not the kind of price action I want to buy into. My read is that the market structure is currently in a short-term distribution phase following that impulsive wick. I wouldn't chase a long here. Notice how the price is pinching against the 7 and 14 MAs; they are already starting to curl down, and the volume profile after the peak is fading. The immediate support is around 0.5270, which lines up with the 28 MA. If that level breaks, I expect a swift retracement as late buyers get squeezed. The way price is compressing right under the highs without making a new high tells me momentum is fading and the market is running out of fresh buyers at this level. Here is the setup I’m watching: Bias: SHORT Entry Zone: 0.5310 – 0.5325 on a weak retest of the local resistance Confirmation: A rejection wick or a 15m close below 0.5290 Stop / Invalidation: 0.5385 just above the absolute high TP1: 0.5270 recent consolidation support TP2: 0.5200 TP3: 0.5143 R:R: roughly 1:2.5 at TP2 The main risk here is that this is just a bull flag forming before a breakout to new highs. If price reclaims 0.5340 with strong volume, I’d step aside. I’d also keep an eye on BTC for any sudden volatility, as that will drag MNT around. Position sizing matters here because the stop is relatively wide compared to the entry zone, so keep risk small and let the trade come to you rather than forcing an entry in the middle of this chop. Are you guys watching this 15m structure, or are you waiting for the daily close to confirm direction? $MNTUSDT #ByXIMPACT
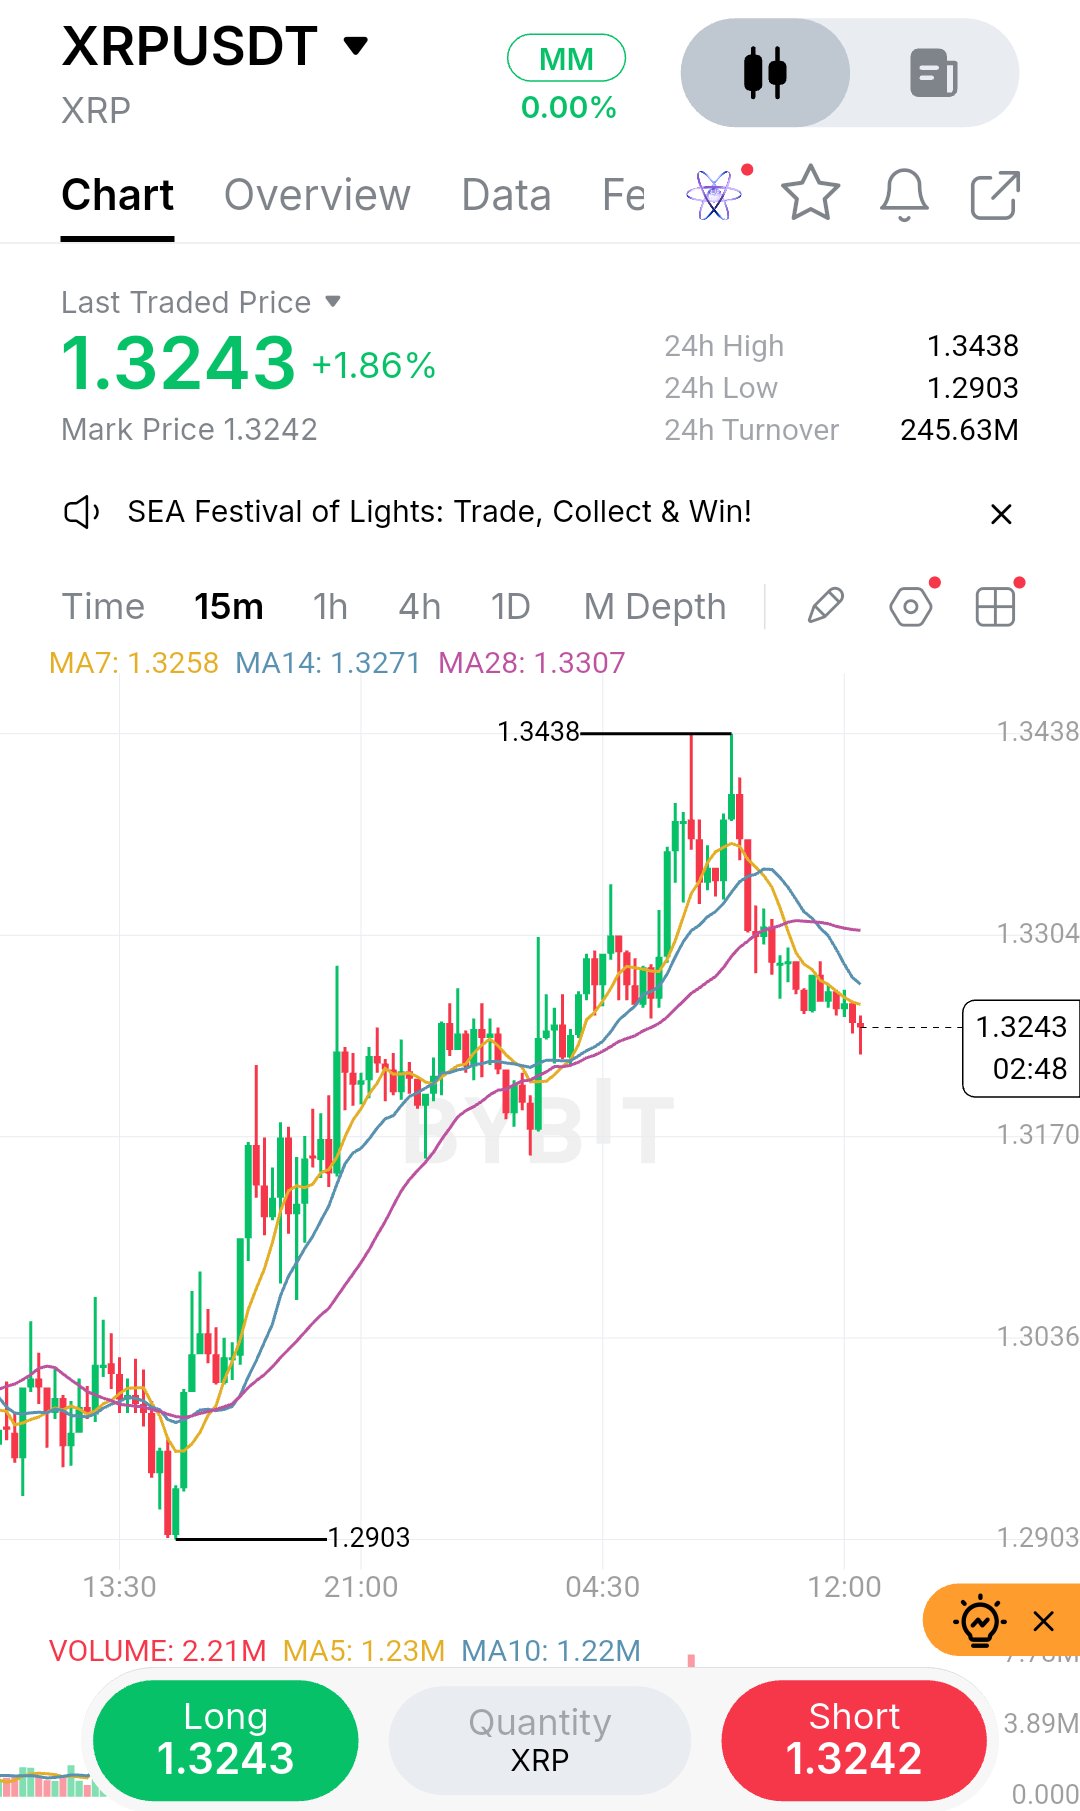
What caught my attention on this 15m chart isn't the rally.it's how cleanly price respected the $1.3438 supply zone. We tagged the 24h high and immediately printed a sharp rejection wick, followed by a series of lower highs. The structure is shifting from bullish to corrective. My read is that the market is now distributing after that aggressive run from $1.2903. Price is currently hovering at $1.3243, trapped below the 7 and 14 MAs (1.3258/1.3271). The immediate concern for longs is the fading momentum and the fact that we are losing the 28 MA floor at $1.3307. I wouldn't chase a long here. The risk of a deeper pullback is too high. I’d rather wait for a clean retest of the demand zone to see if buyers step in. Trade Plan (Short-Term Scalp) · Bias: Wait / Short Bias · Entry Zone: $1.3280 – $1.3310 (On a weak retest of the MAs) · Confirmation: Rejection wick or bearish engulfing on the 15m, followed by a break below $1.3240. · Stop / Invalidation: $1.3350 (A close above the 28 MA invalidates the bearish thesis). · TP1: $1.3180 · TP2: $1.3100 · TP3: $1.3000 (Lower end of the previous consolidation) · R:R: Approx 1:2.5 (based on the $1.3310 entry and $1.3180 TP1) The main risk here is a sudden volume spike reclaiming the $1.3300 level, which would trap early shorts and push us back toward the highs. Personally, I’m sitting on my hands until I see how price reacts to the $1.3180 area. If it holds, the long setup becomes much cleaner. Are you watching that $1.3438 high as a liquidity grab, or are you still looking for continuation? $XRPUSDT #ByXIMPACT
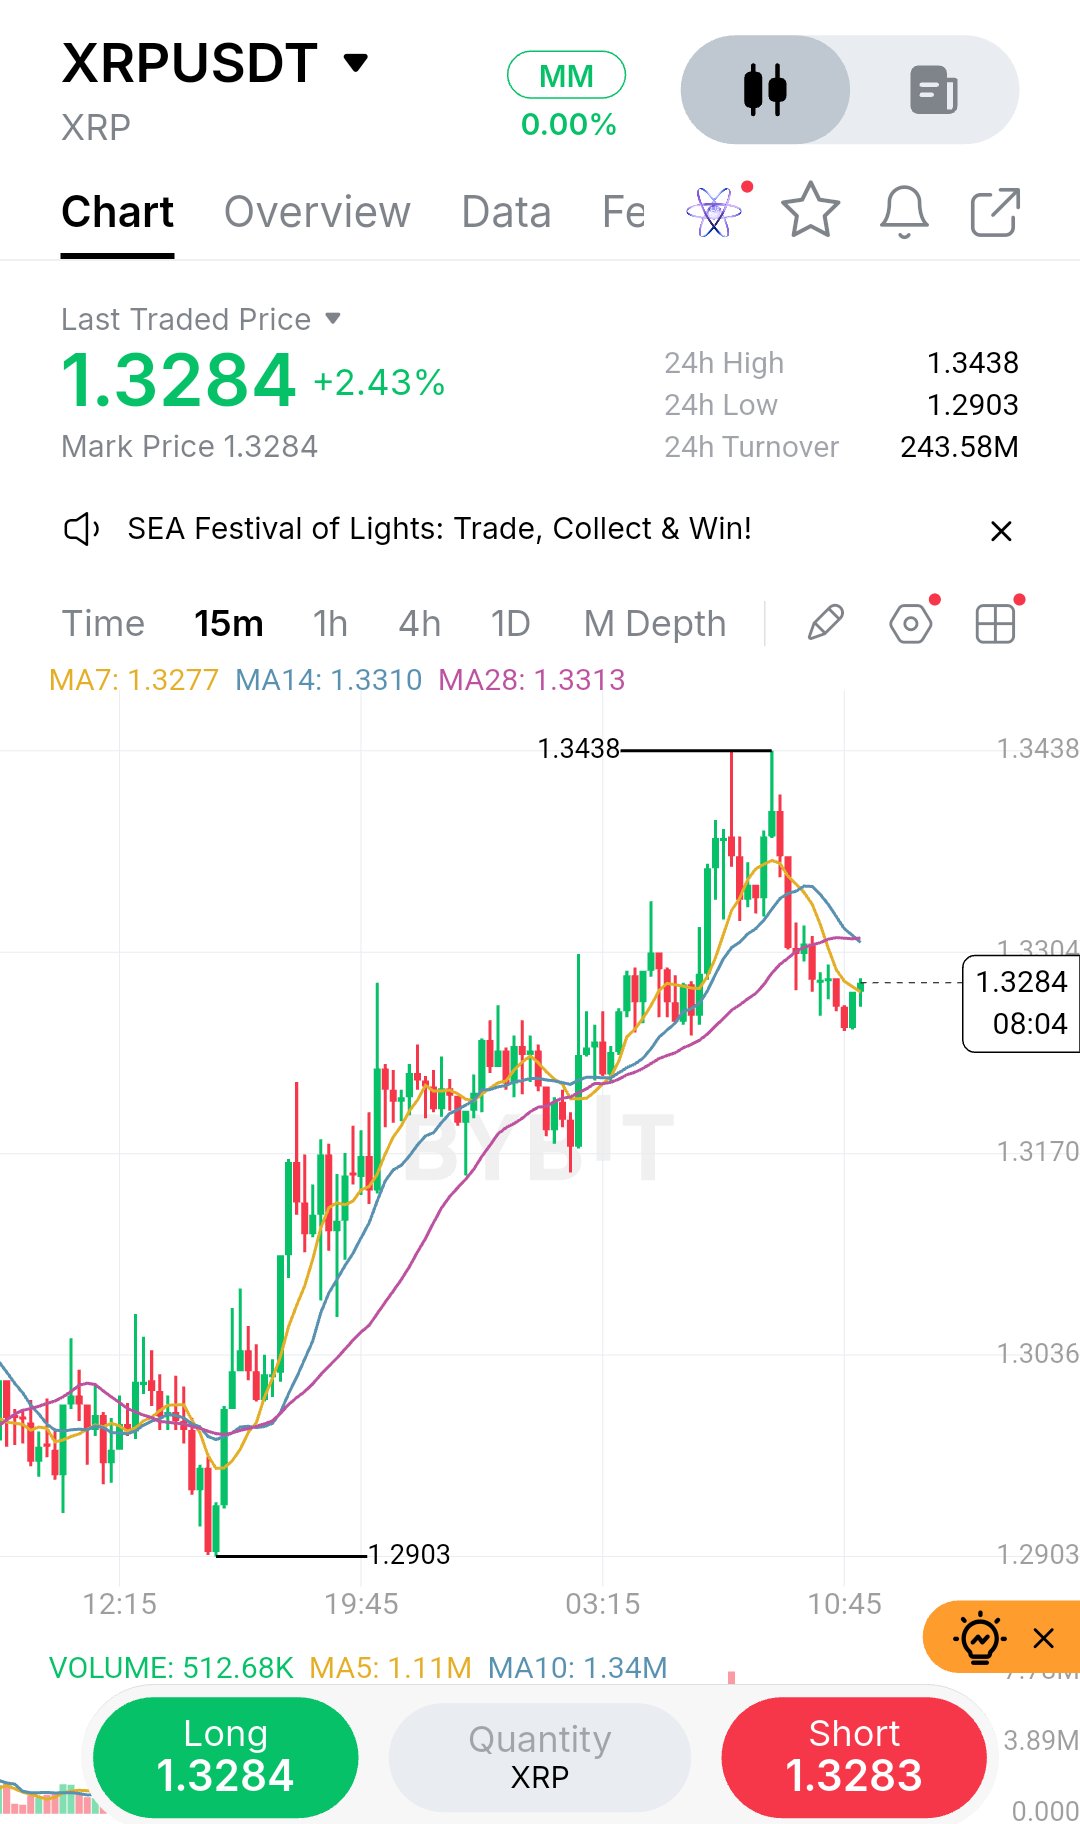
I’ve been staring at this 15m XRP chart for a bit, and what really catches my attention is how quickly the momentum died right after tagging that 1.3438 high. We’re sitting at 1.3284 now, and the short-term moving averages have rolled over right above us, acting like a ceiling. I’ve been burned before thinking a quick dip like this was a discount, only to realize it was just a lower high forming before a deeper flush. That’s exactly why I’m not rushing to hit the long button here. The broader trend is still technically intact, but the immediate structure tells me the buyers are exhausted. I’m watching the 1.3160–1.3200 area closely—that’s where the previous consolidation base sits. I want to see price actually get down there and print a clear rejection wick. I need to see buyers step in and defend that level before I risk any capital. If it just chops around here, I’m perfectly fine sitting on my hands. Bias: WAIT / LONG on Retest Entry: $1.3160 – $1.3200 Confirmation: 15m bullish engulfing or rejection wick in the zone Stop / Invalidation: $1.3080 (below structural support) TP1: $1.3350 TP2: $1.3430 TP3: $1.3550 R:R: ~1:2.5 to TP2 The biggest risk right now is a complete breakdown of this 15m structure, which would turn this into a much deeper correction than I’m anticipating. If price closes below $1.3080, the thesis is dead and I’m stepping aside. I’d much rather miss a trade than force a bad entry. Are you waiting for the retest, or trying to catch this falling knife? $XRPUSDT #ByXIMPACT
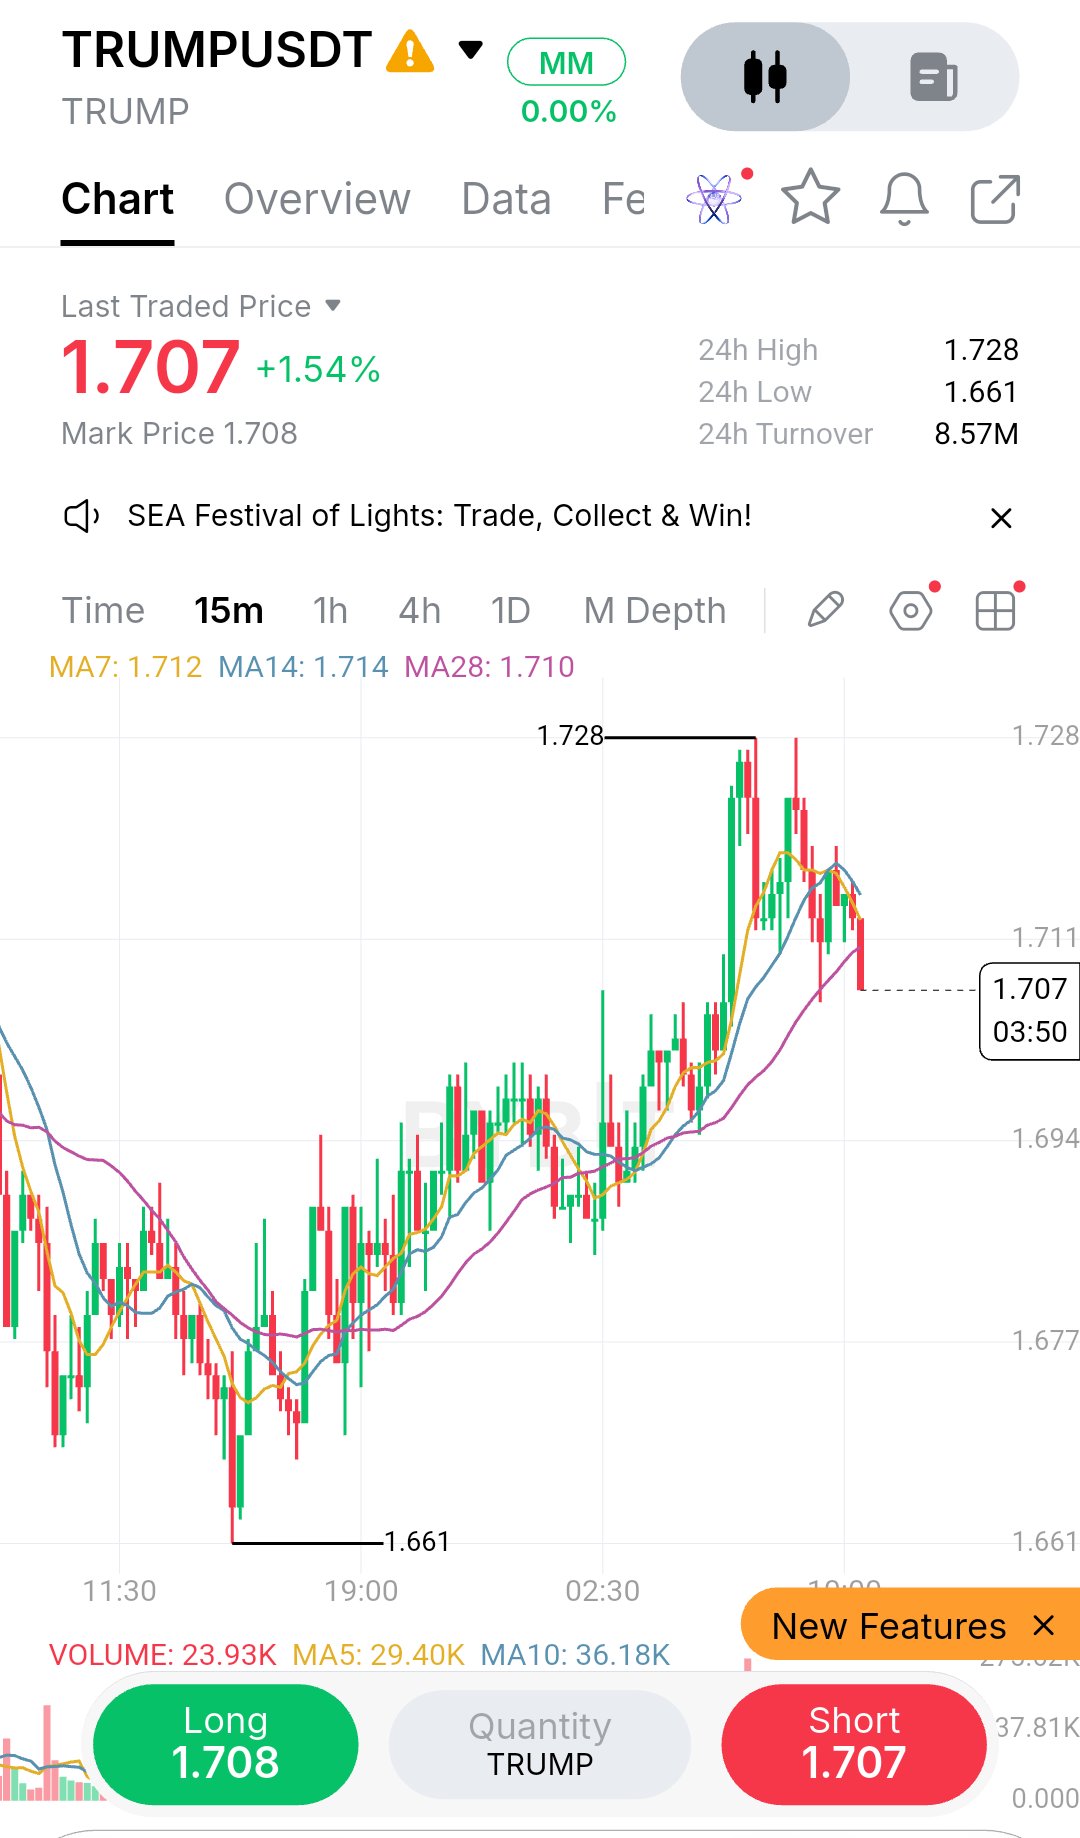
What caught my attention on this TRUMP 15m chart is the aggressive rejection right at the $1.728 high. After a solid run-up from the $1.661 swing low, the momentum has clearly stalled, and we are currently seeing a notable pullback. The market structure here is interesting because the previous leg up was impulsive, but the current price action suggests buyers are running out of steam. I’m watching how price reacts around the short-term moving averages, which are currently bunched together. The 7, 14, and 28 MAs are tightly clustered around $1.710–$1.714, acting as immediate dynamic resistance. The latest candles show a lack of buying pressure at these levels, and the volume profile is starting to look thin on the bid side. I wouldn’t chase a long here; the risk of a deeper retracement toward the previous demand zone is too high, and the reward-to-risk at current prices is simply not there. My read is that we need to wait for price to dictate the next move. A clean break and close below the $1.700 psychological level could open the door for a short, but I’d prefer to see a retest of that level as resistance first. That retest would give us a much higher-quality entry with a clear invalidation point. Conversely, a strong reclaim of the $1.714 MAs would invalidate the bearish momentum and suggest the pullback was just a healthy consolidation. The key here is patience.Forcing a trade in this chop is a quick way to get stopped out. I’d rather wait for the market to show its hand and confirm the direction before committing capital. Trade Plan · Bias: WAIT (Short lean on breakdown) · Entry Zone: $1.705 – $1.710 (Only on confirmed rejection) · Confirmation: 15m close below $1.700, followed by a weak retest · Stop / Invalidation: $1.718 · TP1: $1.690 · TP2: $1.678 · TP3: $1.665 · R:R: Approx 1:2.5 if triggered The biggest risk right now is a sudden volume spike that pushes price back above the MAs, turning this pullback into a simple consolidation before a higher high. I’d cancel the short idea immediately if we get a strong 15m close above $1.715. Position sizing should be kept conservative until the setup confirms, as this timeframe can be noisy. Are you watching this cluster of MAs for a bounce, or are you expecting a deeper sweep of the $1.690 liquidity? $TRUMPUSDT #ByXIMPACT
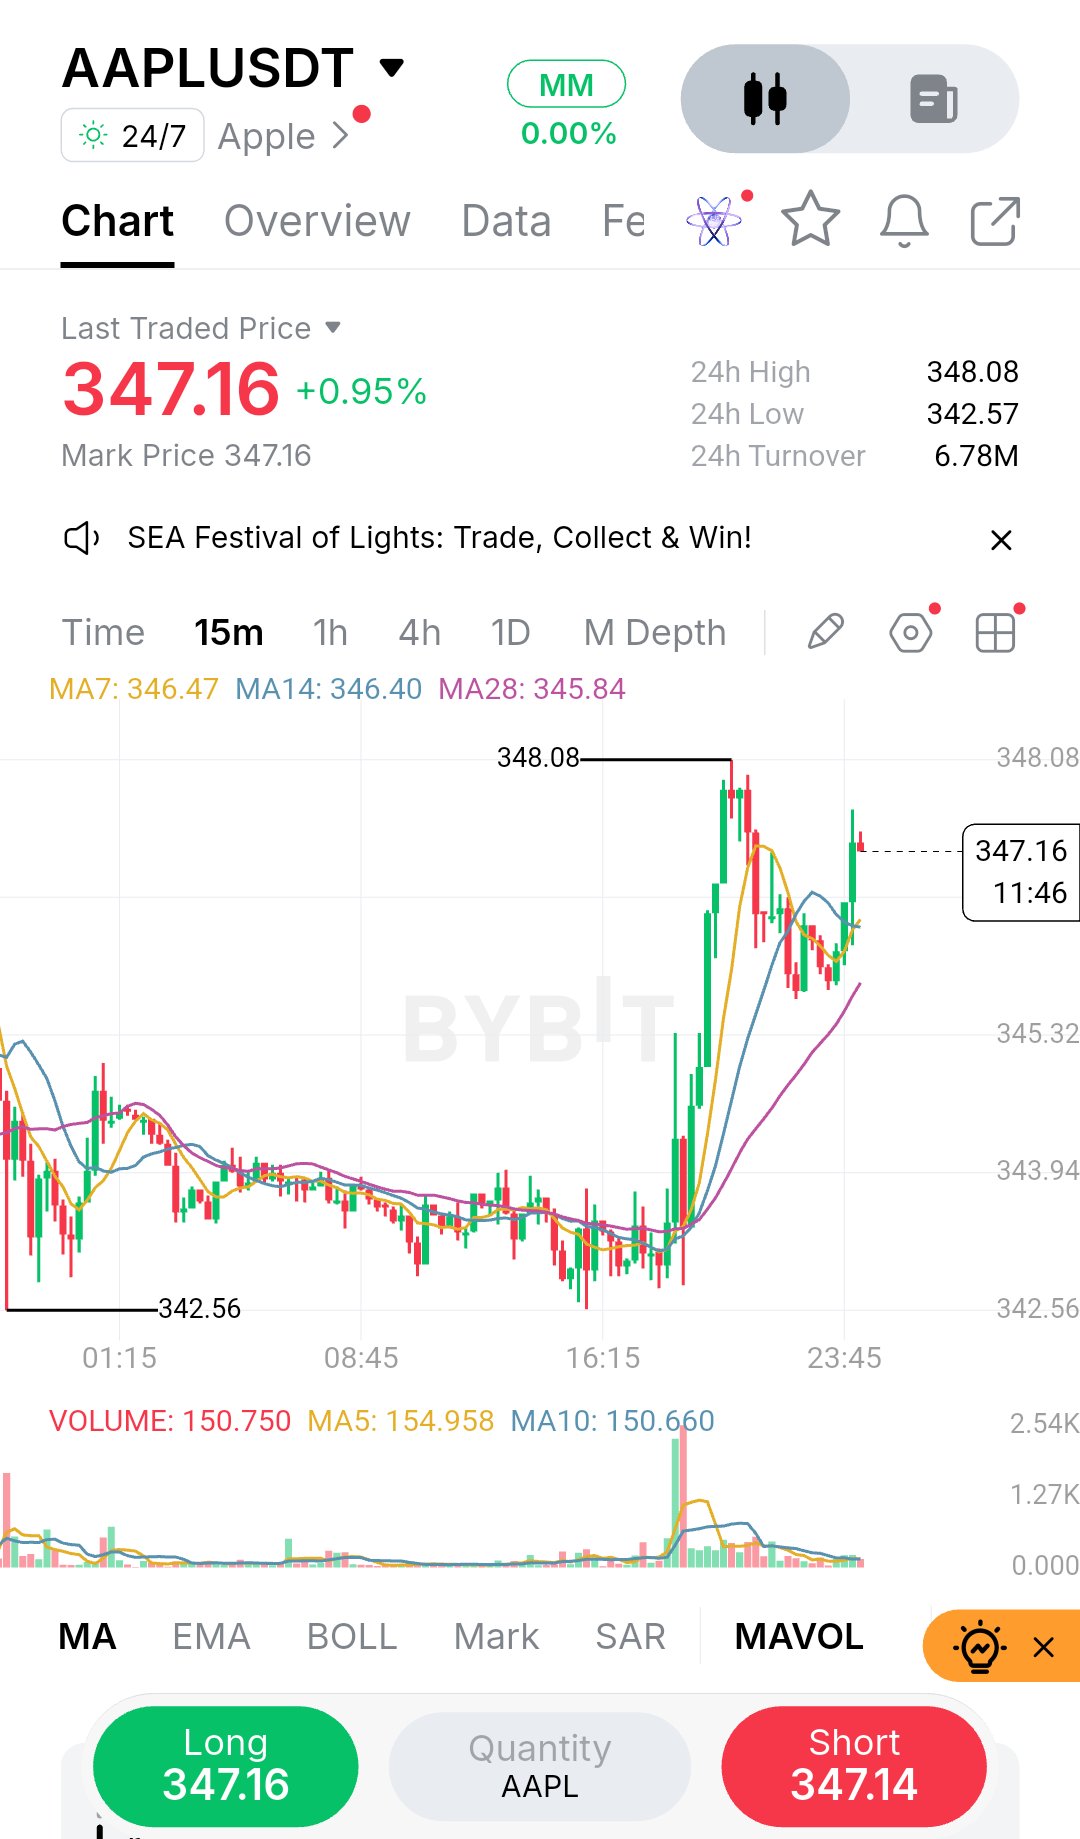
The sharp vertical impulse on this 15m AAPLUSDT chart definitely caught my attention, but I would not blindly chase this green candle. Price just swept up to a local high of $348.08 and is currently cooling off around $347.16. When a chart moves this fast in a short timeframe, the instinct is often to jump in before missing the boat, but that is usually exactly when retail traders get trapped buying the top of a local wick. My read is that we just saw a strong impulsive leg up from the $342.56 base, pushing well above the short term moving averages. The MA7, MA14, and MA28 are all fanned out bullishly below the current price, which shows clear short term momentum. However, after such a vertical move, the market usually needs to catch its breath and digest those gains. The immediate risk here is buying right into a local resistance level without any confirmation. I would rather wait for a structured pullback to see if the previous resistance can flip into solid support. The $346.40 to $346.50 zone, which aligns closely with the MA14, looks interesting. I want to see how price reacts there before committing any capital. If it holds and prints a bullish reclaim or a clear rejection of lower prices, we have a much better entry for a continuation. If we simply see price slowly bleed through this zone without any buying pressure, the setup is invalid. Patience is key here. The volume profile shows a massive spike during the breakout, but it is now tapering off as price consolidates. This means the market is waiting for a decision. I am looking for a clear higher low to form on the 15m chart to confirm that buyers are still defending the trend. Trade Plan Bias: WAIT, looking for a Long on a confirmed pullback Entry Zone: $346.20 to $346.50, only if a clear support bounce forms Confirmation: A bullish rejection candle or a structural shift such as a higher low in the demand zone. Do not enter on a slow bleed through the level. Stop or Invalidation: $345.80, just below the key moving averages and recent consolidation. If we lose this level, the immediate momentum is gone. TP1: $348.08, the recent high TP2: $349.50, a psychological extension level TP3: $351.00 Risk to Reward: Approximately 1:3 if the entry triggers at $346.30 The biggest risk is a fakeout. This could just be a liquidity sweep before price bleeds back down into the $343 range. If we see heavy selling volume rejecting the $346 level, I will stay out entirely and wait for a better setup. Are you watching for a continuation here, or are you waiting for a deeper retrace? $AAPLXUSDT #ByXIMPACT
What caught my attention here is how BTC is coiling right at the top of this 15m move. After that sharp recovery from the $79,458 low, price is now compressing right under the $80,800 swing high. The structure is clearly bullish on this timeframe. We’ve printed a strong sequence of higher highs and higher lows, and the moving averages are starting to fan out nicely with price holding above the MA7 ($80,593) and MA14 ($80,584). However, I’m not a fan of chasing this green candle into resistance. The 15m chart looks like it’s building liquidity right below the 24h high, and a quick sweep of those late-long stop losses is entirely possible before any real continuation. My read is that we need to see how price reacts at this ceiling. If it breaks and closes cleanly above $80,800, the next leg up is likely. But if we get a fakeout and a sharp rejection, I’ll be looking for a long from the lower support zone. I’d rather wait for confirmation than force an entry in the middle of this tight range. Trade Plan (Long Bias) Entry: $80,300 – $80,500 (on a retest of the MA support cluster) Confirmation: A 15m close above $80,800 or a strong rejection wick off $80,300 Stop / Invalidation: $79,900 (below the recent higher low structure) TP1: $80,800 TP2: $81,200 TP3:$81,500 R:R: Approx 1:2 to 1:3 depending on entry The risk I’m most concerned about is a failure to hold the $80,300 level. If price breaks below $79,900, it invalidates the short-term bullish structure, and I’d step aside entirely. Are you watching this breakout level, or are you waiting for a deeper pullback before taking a position? $BTCUSDT #ByXIMPACT

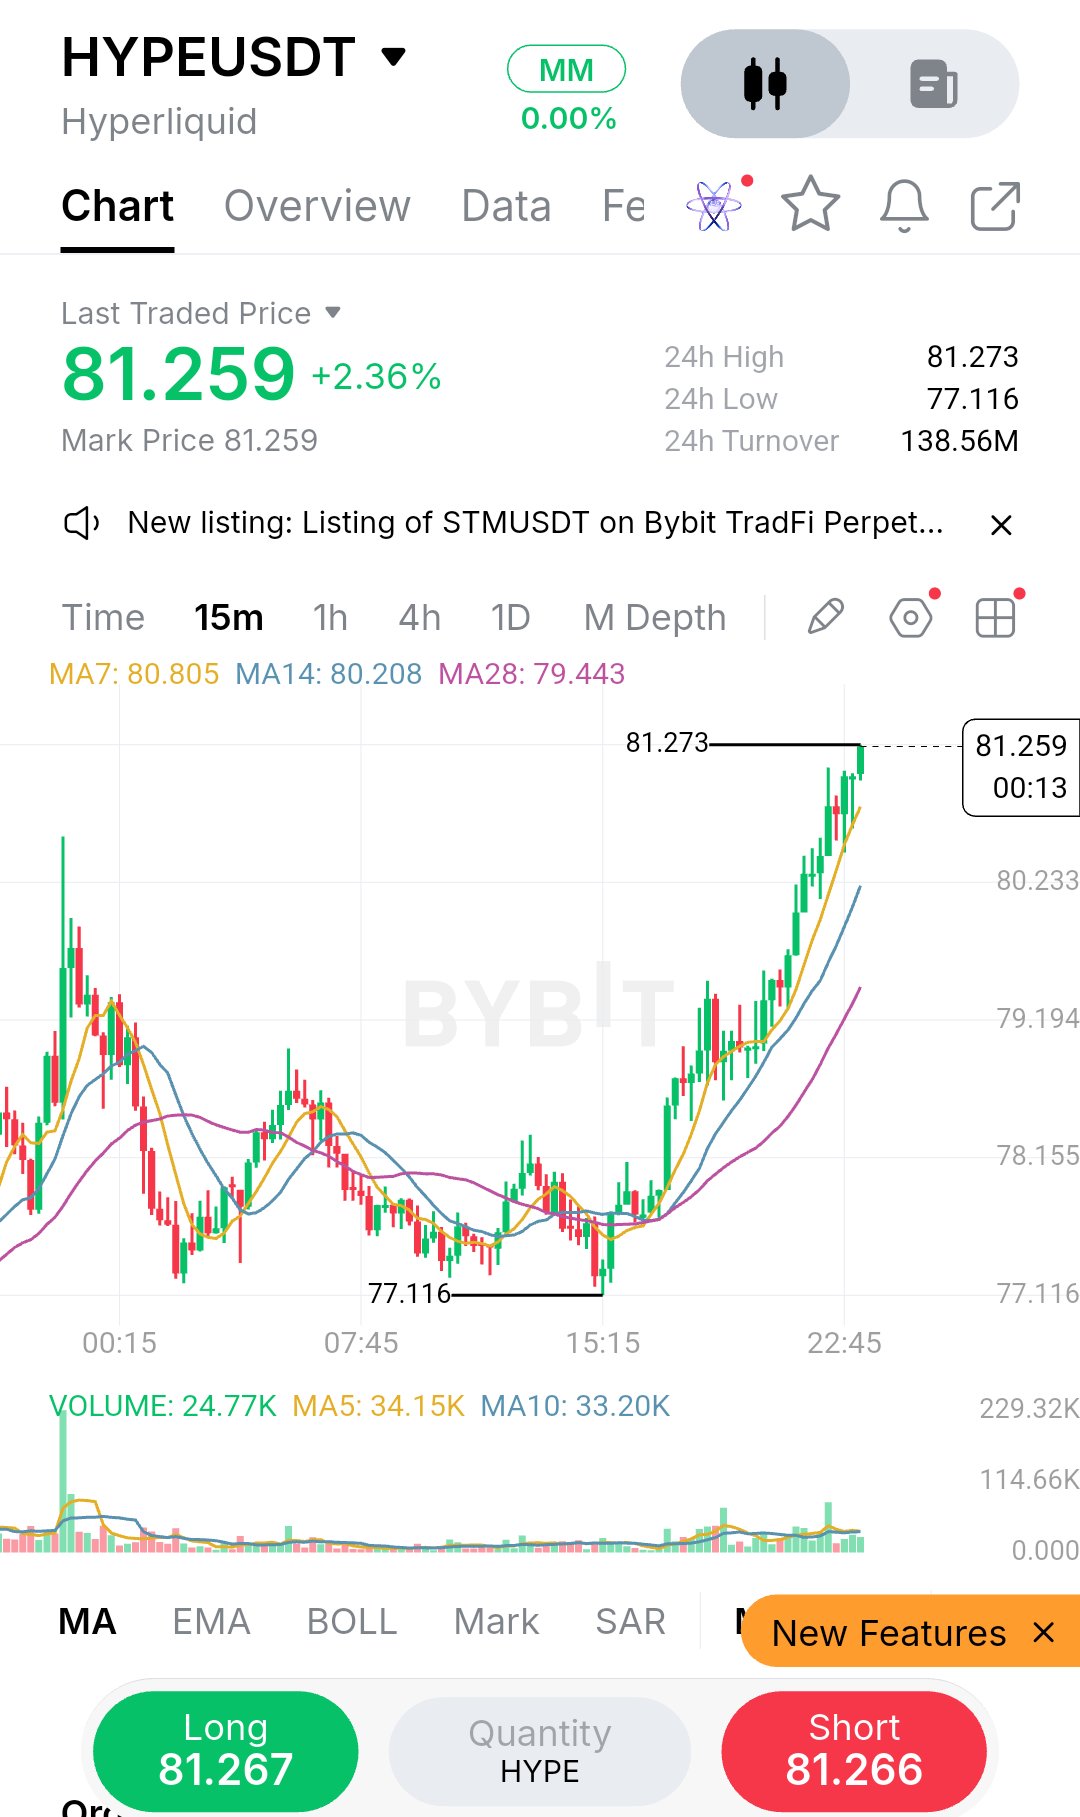
Chasing green candles right into a local high is exactly how traders get trapped, and that’s precisely what I’m seeing on this HYPE 15m chart. Price just printed a sharp V-shaped recovery from the $77.11 swing low, running straight into $81.27. What caught my attention is the structure here. We have a clear local resistance level forming around $81.27 (which is also printing the 24h high), and the candles are currently showing some hesitation right at this ceiling. The moving averages are perfectly stacked (MA7 at $80.80, MA14 at $80.20, and MA28 at $79.44), confirming strong short-term upward momentum. However, volume on this final push is looking a bit thin compared to the initial aggressive bounce off the lows. This tells me the aggressive buyers might be getting a bit exhausted at this current price point. I wouldn't chase a long right here at the top. The risk of buying the exact local top of a 15m impulse is too high, especially when the candle wicks are starting to show upper rejection. My read is that we likely need to see a slight pullback to test the moving average cluster as dynamic support, or a confirmed breakout above the current high. If price just aggressively chops sideways here without any pullback, I’ll just sit on my hands and wait for the next clean setup. Patience pays in these fast timeframes. Trade Plan Bias: Long (on confirmation or pullback) Entry Zone: $80.20 to $80.80 (Retest of MAs) or a confirmed 15m close above $81.30. Confirmation: Rejection wick from the $80.80 area showing buyers stepping back in, or a strong volume breakout holding above $81.27. Stop / Invalidation: $79.40 (Just below the MA28 and recent structural support). If this breaks, the short-term trend is likely shifting. TP1: $81.27 (Current local high) TP2: $82.00 (Psychological extension) TP3: $83.50 (Next logical liquidity target if price discovery continues) R:R: Roughly 1:2 to TP2 if entering on the pullback. The main risk? A failure to hold above $80.80 could trigger a deeper flush toward the $79 mid-zone. Watch the volume closely on any pullback; if it’s light, it’s just a healthy retrace. If it’s heavy selling, we might be looking at a lower high forming. Are you waiting for a pullback to the MAs, or are you already trading the breakout? $HYPEUSDT #ByXIMPACT
What caught my attention on this NVDA chart is how aggressively the price rejected the 24h high at $219.55. The 15m candles show a clear failure to hold that peak, followed by a heavy sell-off, but buyers stepped in right around the $214.94 low to defend the structure. That bounce tells me there is still demand underneath, but the rejection at the top warns that sellers are active near the highs. Right now, price is sitting at $218.32, effectively sandwiched between the recent swing high and the MA cluster (MA7, MA14, MA28 hovering tightly between $218.16 and $218.41). This is a classic compression zone, and the moving averages are almost flat, which confirms the market is undecided. Volume is also relatively thin right now, with the current candle showing 176.470 against a MA10 of 619.118. That lack of participation suggests we are pausing before the next directional move rather than trending cleanly. I don’t want to force a trade in the middle of this range. The way I see it, the structure favors a short-term long only if we can reclaim the recent high with conviction, or a short if we lose the moving averages and the $217.80 shelf. If price simply chops around the MAs, the best decision is to stay patient and let the market reveal its hand. Trade Plan Bias: WAIT (Neutral until breakout) Entry Zone: $218.10 to $218.45 (Watch for a reaction here) Confirmation: For a long, a strong 15m close above $219.55 with volume expansion. For a short, a break and close below the MA cluster at $218.16. Stop / Invalidation: $217.80 (Below the MAs for longs) TP1: $219.50 (Recent high) TP2: $220.50 (Psychological resistance) TP3: $221.00 plus R:R: Approx 1:2 on the long if entry triggers near $218.30. The biggest risk here is a fakeout. Price could easily sweep the $219.55 high and immediately reverse back into the range, trapping breakout buyers. I’d also be cautious if volume remains dead; without buying pressure, that high is likely to hold as resistance. If price breaks below $217.80 and starts consolidating, my long thesis is dead, and I’d look for a retest of $214.94. Are you guys watching this $219.55 level for a breakout or a fade? $NVDAXUSDT #ByXIMPACT

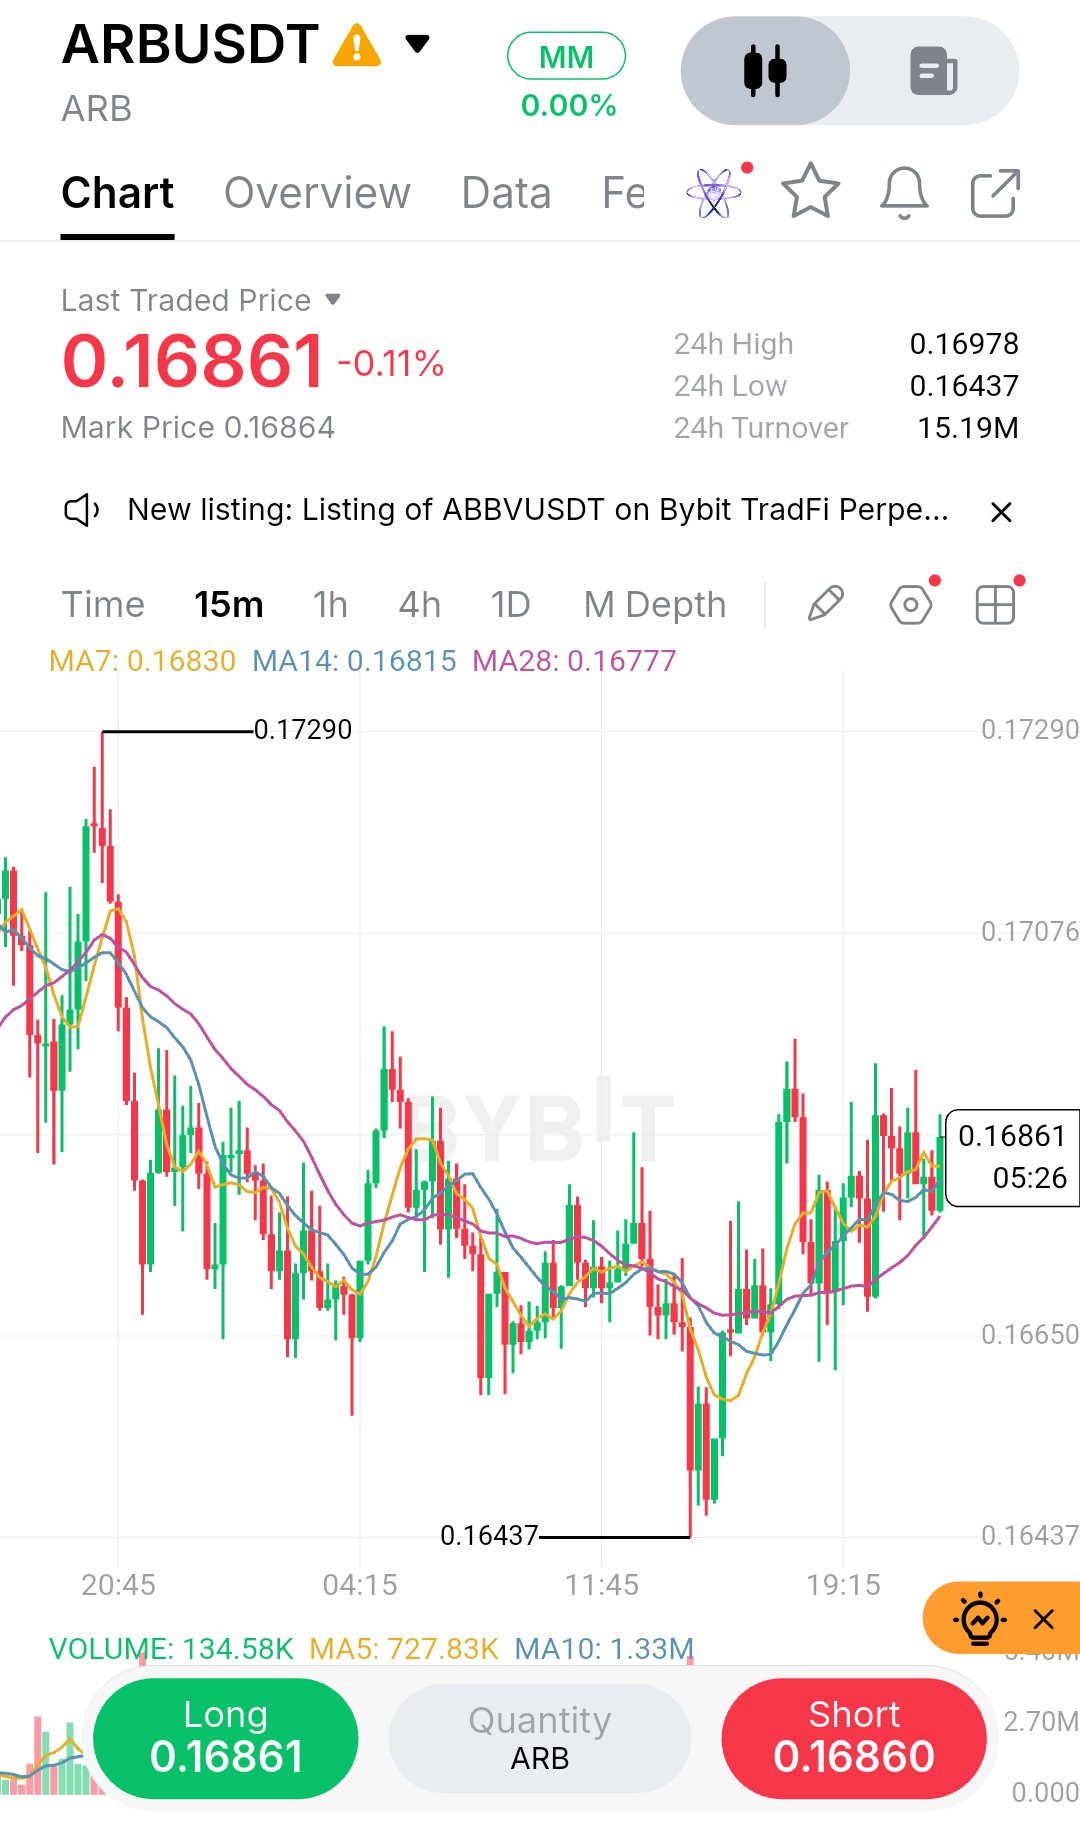
What jumps out to me on this ARBUSDT 15-minute chart is the sheer amount of chop. We’re looking at a classic range-bound environment where price is essentially going sideways, frustrating both bulls and bears. The market tried to establish a high at 0.17290 and a low at 0.16437, but right now, we are stuck right in the middle of that zone at 0.16861. My read is that this is a compression phase. The moving averages tell the story perfectly: the MA7 (0.16830), MA14 (0.16815), and MA28 (0.16777) are practically tangled together. When the MAs flatten out and price weaves through them like this, it means there is no clear trend. The recent recovery from the 0.16437 low is encouraging for buyers, but we haven't seen a higher high yet. We are just chopping around the previous breakdown levels. I wouldn't force a trade here. Buying the middle of a range is how you get chopped up. The volume indicator at the bottom also shows relatively low participation right now (current volume 134.58K vs MA10 of 1.33M), confirming this lack of conviction. If I were to engage, I'd wait for an extreme. For a long, I’d want to see a flush down toward that 0.16450 demand zone to see if buyers defend it again. For a short, I’d want to see price push up into the 0.1700–0.1710 area and get rejected. Trade Plan (Conditional) · Bias: WAIT / Neutral · Entry Zone (Long): $0.16450 – $0.16500 (Retest of major swing low) · Confirmation: Strong bullish rejection wick and volume spike on the 15m. · Stop / Invalidation: $0.16380 (Below the 0.16437 structural low) · TP1: $0.16800 (Range mid-point / MA cluster) · TP2: $0.17200 (Recent swing high) · R:R: Roughly 1:3 if the sweep holds. The risk I’m most concerned about is a sudden breakdown. If price closes decisively below 0.16437, the range is broken, and we likely head lower. Conversely, a breakout above 0.1730 invalidates the short bias. I’d stay patient until price reaches the edges of this box. Are you waiting for a breakout, or are you playing the range edges like me? $ARBUSDT #ByXIMPACT
What caught my attention on this XAUTUSDT 15-minute chart isn’t just the green candles.it’s the angle of the move. Price has transitioned from a gradual uptrend into a near-vertical expansion, which tells me buyers are aggressive but also that we’re reaching the point where late entries carry the most risk. The 24-hour low sits at 3,992, and we’ve rallied over 60 points into the 4,061 high without a meaningful structural pullback, which is exactly the kind of environment where chasing gets punished. Structurally, the trend is undeniably bullish. The moving averages are fanned out in perfect order MA7 at 4,056, MA14 at 4,044, and MA28 at 4,026 confirming that short-term momentum is firmly in control. But here’s the nuance: the distance between the current price (4,055) and the MA28 (4,026) is substantial for a 15-minute chart. When price stretches that far from its slower moving average, it often invites a mean-reversion snap or a liquidity sweep before continuation. That gap is my primary concern right now. The key level I’m watching is the 4,061 swing high. Price is currently testing it, and while a breakout is possible, I’d rather see how the market reacts. A clean break and close above 4,061 with volume confirmation would open the door toward 4,075 and potentially 4,090. But given the overextended nature of this rally, I’m leaning toward a retest scenario. The 4,040–4,045 zone, where the MA14 sits, is the first logical area for buyers to step back in. A successful retest there with a bullish rejection candle would give me a much cleaner risk to reward setup than entering at the current price. Trade Plan · Bias: LONG on retest / WAIT for clean entry · Entry Zone: $4,040 – $4,045 (MA14 support confluence) · Confirmation: A 15m bullish rejection wick or close above $4,045 after a pullback. Avoid entering mid-drop. · Stop / Invalidation: $4,025 (below MA28 and prior consolidation) · TP1: $4,061 (recent high) · TP2: $4,075 (extension target) · TP3: $4,090 (if momentum accelerates) · R:R: Approximately 1:2.5 if the retest holds The risk I’m most focused on is a false breakdown below 4,040. If price closes below the MA28 with strong volume, the bullish thesis is invalidated, and I’d step aside rather than average down. Position sizing should reflect the fact that this is a momentum trade, not a value entry keep risk tight and let the retest prove itself. I’d rather miss a breakout than buy the top of a parabolic run. Are you waiting for the retest, or are you trading the breakout here? $XAUTUSDT #ByXIMPACT

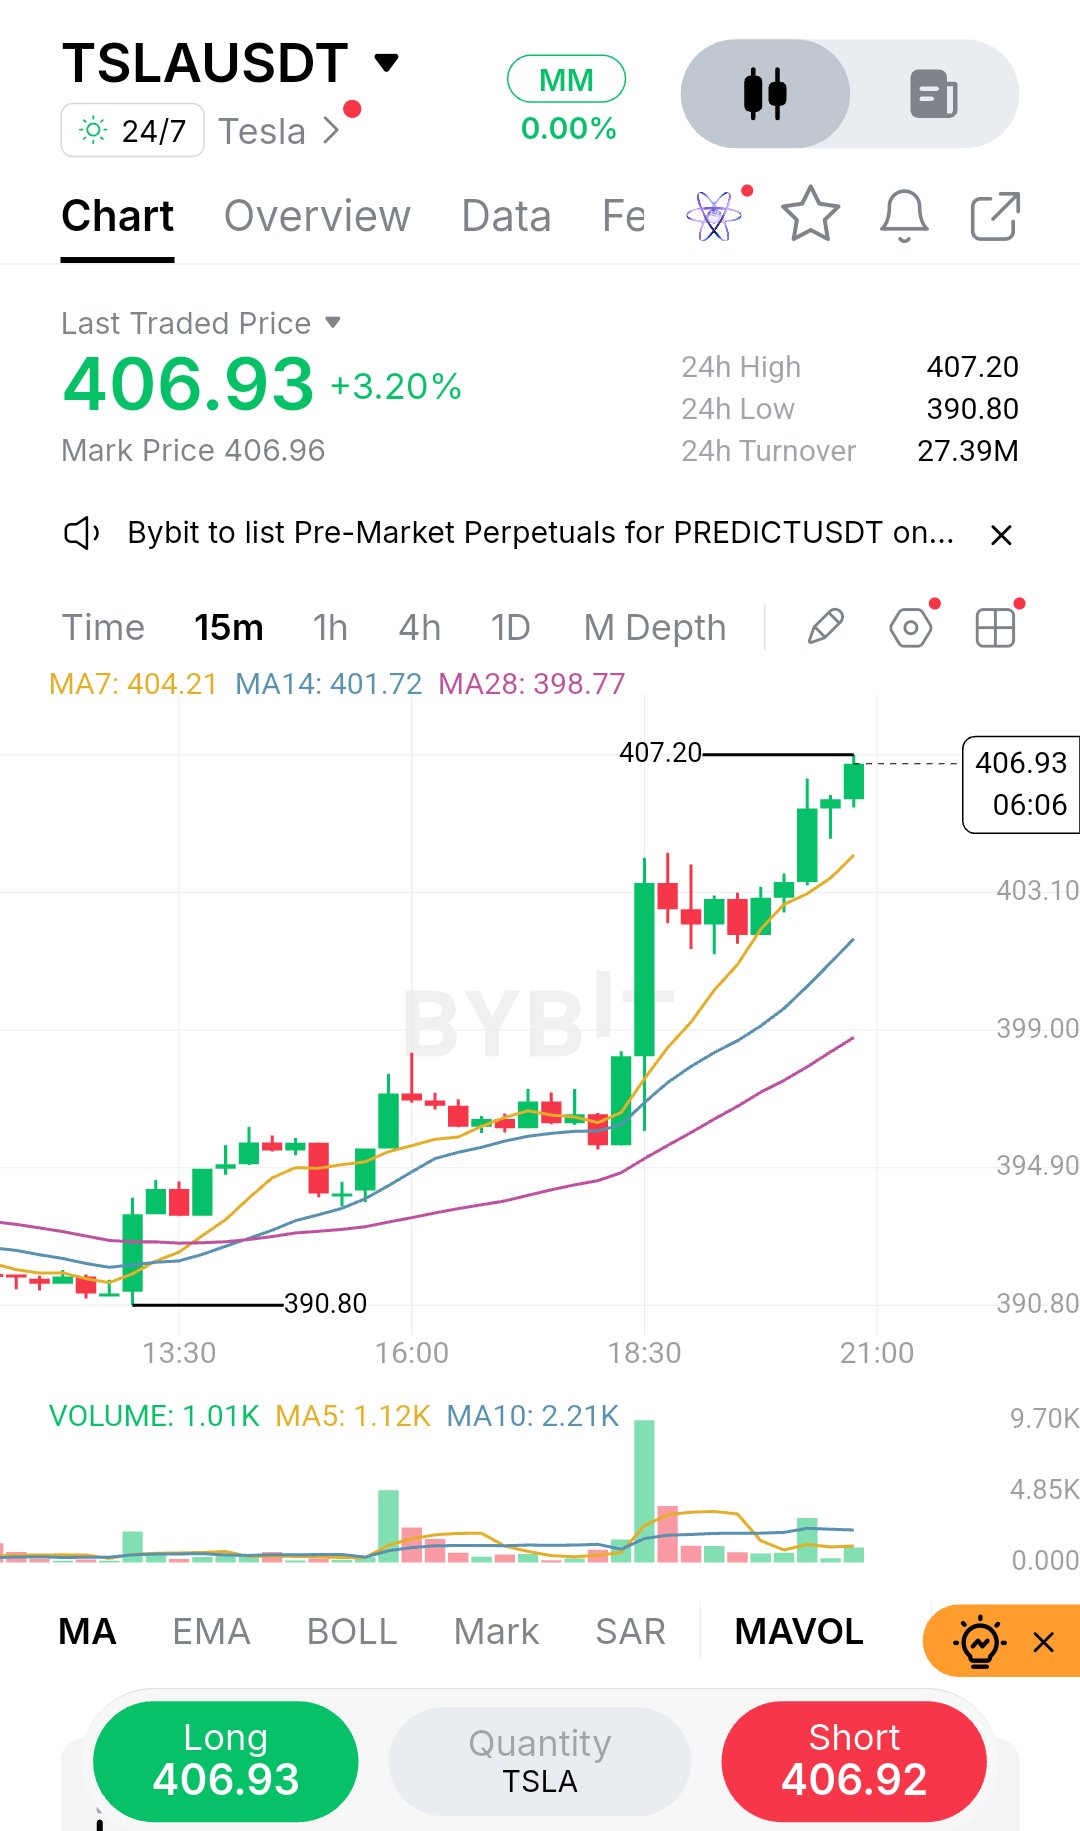
TSLA is pressing right into the 24h high at $407.20 after a clean, relentless grind up from the $390.80 session low. What catches my eye here is the structure on the 15m chart: higher lows, price riding above all three moving averages (MA7 at $404.21, MA14 at $401.72, MA28 at $398.77), and a massive volume expansion on the breakout candle near 18:30. This is a trend fully in control, but it’s also heavily extended. My read is that chasing the green candles right at resistance is a low-quality entry. The market has moved nearly $17 without a meaningful pause, leaving a trail of unmitigated demand and potential late-long stop losses below. The better play is either a breakout-retest or waiting for a controlled pullback into the moving average cluster. I’d rather buy a dip where the risk is defined than pay up into a potential liquidity sweep of the highs. The volume profile is key here. Notice how the volume spikes exactly on the impulse candles, but tapers off as we consolidate near the highs. This tells me buyers are still absorbing supply, but the immediate momentum might be exhausting. If we get a retest of the $401.70-$404 zone and see volume dry up on the pullback, that’s my signal to step in. The moving averages are fanning out beautifully, acting as dynamic support, which gives us a clear map for where the buyers are likely defending. Trade Plan Bias: LONG (on pullback/confirmation) Entry Zone: $401.50 – $404.00 (MA7/MA14 retest) Confirmation: Hold above $401.70 with a bullish rejection candle or a clean 15m close above $407.20 with volume. Stop / Invalidation: $398.50 (below MA28 and the structural higher low) TP1: $407.20 (24h high) TP2: $410.00 (psychological extension) TP3: $413.50 (measured move from consolidation) R:R: ~2.5R to TP3 if entered at $403. The main risk I’m watching is a failed breakout at $407.20 . if price wicks above and closes back below $404, the long thesis weakens fast. I’d completely cancel the idea if we lose $398.50 on a 15m close. Are you watching this $407 level for a breakout, or waiting for the pullback like I am? $TSLAXUSDT #ByXIMPACT
What caught my attention on this 1000PEPE 15m chart isn't the vertical green candles, but where the move started. Notice how price swept the $0.0042540 low, trapping late shorts, before printing a sharp structural shift. That aggressive reclaim was the real signal. Since then, we have a clean series of higher highs and higher lows, with the moving averages fanning out perfectly. The trend is clearly bullish, and the recent peak at $0.0044260 is the level to watch. However, buying the current $0.0043900 level feels like chasing. Price is extended, and a pullback is due. My read is to wait for a retest of the previous resistance zone, which should now act as demand. The $0.0043440–$0.0043660 area, aligning with the MA7 and MA14, is where I want to see buyers step up. Trade Plan: Bias: LONG (on pullback) Entry Zone: $0.0043440 – $0.0043660 Confirmation: A bullish rejection candle or strong volume bounce in this zone. Stop / Invalidation: $0.0042800 (Below the MA28 and the recent structural higher low) **TP1:** $0.0044260 (Recent 24h High) TP2: $0.0044500 (Psychological extension) R:R: ~1:2.5 (based on TP2) The main risk here is the market lacking follow-through if Bitcoin decides to dip. If price aggressively breaks below $0.0043440 without any reaction, I'd stand aside. I'd manage the position by securing partials at TP1 and trailing my stop to break even. Are you waiting for this retest, or are you already riding the momentum? $PEPEUSDT #ByXIMPACT
