kingalameen001
Alhamdulillah for everything
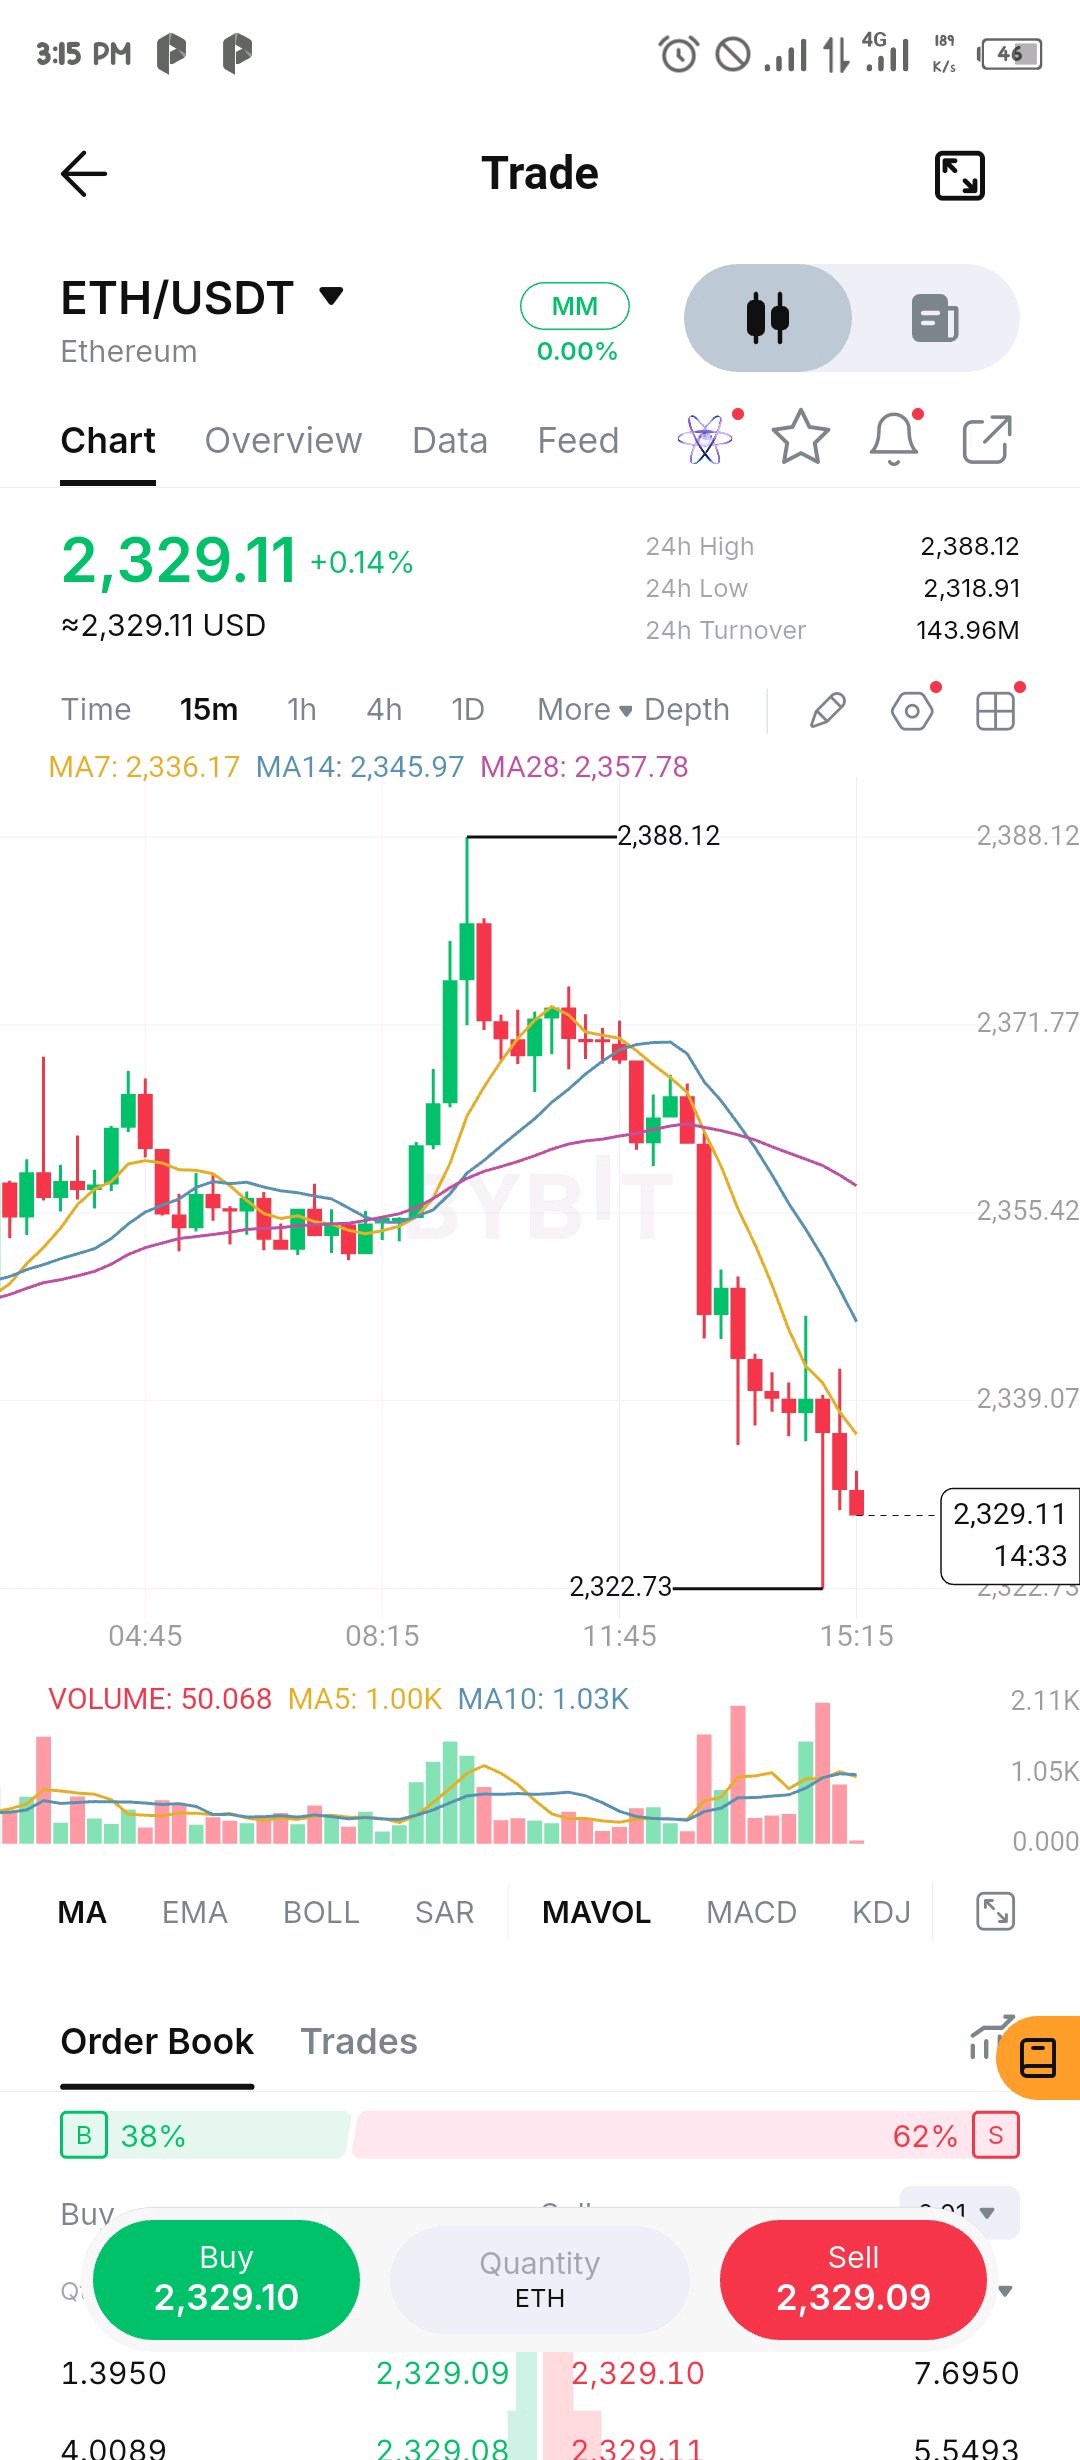
$ETHUSDT didn't just give back its spike, it lost the whole base underneath it ETH has done more than give back the spike to 2,388. It has now lost the base the move started from, which sat around 2,350 to 2,360, and the 2,340 area that held as a double bottom last night is behind it too. Price is 2,329.11. The way it came down matters. The slide has been a run of big red candles, and the three heaviest volume bars on the chart are all red, including the long flush wick to 2,322.73 that was only partly bought back. The averages have rolled over in order, MA7 (2,336.17) under MA14 (2,345.97) under MA28 (2,357.78), with price below all three, and the order book is 62% asks. That leaves overhead supply stacked. The MA7 near 2,336 is the first thing to reclaim, then the 2,346 to 2,358 zone where the MA14, MA28 and the old base sit. A real bounce has to get through that, not just tag it. Underneath, the 2,322.73 flush low and the 24h low at 2,318.91, only about 10 points away, are the next levels. A close below them leaves nothing on this chart to lean on. A quick reclaim of 2,336 would be the first sign this was just an overshoot. $ETHUSDT #ByXIMPACT
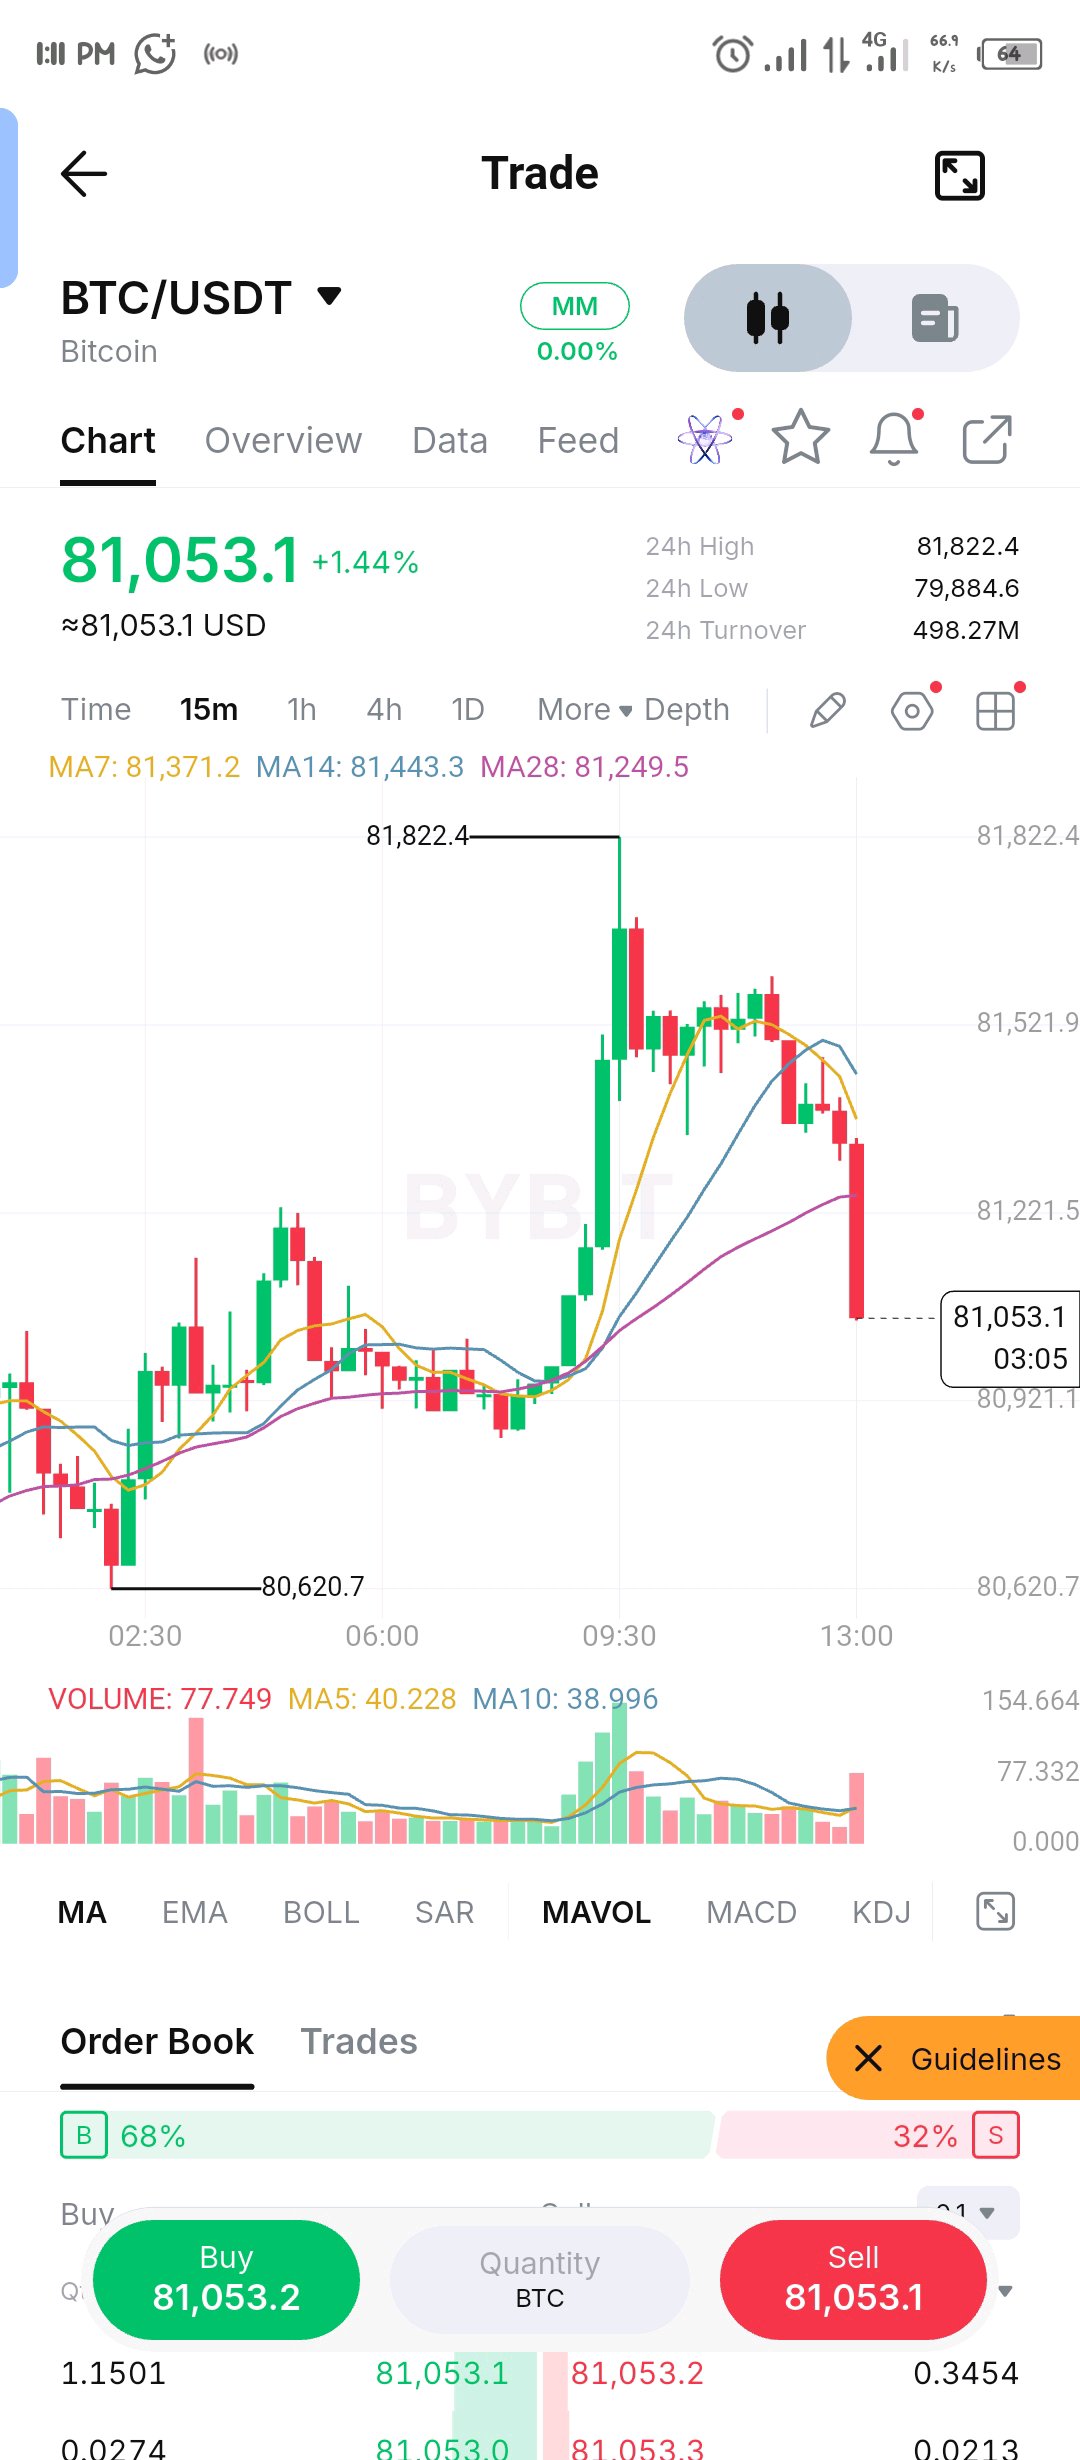
$BTCUSDT gave the breakout back in a single candle, and now it's sitting on where the move started The latest 15m candle ran from roughly 81,326 down to 81,053, taking price under the MA7 (81,371), MA28 (81,249) and MA14 (81,443) in one go. The MA7 has also rolled over beneath the MA14. What makes it more than noise is participation. Volume on that candle is about 78 against a 5-bar average near 40, roughly double, and it was still printing when I looked. It also follows a failed hold near the 81,822 high, where price kept making lower highs, with the last bounce stalling near 81,600. Price is now back at the origin of the breakout, the 81,000 to 81,100 zone, so this is the make-or-break area. The order book is 68% bids, which says people are trying to catch it, but bids only matter if they stop the selling. If 81,000 holds, this is just a retest, and a close back above the MA28 near 81,250 would say so. If it breaks, the base around 80,900 is the next level to watch. $BTCUSDT #ByXIMPACT
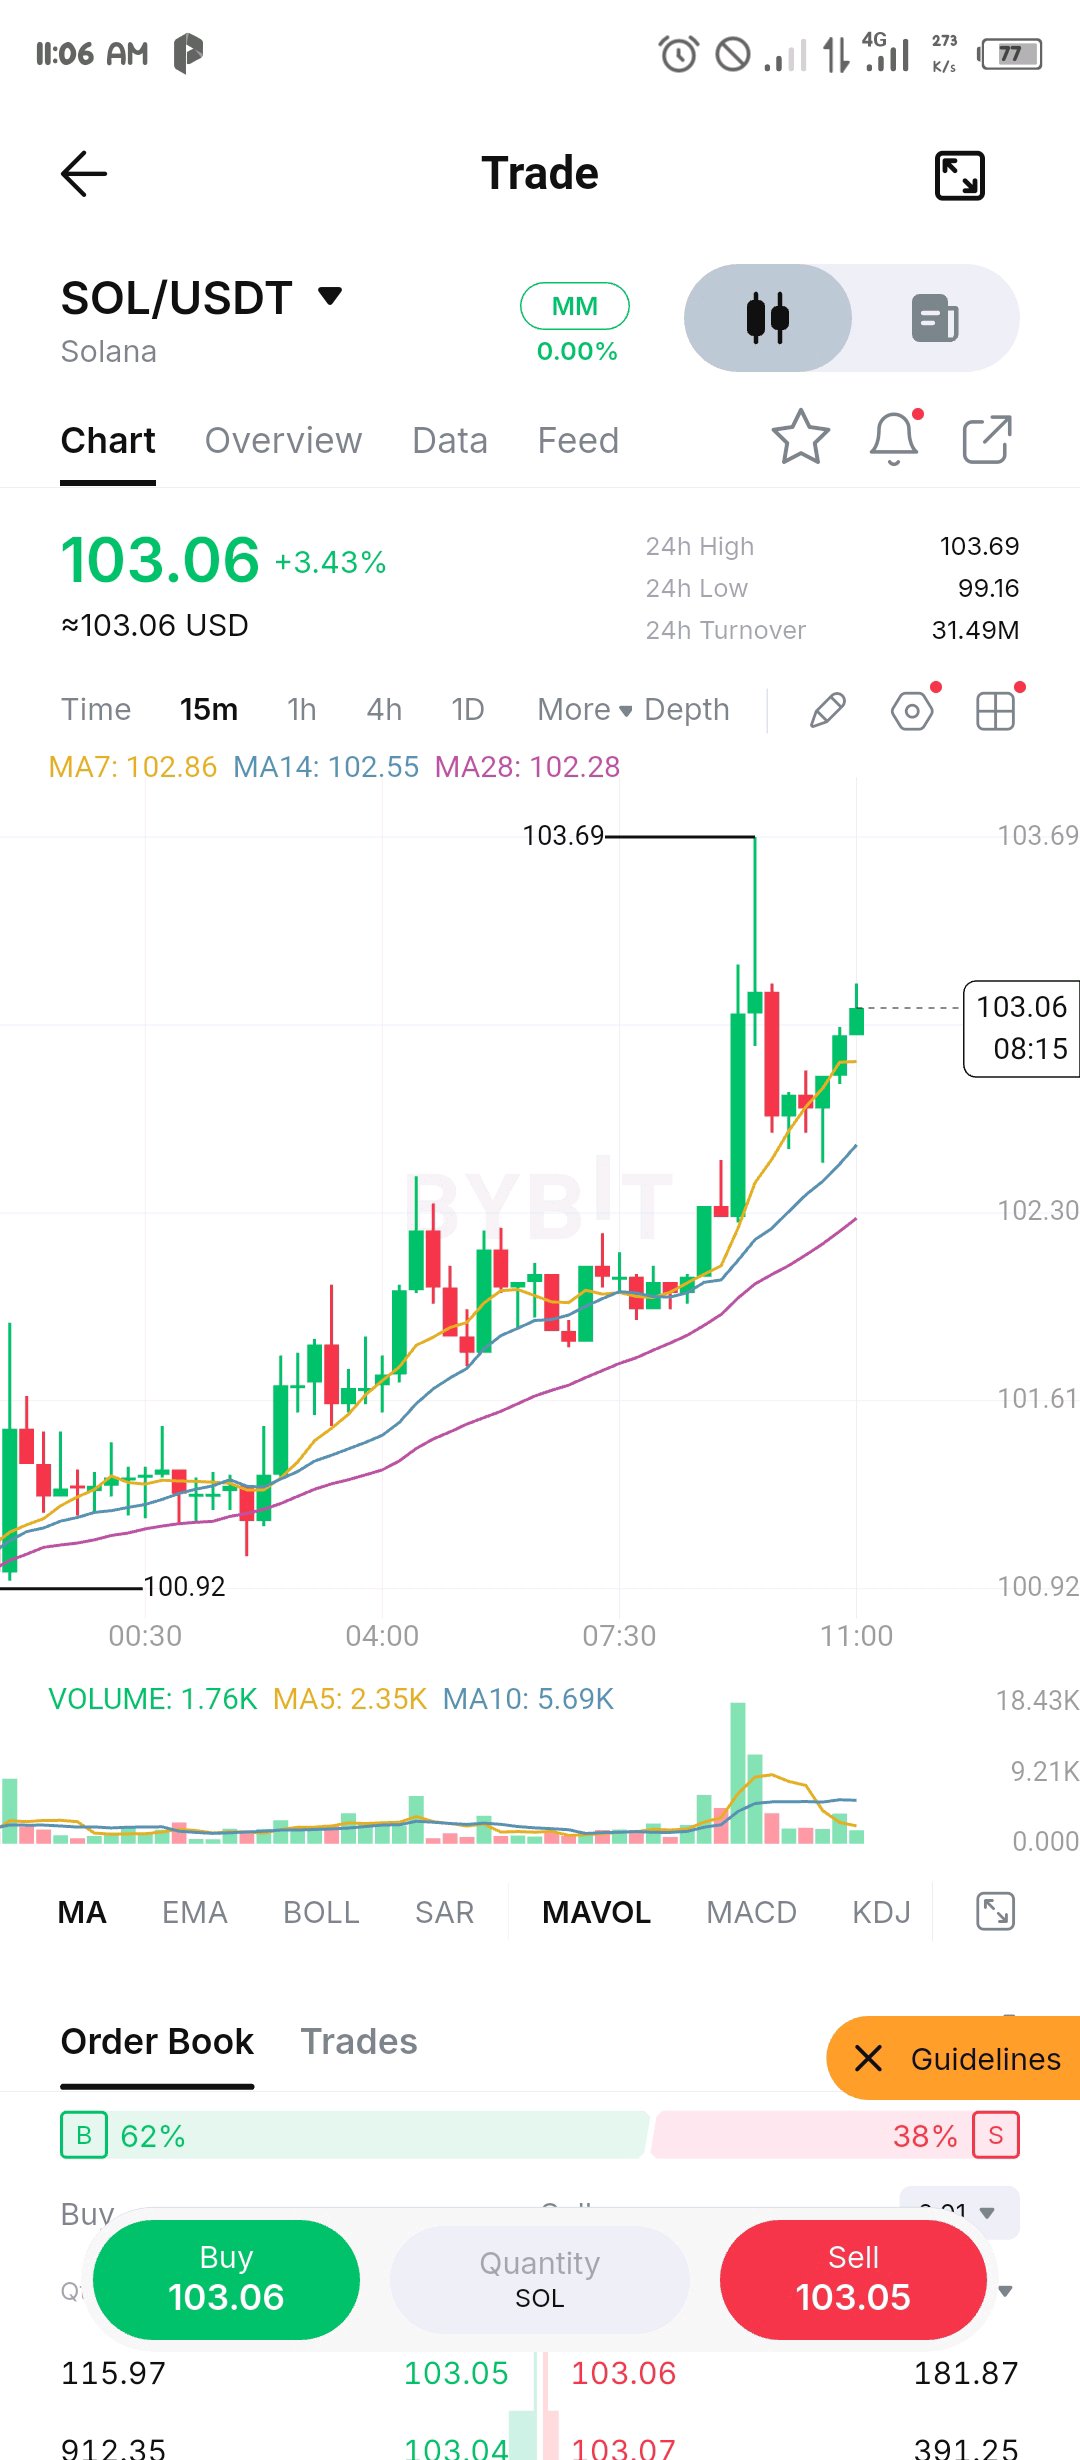
$SOLUSDT breakout retest held right at the old ceiling, and sellers brought little volume SOL broke out of its multi-hour base on the heaviest volume on the chart and ran to a 103.69 spike. Then it did what healthy breakouts do and came back to test the old ceiling. The dip bottomed around 102.49, right on top of the 102.4 area that capped price during the base, and it came on a fraction of the breakout candle's volume. Since then price has recovered to 103.06 and sits above all three averages. The MA7 (102.86), MA14 (102.55) and MA28 (102.28) are stacked in order and fanned out, and the order book is leaning 62/38 to bids, which I'd count as a mild plus, not a signal. What's left to prove is the 103.69 high. Price has only reclaimed part of the spike, and the latest candle has an upper wick near 103.25, so sellers are still active up there. A 15m close above 103.69 on rising volume would confirm the leg. Underneath, 102.5 is the line. If it goes, the retest has failed and the old base is back in play, and the MA14 at 102.55 goes with it. $SOLUSDT #ByXIMPACT
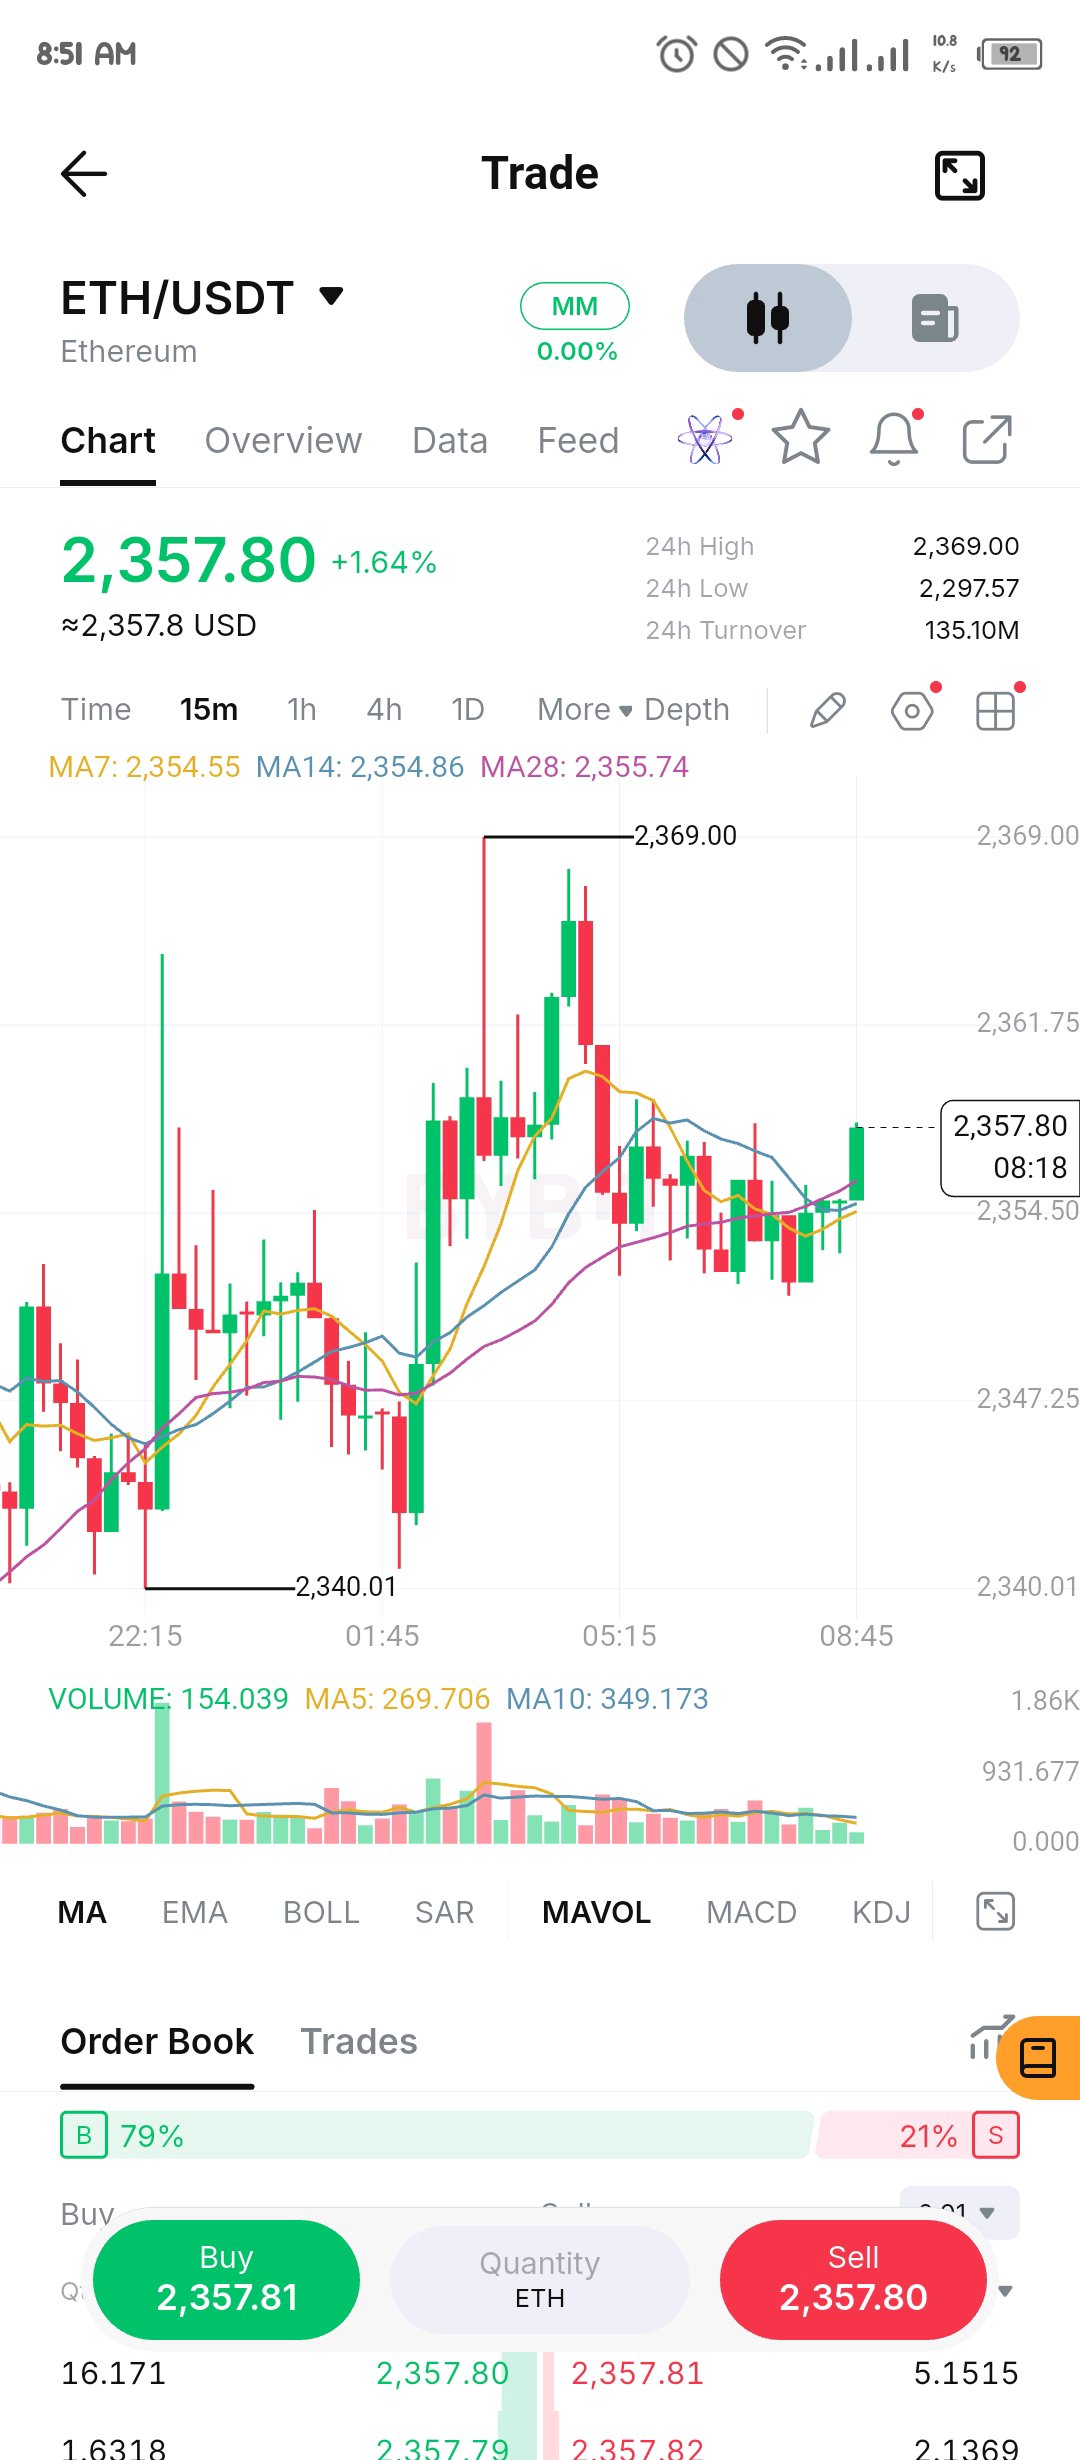
$ETHUSDT order book is 79% bids, but the chart still has a ceiling to clear The ETH order book shows 79% bids against 21% asks, which looks bullish on the surface. I weigh it lightly, because resting orders are the cheapest signal to show and they only count if price follows through. On the 15m, price is 2,357.80 and the picture is base, run, fade. ETH built a double bottom around 2,340, ran to 2,369 with two spike rejections up there (2,369.00 and about 2,367.7), then stepped down. Every bounce since has stalled around 2,358, and this is the third push into that same area. Meanwhile the MA7, MA14 and MA28 (2,354.55, 2,354.86 and 2,355.74) sit within about 1.2 points of each other, so the averages aren't giving a lean either way. The levels: a 15m close above roughly 2,359 clears the cap that has turned back the last bounces and brings the 2,367 to 2,369 zone back into play. The line underneath is the latest swing low near 2,351. Losing it, and the MA cluster with it, would make this a lower-low sequence and put the 2,340 double bottom in view. Until one of those breaks, I'm treating the bids as noise. $ETHUSDT #ByXIMPACT
$ENAUSDT held the half-way retrace, and the current 15m candle is taking back the whole MA cluster The pullback from 0.21639 has now bottomed twice in the 0.207 area, right above the 50% retrace of the leg up from 0.19744 (about 0.2069). That's a healthy dip: orderly, with the half-way level doing its job. The turn is the current 15m candle, which is still forming. It has pushed from roughly 0.2081 to 0.2123 in one go, back over the MA7 (0.20957), MA14 (0.20986) and MA28 (0.21047), which had squeezed into a band less than 0.5% wide. Volume on it is already about 1.7x its 5-candle average (1.53M against 916K) with time still left on the clock, so there's real participation behind this move, unlike the drift down that came before it. I'd treat it as a developing signal until the candle closes. Holding above the top of the MA band near 0.2105 keeps the reclaim valid and puts the 0.2136 wick high, then the 0.21639 high, within reach. A close back under the band would say the reclaim failed, and the 0.207 area becomes the line to watch again. $ENAUSDT #ByXIMPACT

$HYPEUSDT is pressing yesterday's 80.637 high with the averages fanned out underneath HYPE is back at the doorstep of yesterday's spike high. Price is 80.252, with the 24h high at 80.637 less than half a percent away, and the 15m is built like a trend: MA7 (79.633), MA14 (79.346) and MA28 (78.679) are fanned out in order and all rising steeply, with price riding above the fast one. The way it got here matters. The bounce off 77.184 started with the heaviest volume on the chart, then price built a base between roughly 78.8 and 79.6 and broke out of the top of it. That old ceiling around 79.6 sits almost exactly on the MA7, so it's the first place I'd expect buyers to show up on a pullback. What I'd flag is participation. The breakout candles over the last hour or so came on modest volume compared with that reversal bar. Steady grinds like this can keep going, but they're also the kind that gets sharply faded when price taps a level that rejected it before, and 80.637 did exactly that yesterday. I'd want a 15m close above it with real volume behind it. If instead price slips under the MA7 and the 79.6 shelf, the move is cooling. $HYPEUSDT #ByXIMPACT

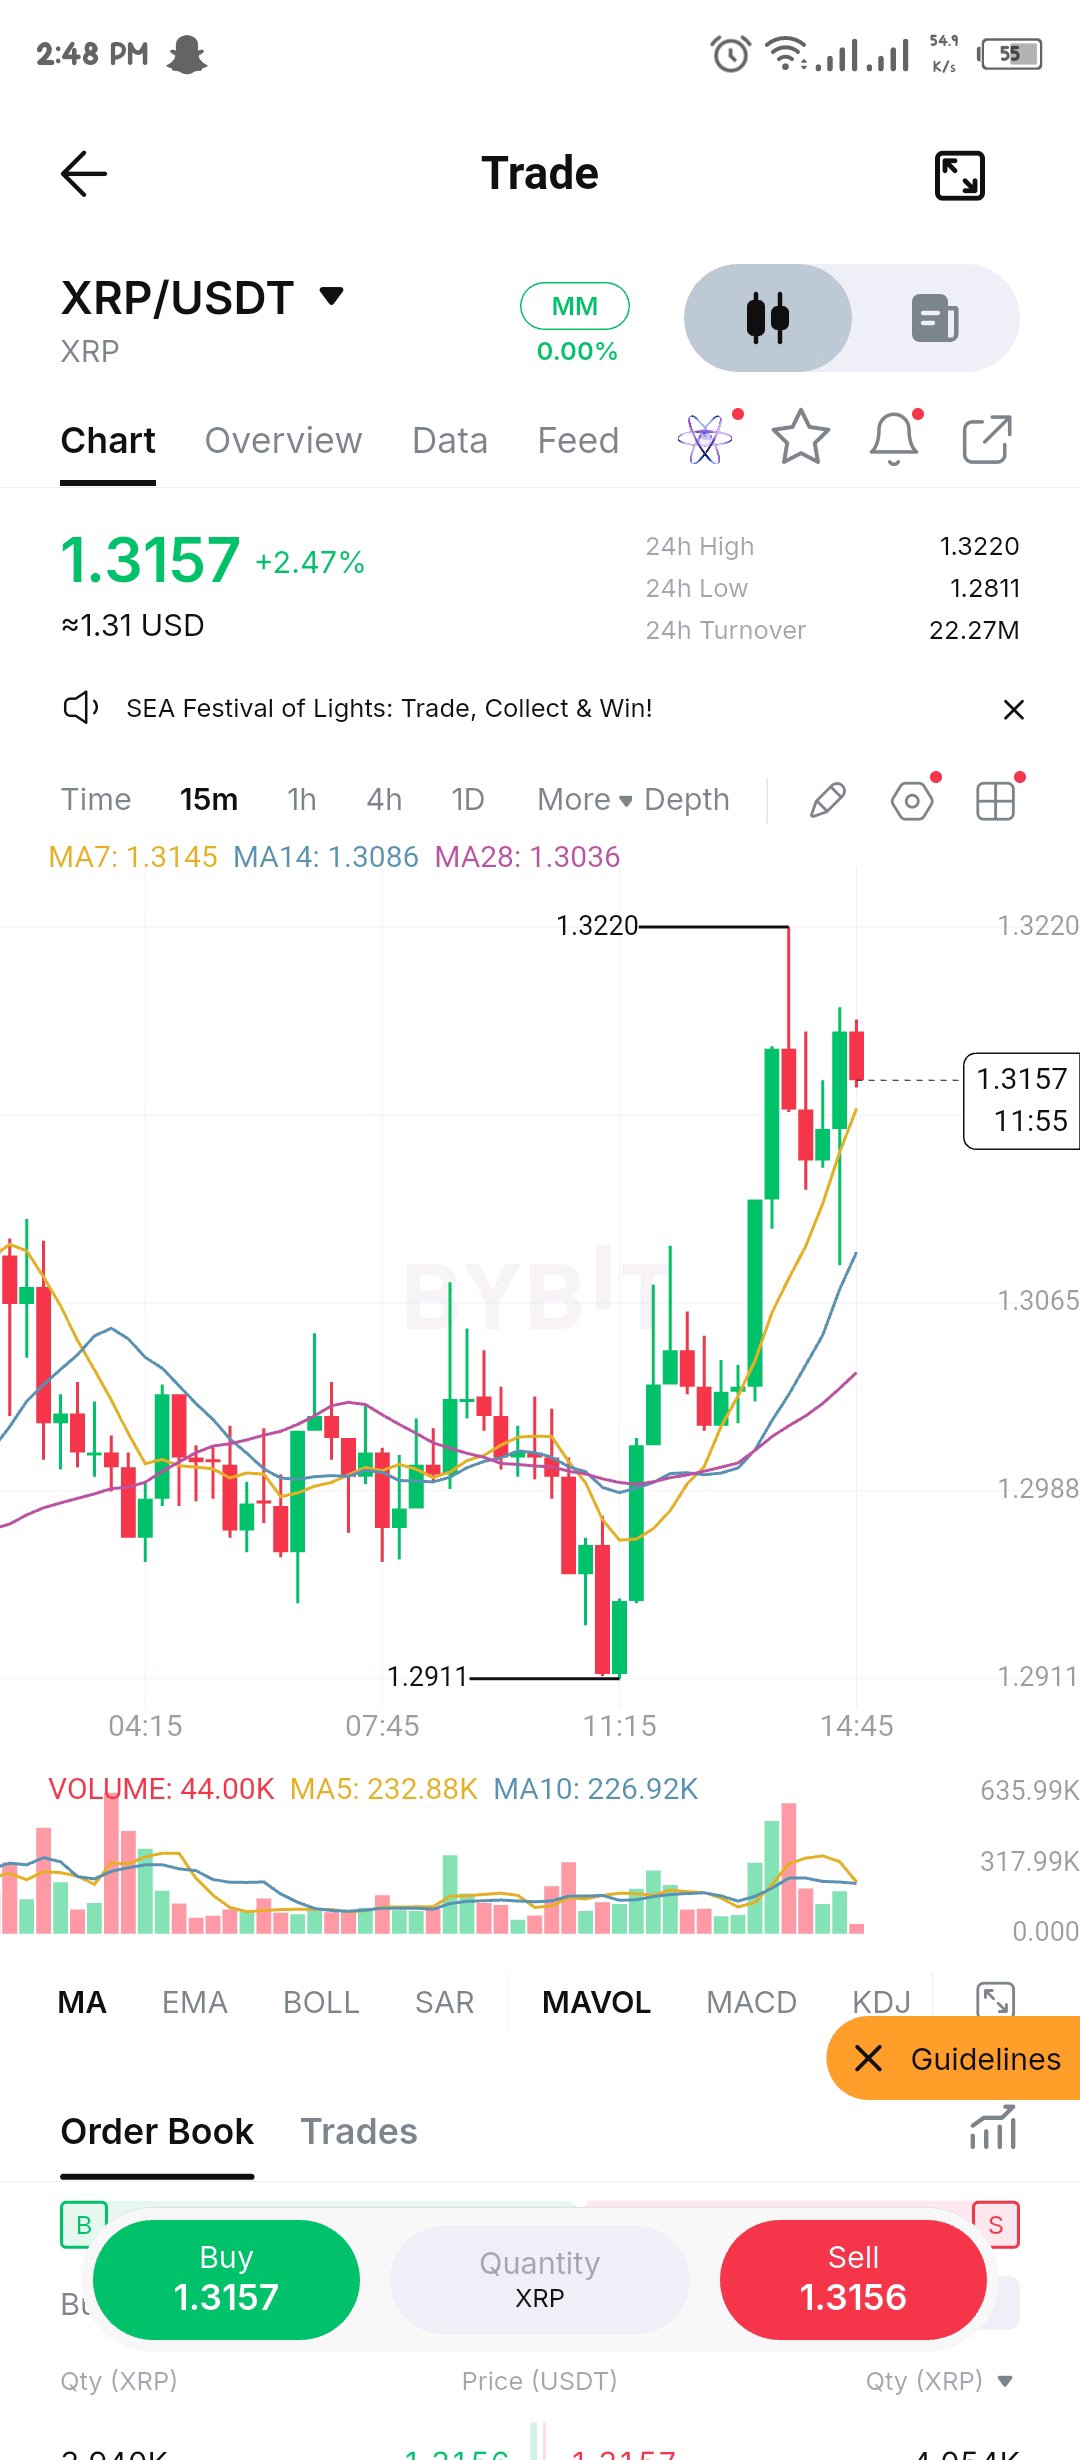
$XRPUSDT breakout is holding: a shallow pullback that was bought right at the MA14 XRP has retraced only about 20% of the move from 1.2911 to the 1.3220 high, and the dip was bought right where it should be. The wick on the last green candle dropped to roughly 1.309, essentially the MA14 (1.3086), and price snapped back above 1.315. For hours before that, XRP was stuck under a ceiling around 1.306 to 1.3075. It cleared that on rising volume, so I now treat that zone as the first support to hold on any deeper pullback. The averages back up the shift: MA7 (1.3145), MA14 (1.3086) and MA28 (1.3036) are stacked in order and all rising, with price on top. Two things keep me from calling it clean. The 1.3220 spike was rejected with a long wick, and the second push only reached about 1.3186, a lower high. Volume has also eased since the breakout candles. A 15m close above 1.3220 would be the clear continuation signal. A close under the MA14 would say the breakout is losing grip, with the old ceiling near 1.306 and then the MA28 at 1.3036 as the next levels. $XRPUSDT #ByXIMPACT
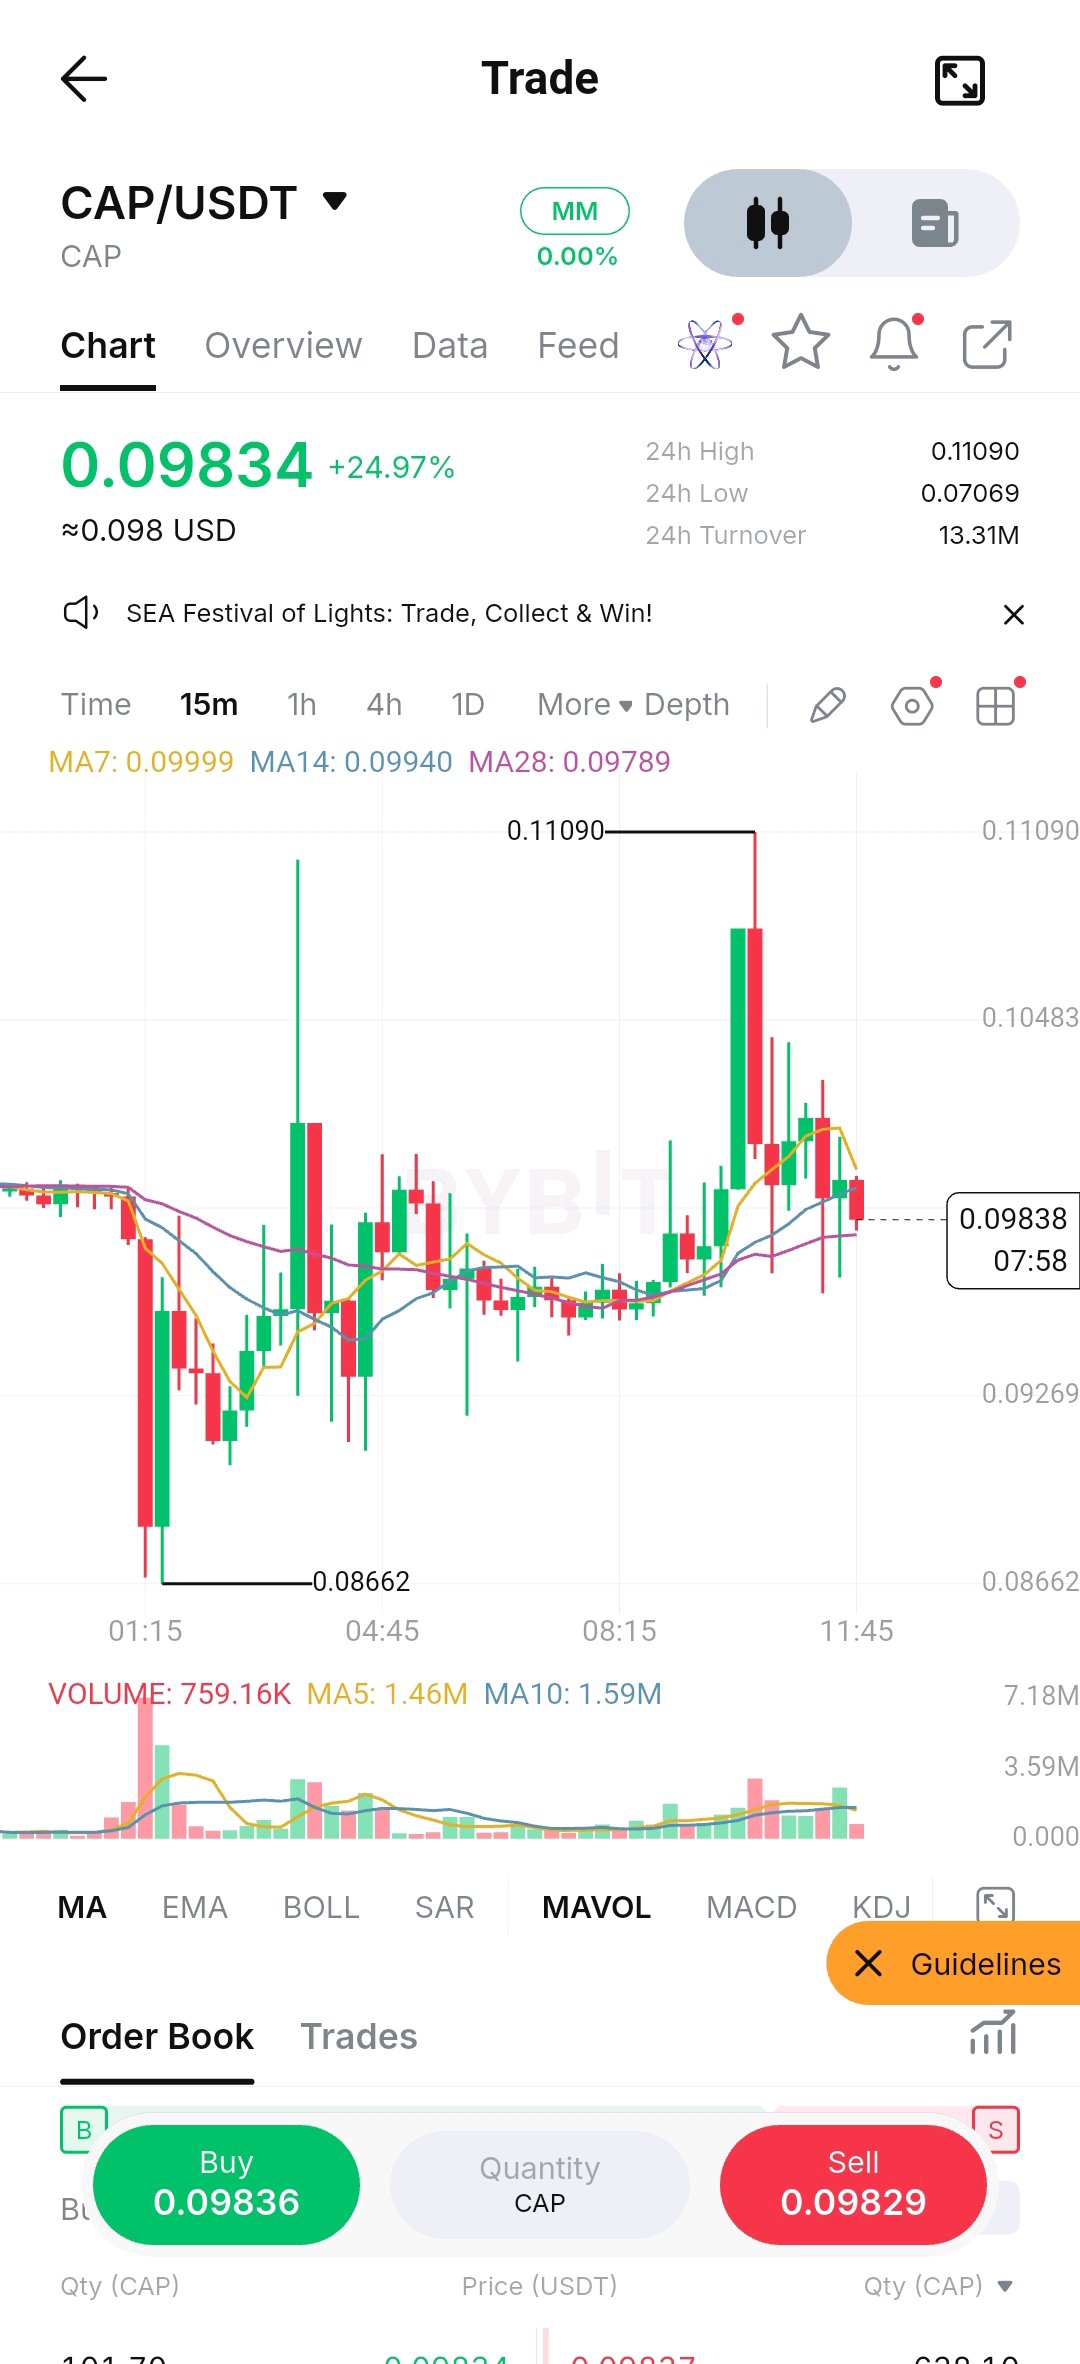
$CAPUSDT 25% day keeps running into the same ceiling near 0.110 0.110 has now turned CAP away twice, both times with a long upper wick: once earlier in the session and again at 0.11090, which set the 24h high. Both pushes were sold, and the latest spike has been handed back entirely, with price now at 0.0983. That fade is easy to misread because the day shows +25%. On the 15m, the MA7 (0.09999), MA14 (0.09940) and MA28 (0.09789) are bunched together and flat, and price is sitting under the first two. That's a market without a trend. Volume has also come in since the spike candle. The levels I'm working with: the last few dips were bought around 0.0960 to 0.0967, so that's the floor. Above, 0.1000 is the first test (round number and MA7), then the lower high near 0.1040, then 0.110 again. A 15m close under 0.0960 would hand control to sellers and put the 0.0866 flush low back in view. Between those levels it's a range, and 0.110 needs a real volume push before I'd call it anything else. $CAPUSDT #ByXIMPACT
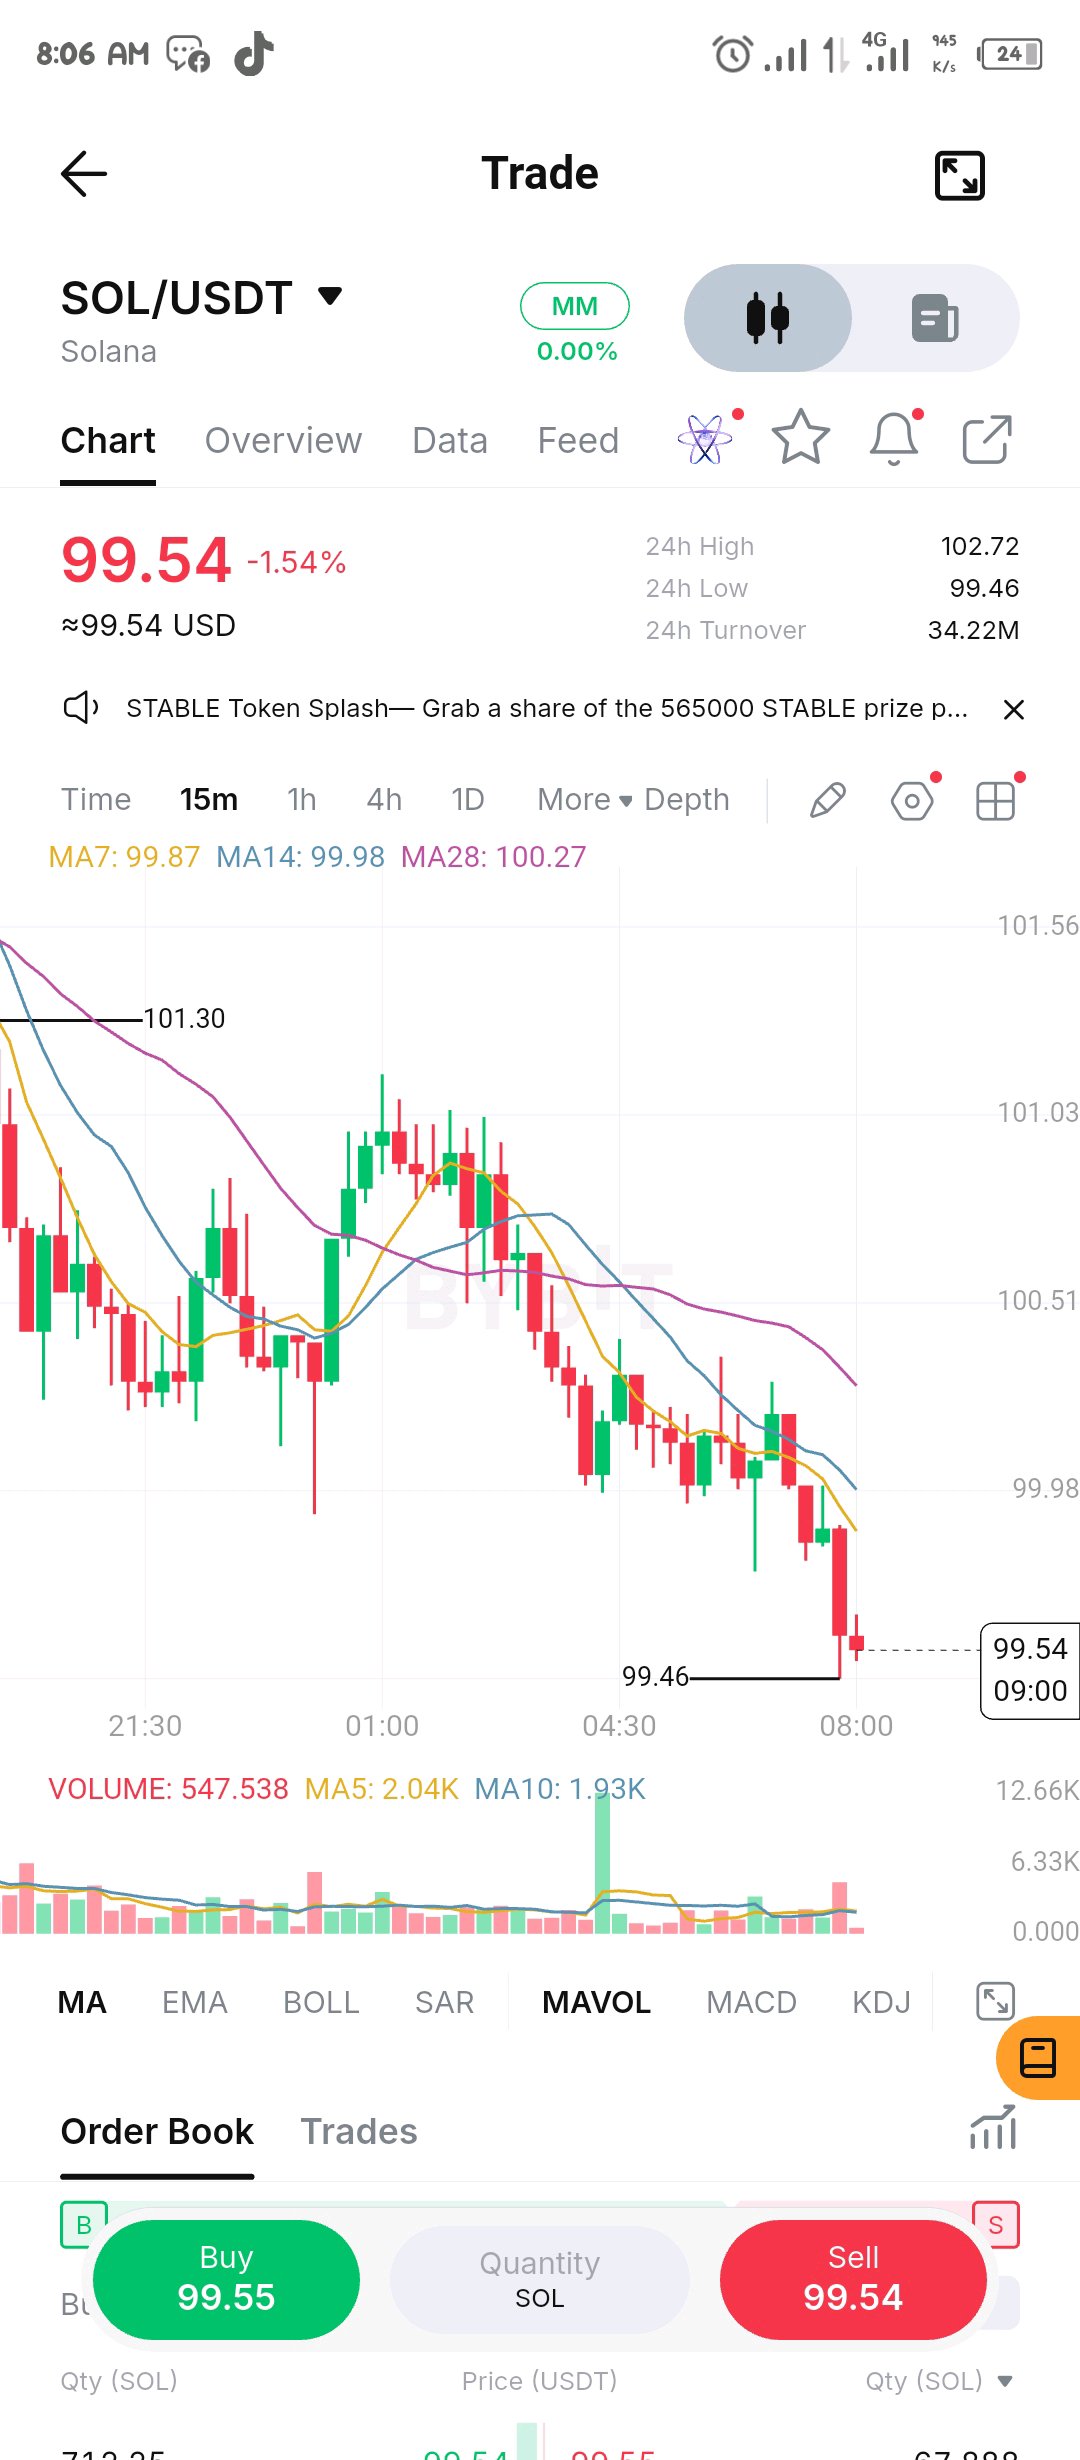
SOL has lost the 100 handle and is now leaning on its 24h low at 99.46 SOL has made lower highs all session and is now sitting just 0.08 above the 24h low. Price is 99.54, after losing the 100 handle. The structure is clean and bearish. The MA7 (99.87), MA14 (99.98) and MA28 (100.27) are stacked in that order, all sloping down, with price under the lot. The last bounce stalled around 100.3, below the MA28, and the next green candle failed right under 100.00, so that level has flipped from support to resistance. Sellers also stepped up on the breakdown candle, with volume clearly above its recent average, so this isn't just drift. The level is 99.46. A 15m close beneath it leaves no support on this chart, so I'd expect it to move quickly. On the other side, a reclaim of 100.00, where the MA7 and MA14 sit at 99.87 and 99.98, would be the first bounce worth taking seriously. Until then I treat rallies as relief, not reversal. Lows this obvious do get defended, though, so the reaction at 99.46 matters more than my bias. $SOLUSDT #ByXIMPACT
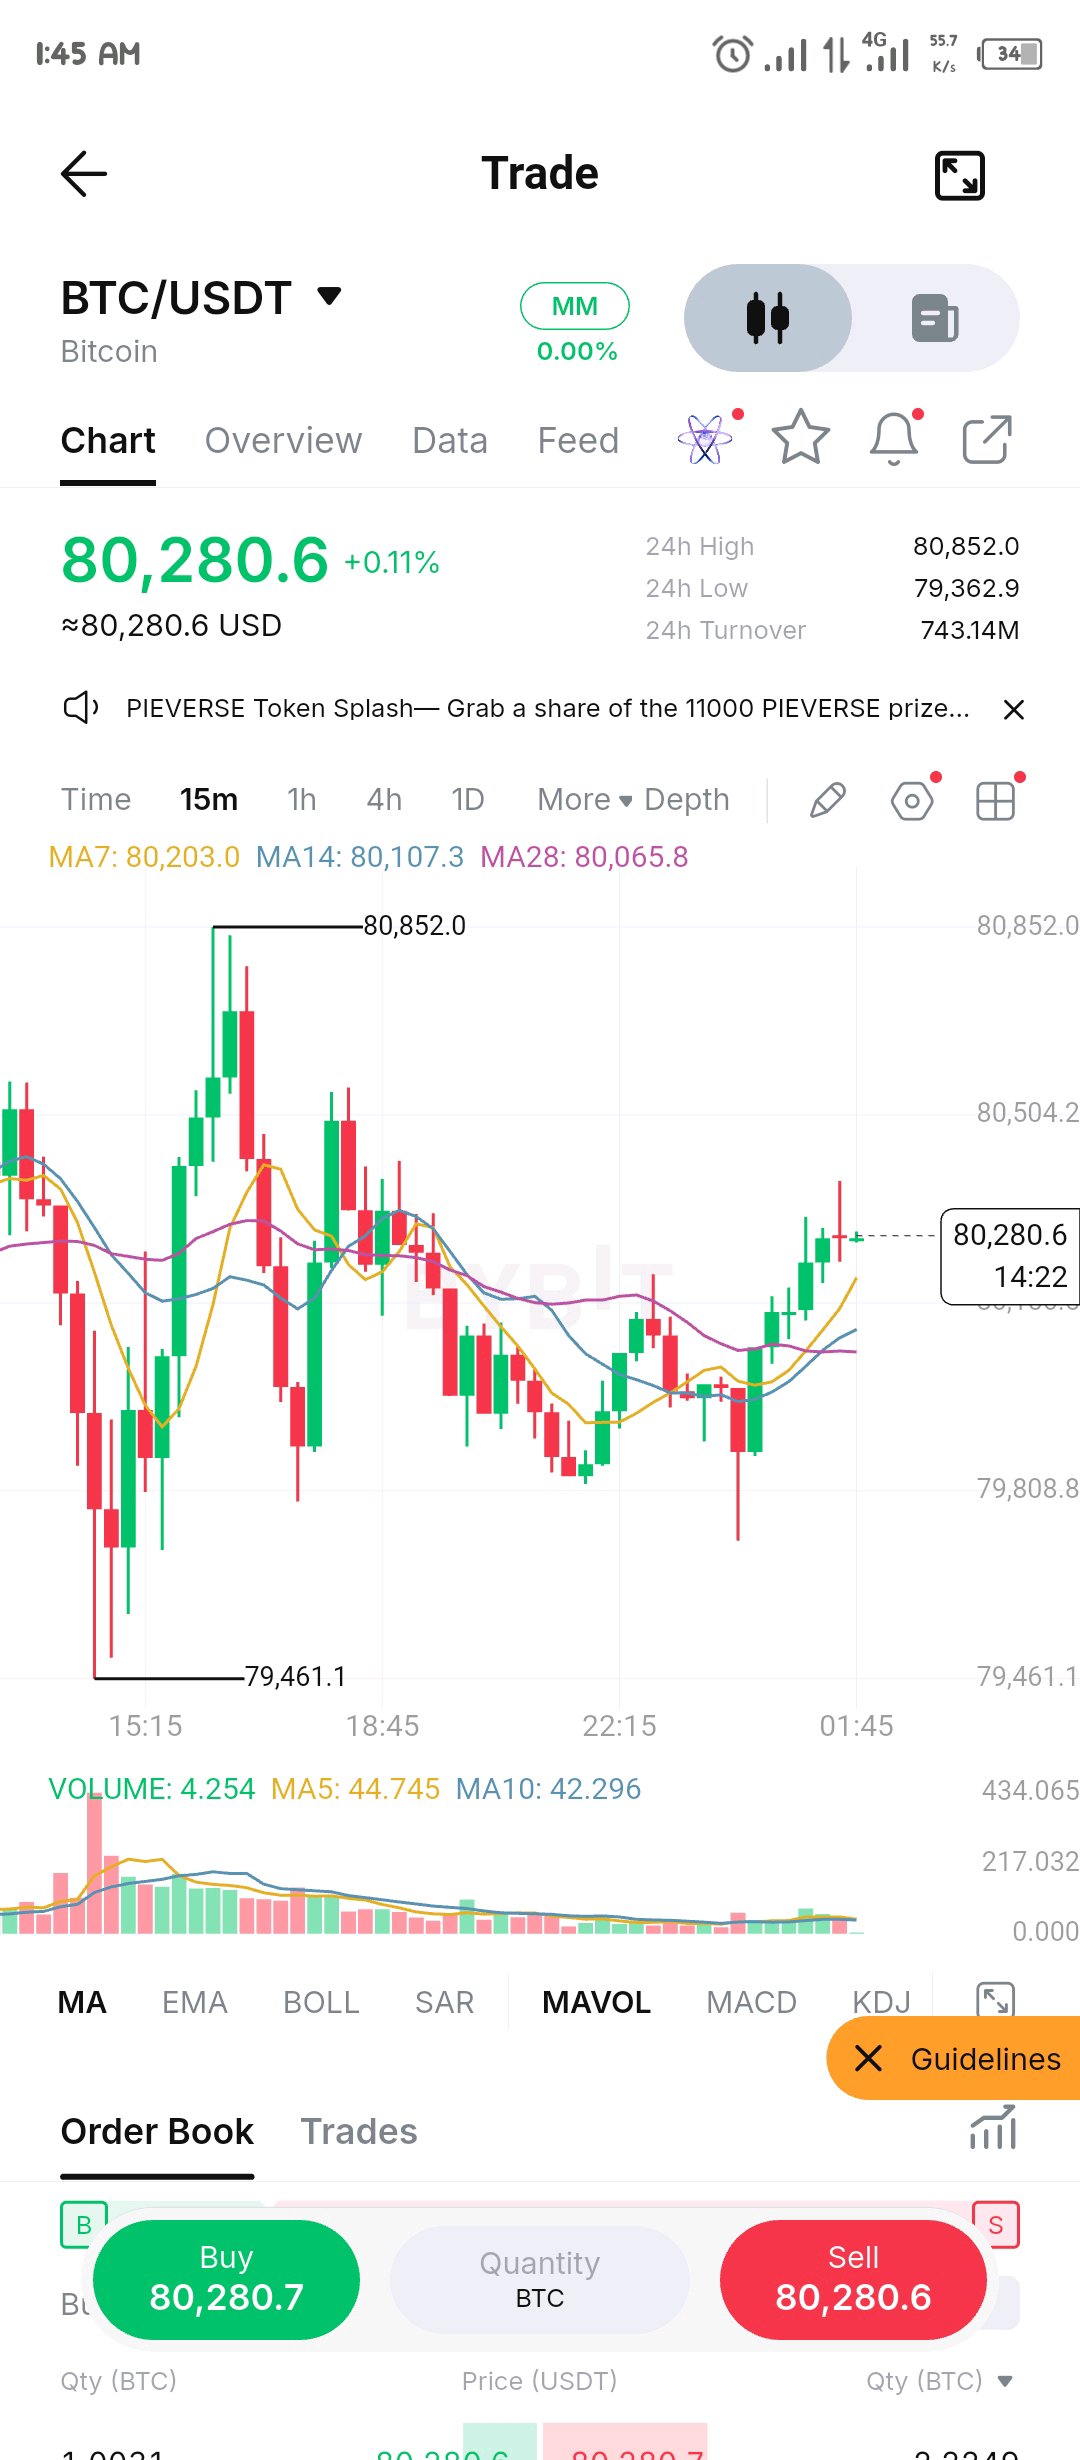
BTC ran the 79,825 lows, got no follow-through, and is back above all three averages Two things stand out on the BTC 15m right now. The latest dip wicked down to roughly 79,715, under the previous swing low near 79,825, and a big green candle took it all back almost immediately. That looks like a sweep of resting stops below the low with no follow-through from sellers, and that's usually more informative than a clean breakdown. The second thing is what's missing: volume. It has faded steadily since the early flush to 79,461, and recent bars are only a sliver of that. A bounce on this little participation can hold a range, but it's not the kind of move that trends. Price at 80,280 has retaken the MA7 (80,203), MA14 (80,107) and MA28 (80,066), which are bunched within about 140 points, with the first two turning up. Overhead, the lid to watch is around 80,550, where the last bounce stalled, then the 24h high at 80,852. Underneath, the 79,715 wick low is the line that matters. Until one of those edges breaks on a real volume push, I'd call this a range with a constructive tilt. $BTCUSDT #ByXIMPACT
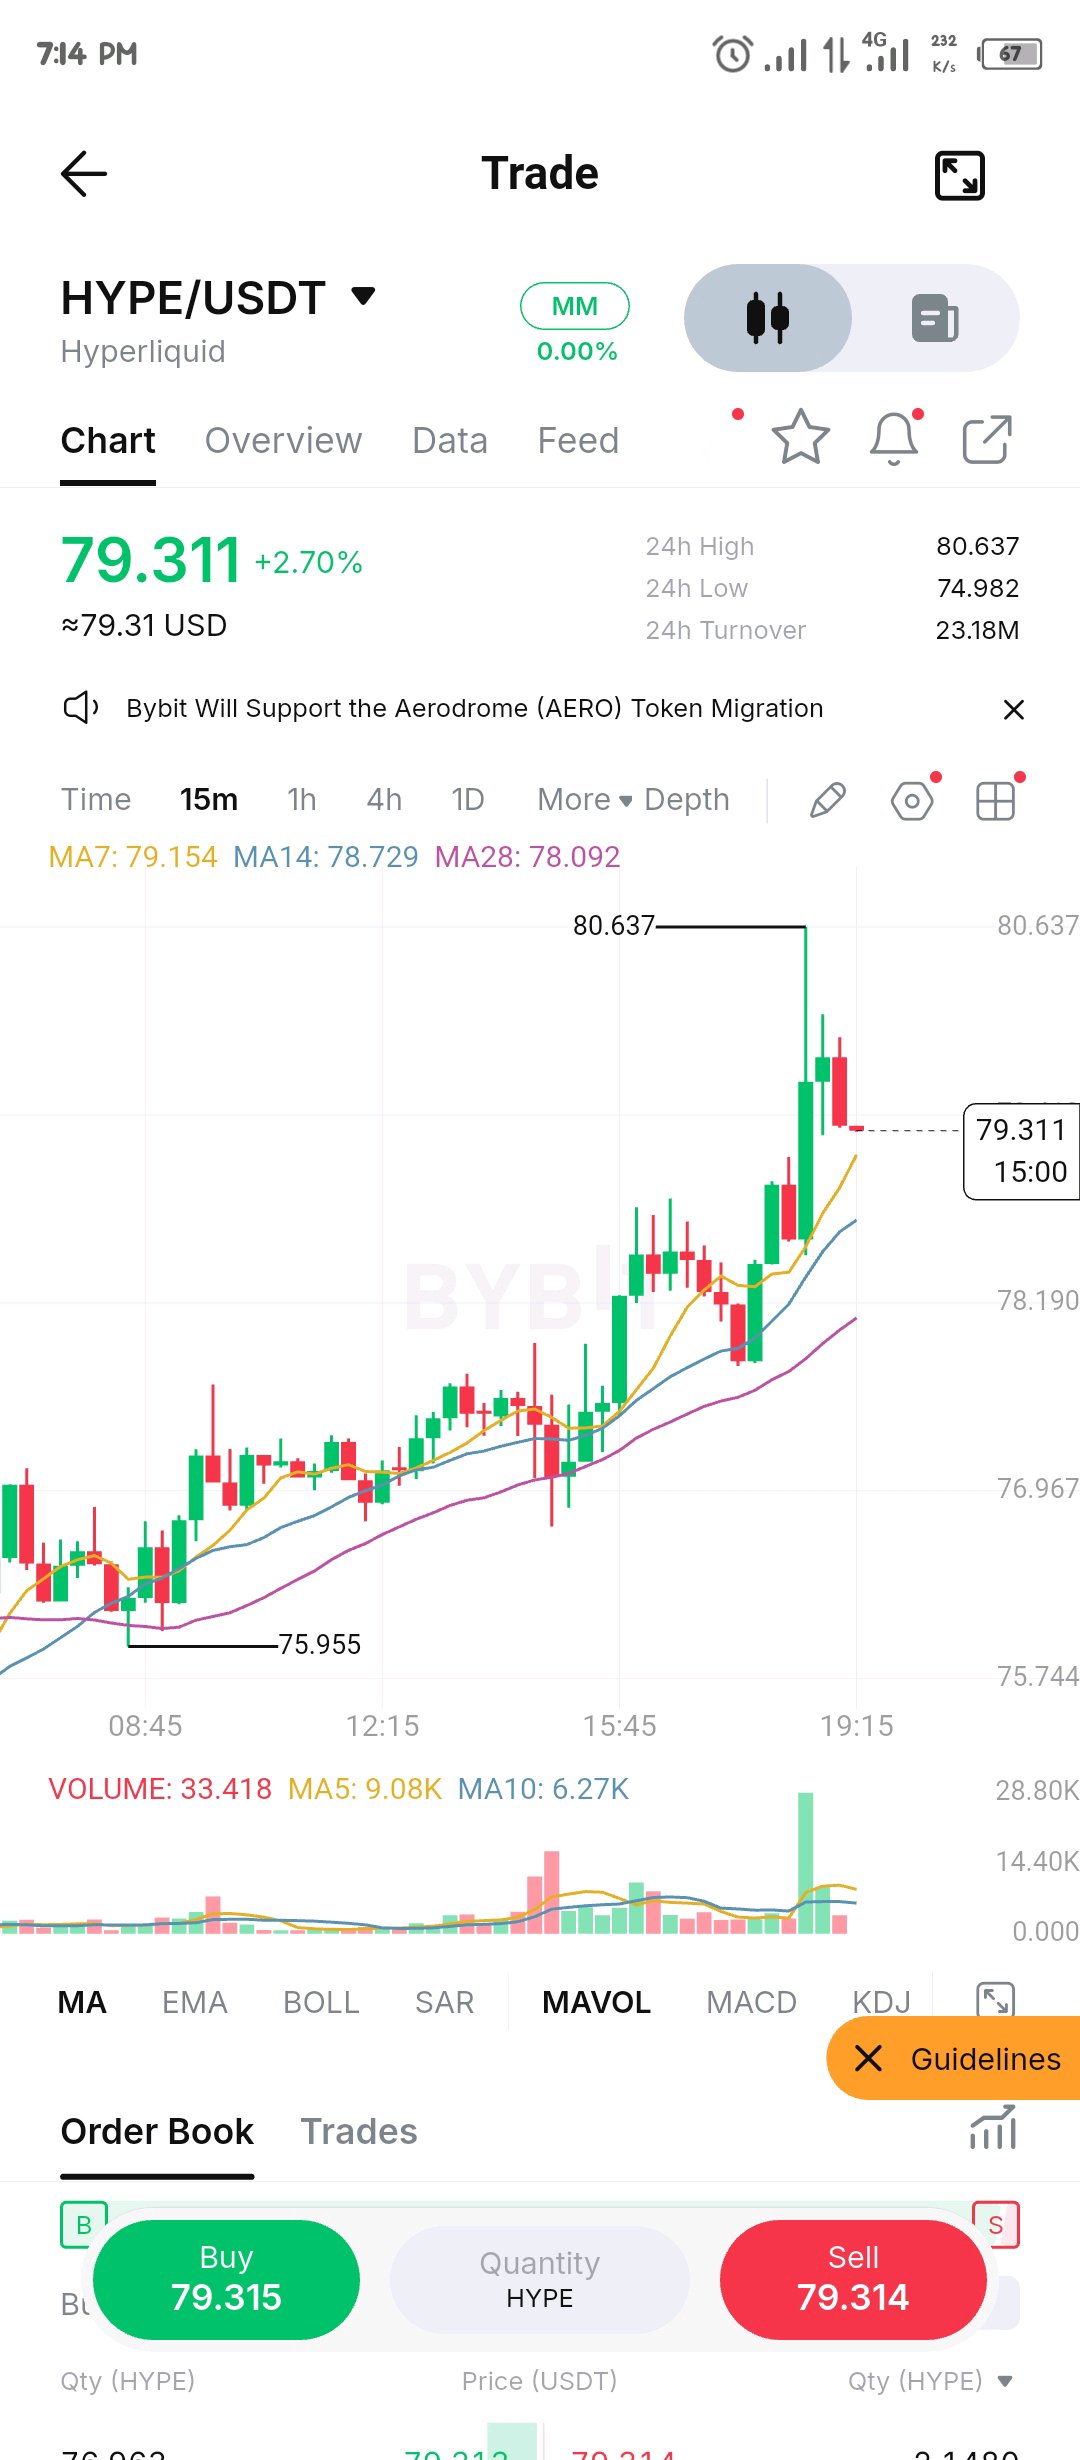
$HYPEUSDT spike to 80.637 got sold fast, but the uptrend underneath is still intact HYPE ran into 80.637 on by far the heaviest volume on this chart, and the candle closed back down near 79.6, leaving a long upper wick. The next few candles couldn't get back above about 80.2, and price is now at 79.31, right around the MA7 (79.15). That's a rejection at the highs, but it hasn't broken the structure. The averages are still stacked and rising (MA7 79.15, MA14 78.73, MA28 78.09), and the higher lows have stepped up since 75.955, with the latest near 77.8. Volume has dried up since the spike, so for now this reads as a pause after a failed push, not a reversal. The MA14 near 78.7 is my line. Holding it keeps 80.637 open for another test. A 15m close under it turns that wick into a lower-high setup and brings the 77.8 higher low into play. Until 80.637 clears with volume behind it, I'd treat every move up into that level as a test, not a breakout. $HYPEUSDT #ByXIMPACT
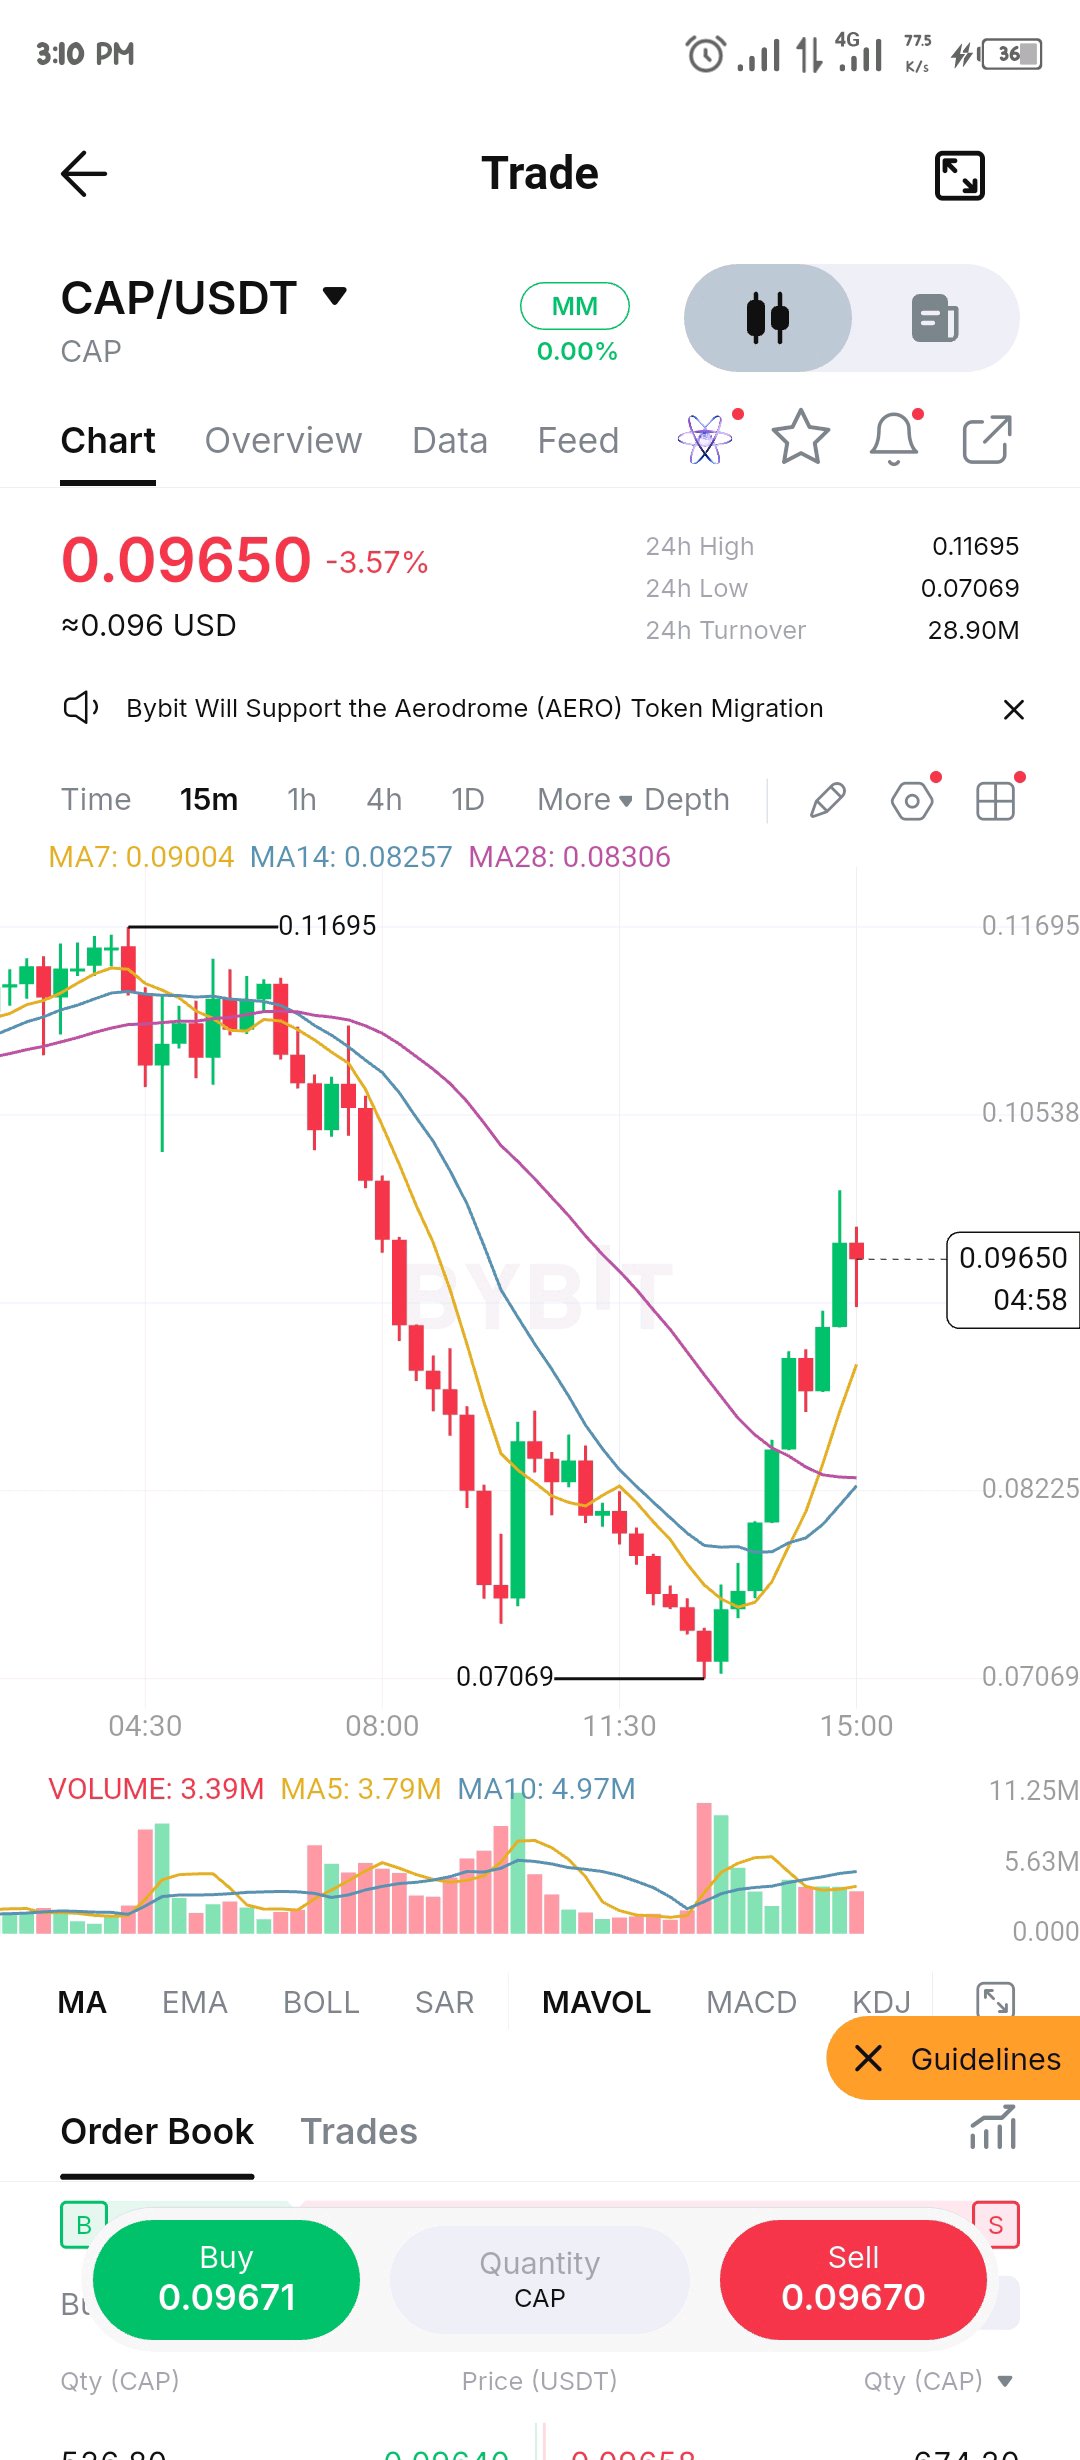
CAP is up 36% off the 0.07069 low, but it's stretched well above its averages CAP fell almost 40% from 0.11695 to 0.07069, then retraced a bit more than half of that drop in one clean run to 0.0965. The turn off the low came with decent volume, but participation has faded since. Current volume is 3.39M, against a 10-period average near 4.97M. My concern is distance. Price is roughly 7% above the MA7 (0.09004), while the MA14 and MA28 are still flat down near 0.083. Vertical moves like this rarely run uninterrupted. The upper wicks around 0.100 show sellers are already leaning on that zone, and it lines up with the 61.8% retrace of the whole drop near 0.0993. The levels I'm using: the 50% retrace near 0.0938 is where I'd want buyers to defend, and losing it points back toward the MA7 around 0.0900. A 15m close above 0.0993 with volume would put the 0.1054 area next. With a 24h range this wide, this is a fast, volatile market, so personally I'd rather size small and let it prove itself than chase a green candle. $CAPUSDT #ByXIMPACT
ETH keeps getting turned away near 2,338, and the averages are squeezing together ETH tagged 2,338.40 earlier, pulled back, then pushed again and stalled almost exactly at the same level with a long upper wick. The second push was weaker than the first, and volume has stayed light compared with the 09:30 flush, when 2,304.41 got bought back by a single big green candle. What keeps the range from being bearish is the higher low in between, around 2,324, so sellers haven't been able to press below either. The MA7 and MA14 are sitting almost on top of each other (2,330.47 and 2,330.70) with the MA28 (2,325.38) rising just underneath. Price is right on that cluster. That's compression, and compressions tend to end in a move, but right now there's no edge until one side commits. The plan is simple. A 15m close above 2,338.40 with volume opens the way toward the 24h high at 2,365.44. A close below 2,324, which is also just under the MA28, brings 2,304.41 back into view. Anywhere in between, I'm leaving it alone, because a roughly $14 range isn't worth the fees. Until one of those breaks, it's a range, and I'd trade it like one. $ETHUSDT #ByXIMPACT

BTC bought the dip twice, and the second one left a higher low The 79,362.9 wick set the 24h low, and BTC was bought back off it within a candle or two on the heaviest volume on the chart. That was the first dip buyer. The second showed up near 09:00, when the pullback only reached about 79,670 before a big green candle took over. That's a higher low. From there BTC cleared the roughly 80,290 swing high and ran to 80,585. The averages are now stacked in order (MA7 80,378, MA14 80,198, MA28 80,078), all pointing up, with price riding above the fast one. That looks like a trend structure, not a one-candle bounce. I wouldn't chase it here, though. The candles at the top are getting smaller, volume has cooled since the breakout, and the order book is nearly even at 46/54. 80,585 is the immediate ceiling and the 24h high at 80,961 is the bigger target above it. While price holds the 80,200 to 80,380 area, I'd rather look for pullbacks than buy the highs. A 15m close back under 80,198 would say this push got ahead of itself, and the 79,670 higher low becomes the level that matters. $BTCUSDT #ByXIMPACT

SOL absorbed the 99.89 flush fast, now comes the harder part SOL dropped to 99.89 on the heaviest volume on the chart, and within a couple of candles it had taken back most of that move. A quick reclaim after a volume spike usually means late sellers got absorbed. It doesn't mean the trend has flipped. Price is now above all three averages. The MA7 (101.33) has turned sharply up, while the MA14 (100.94) is only just curling and the MA28 (101.04) is still flat and bunched right beside it. Momentum has shifted, but the move hasn't had time to prove itself. What keeps me cautious is the last few candles. They're small, with upper wicks stalling just under 101.69, volume on the bounce is fading, and the book is leaning 67% sell. If buyers can't clear that high, I'd expect a rotation back into the 100.94 to 101.04 average zone, and that's where I want to see dip buyers show up. Losing it puts 99.89 back in play. A close above 101.69 on real volume is what I'd call continuation, with the 24h high at 102.26 as the next reference. Short-term read only. Until 101.69 breaks with volume, I'm treating this as a recovery that still has to earn its keep. $SOLUSDT #ByXIMPACT

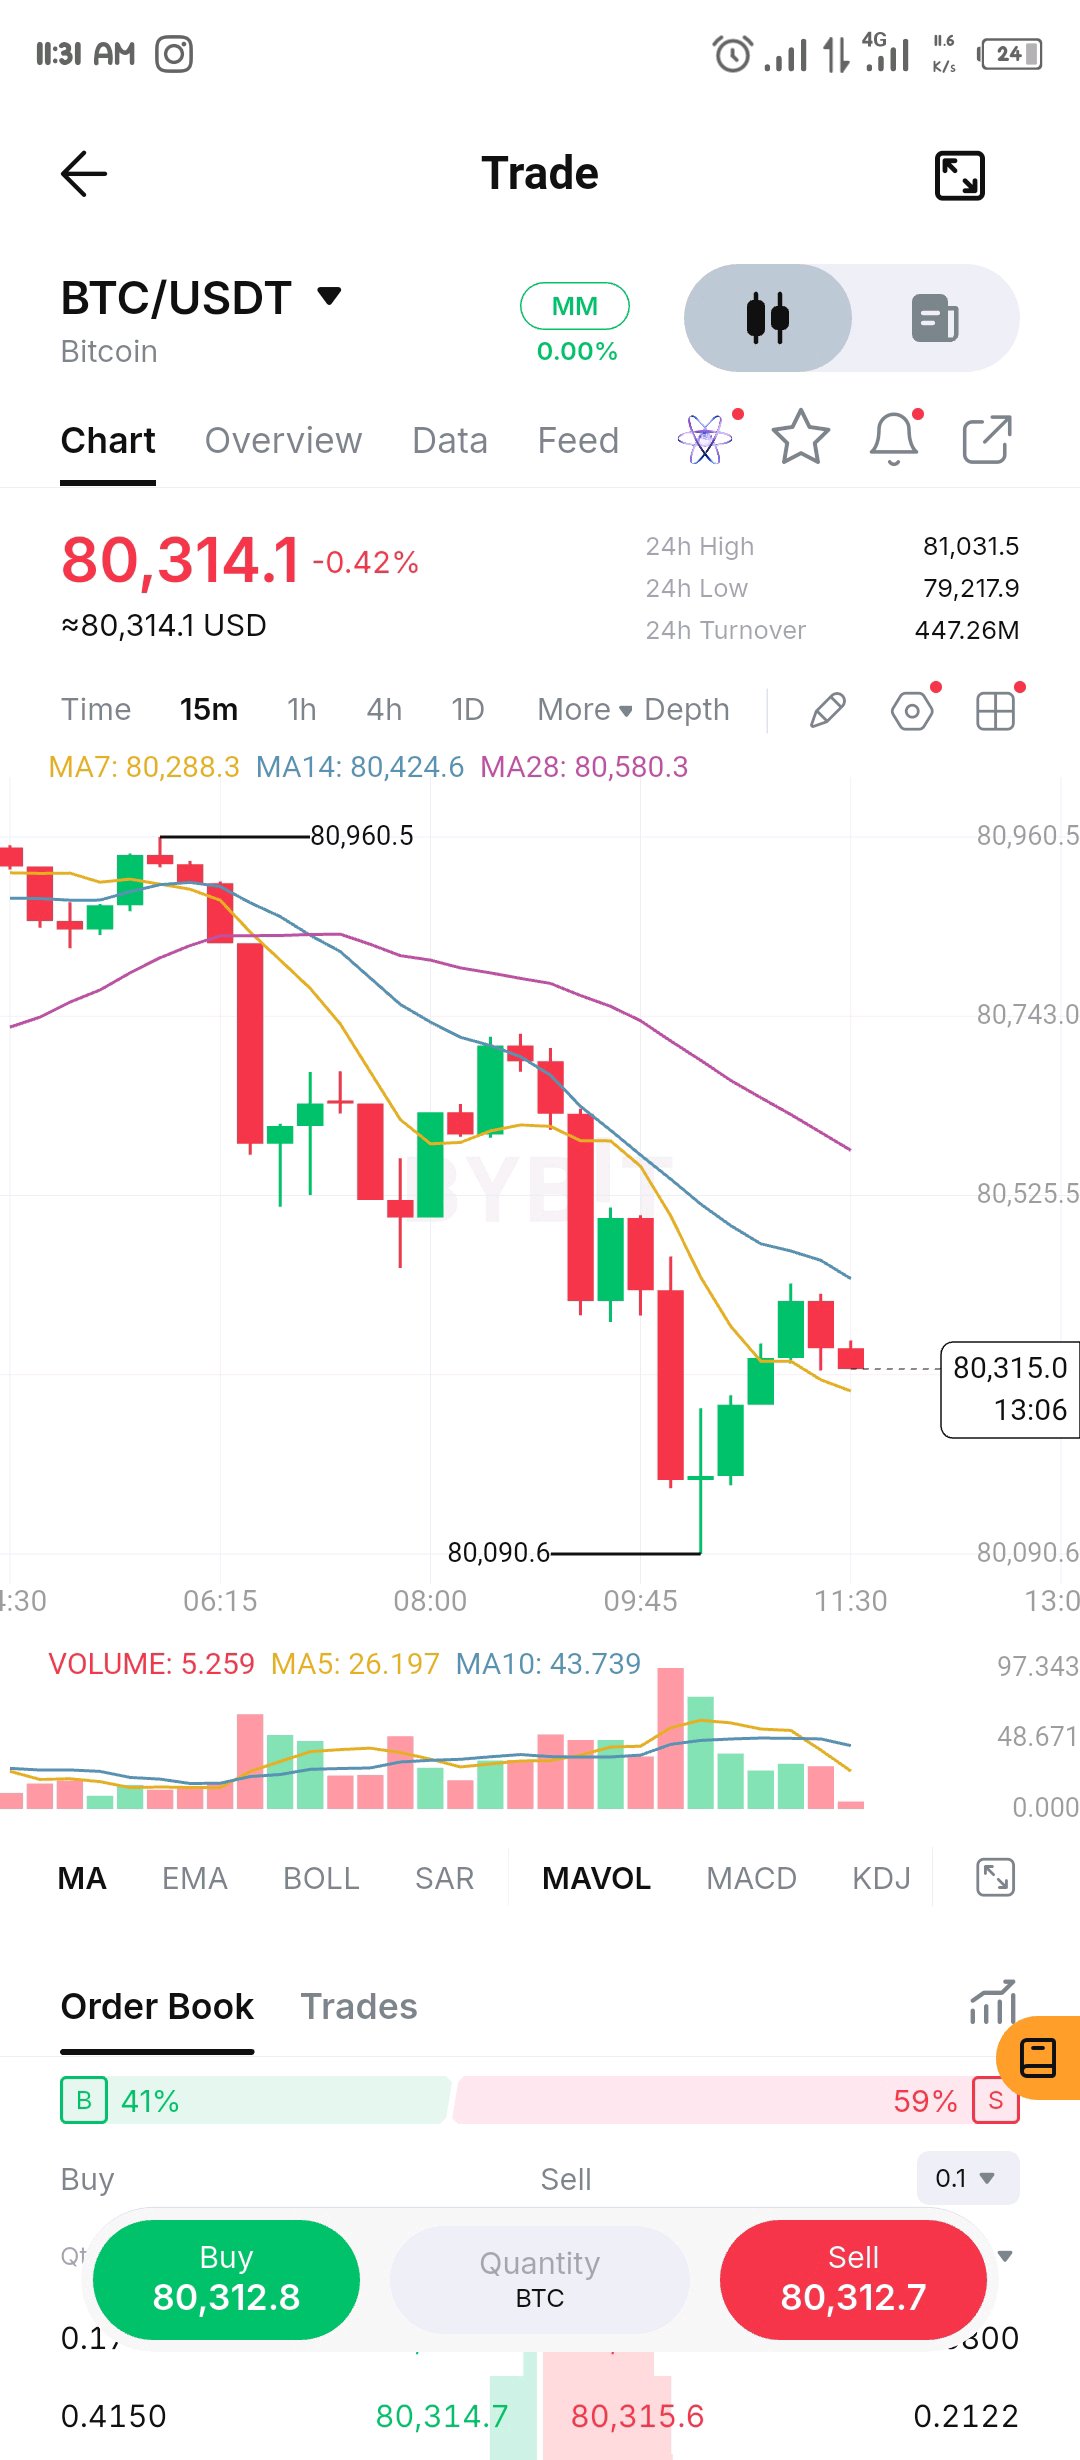
BTC 15m: This bounce is running into a stack of falling averages BTC sold off hard from the 80,960 area and the 15m has printed lower highs ever since. The drop into 80,090 came with the heaviest volume on screen. Buyers did step in there (long wick), but the bounce since has come on visibly thinner volume. Price is now sitting right on the MA7 (~80,288), with the MA14 (~80,425) and MA28 (~80,580) overhead, all sloping down. Until a 15m candle closes back above the MA14, I'm treating this as a pullback inside a short-term downtrend, not a reversal. The order book leaning 59% sell fits that read, but I wouldn't trade off it alone. What I'm watching: - A reclaim and hold above ~80,425 puts the MA28 near 80,580 in play as the next test - A clean 15m close under 80,090 opens room toward the 24h low around 79,218 - Between 80,090 and 80,425 it's mostly chop, and sitting out beats forcing an entry This is a short-term read only, and the 4h can tell a different story. Are you treating 80,090 as the line, or do you want to see more before calling it? $BTCUSDT #ByXIMPACT