ZYVORX
* Bybit Crypto Trader ⚡ | Daily Insights & Market Updates | Join using my link ⬇️
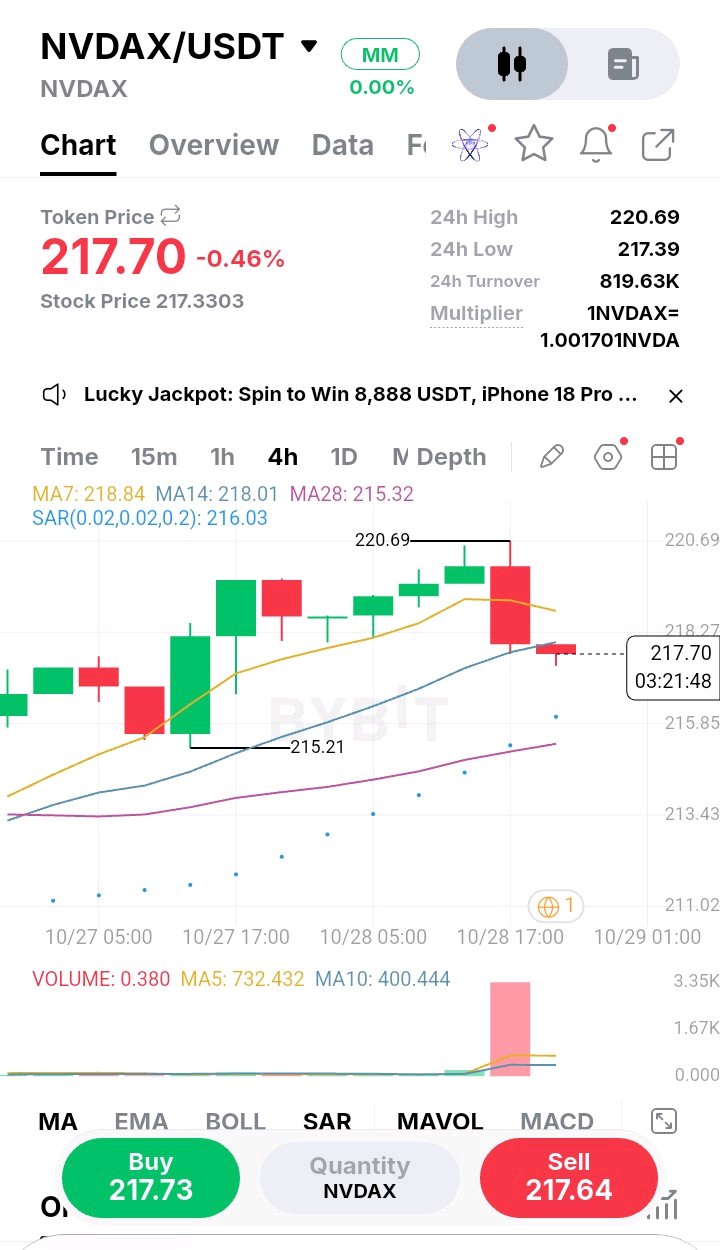
What catches my eye immediately is that massive volume spike on the latest red 4H candle. NVDAX pushed up to 220.69, but sellers hit it hard, dumping price straight through the MA7 and down to 217.70. That kind of volume on a red candle usually isn't just a casual pullback or a healthy retracement. It tells me real distribution is happening and that sellers are actively defending the highs. Notice how price is now sitting right on the MA14 at 218.01. This is the immediate test for the bulls. If buyers were truly in control, they would have defended that push to 220 much better. The fact that we sliced through the short-term moving average so quickly tells me momentum is shifting and the structure is starting to look heavy. I’ve been caught holding a long through a high-volume drop like this before, stubbornly thinking it was just a shakeout to grab liquidity, only to watch it keep bleeding for hours. That experience taught me to respect heavy red volume rather than fight it. I'm watching to see if this MA14 holds. If we break below it, I expect a quick move down to test the previous swing low at 215.21. I'm not chasing the current candle, but I am ready to act on a confirmed break. Entry: 217.50 – 218.00 Confirmation: 4H close below 217.00 Stop: 219.50 (above the MA7) TP1: 215.20 TP2: 213.50 Invalidation: Reclaiming 219.00 with volume If price bounces hard from here and reclaims 219, I'll stand aside and wait for the next setup. How are you playing this volume rejection? #ByXIMPACT $NVDAXUSDT
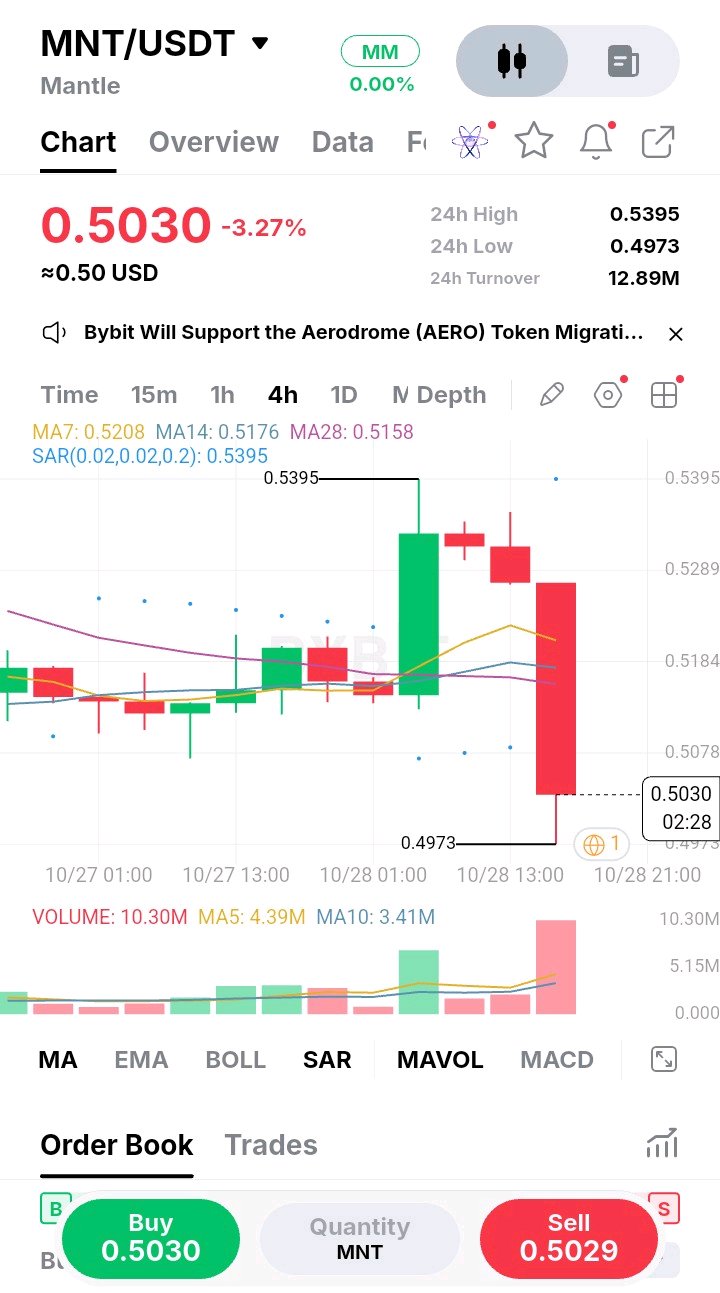
That massive red candle on the 4H chart is exactly the kind of price action that demands my attention before I even think about clicking buy. MNT just got absolutely hammered from the 0.5395 high, slicing straight through the MA7, MA14, and MA28 like they weren't even there. To make matters worse, it printed a huge volume spike on the way down, confirming that this isn't a gentle pullback; it's a violent rejection by sellers. Notice how price is now sitting at 0.5030, dangerously close to the 0.4973 swing low. The short-term structure has completely broken down, and the moving averages are starting to curl over. I've definitely been guilty of trying to catch these falling knives in the past, thinking a big red candle meant a guaranteed bounce was coming. That lesson cost me more than once, and it taught me to respect momentum. Price action like this usually needs time to exhaust itself and build a base before a real reversal can happen. Front-running that process is a losing game. I'm leaning short, but I want to see the previous low actually crack first. If we lose 0.4973 with conviction, the floodgates open for a deeper move. I won't chase this current candle; I want a confirmed breakdown. Entry: 0.5000 – 0.5030 Confirmation: 4H close below 0.4970 Stop: 0.5150 (above the MA cluster) TP1: 0.4850 TP2: 0.4750 TP3: 0.4620 Invalidation: Reclaiming 0.5180 with volume If buyers step in here and aggressively defend the low, I'll stand aside and wait for the next setup. How are you playing this breakdown? #ByXIMPACT $MNTUSDT
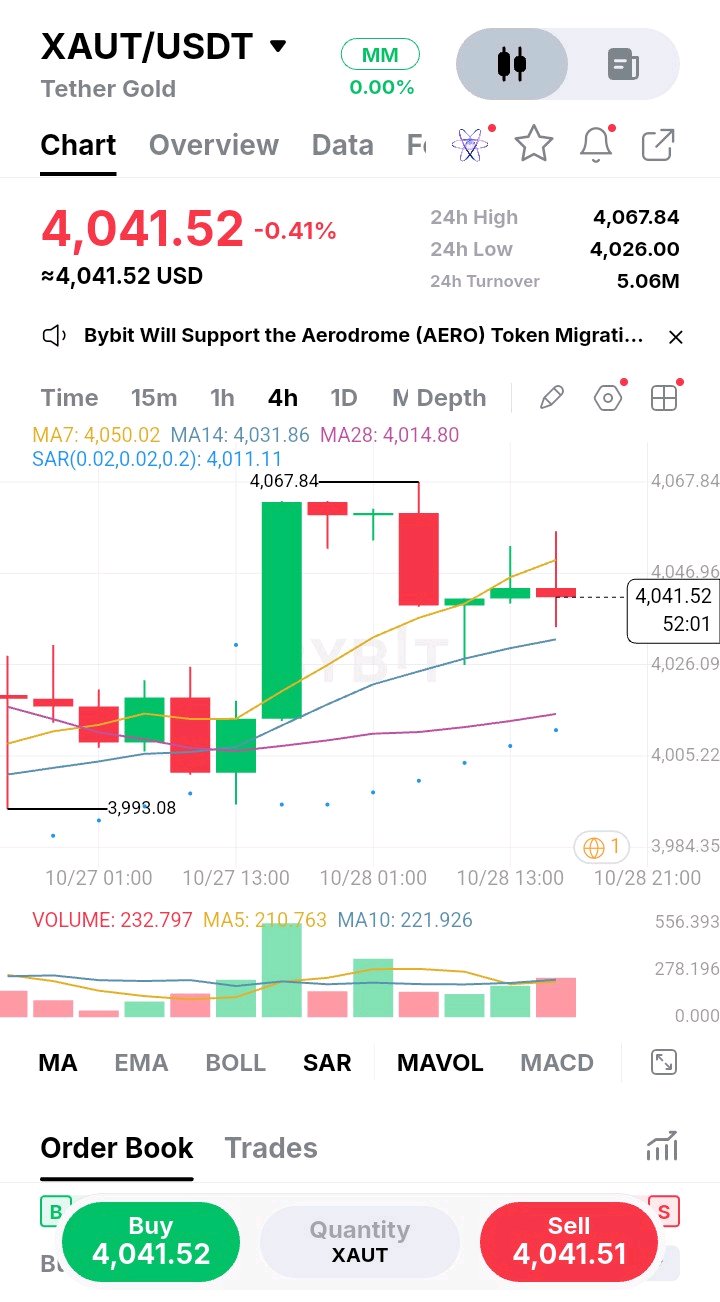
The way price is hugging the MA7 here on the 4H chart is what keeps drawing my eye, mostly because it looks so undecided. After that aggressive spike up to 4,067, buyers clearly ran out of steam, and we are now seeing a choppy, sideways bleed down to 4,041. It looks heavy, but it isn't a clean breakdown yet. The market is just drifting lower, testing the patience of anyone who bought the top. What’s important to note is that the broader structure is still technically holding. We haven't lost the MA14 around 4,031, and the major swing low down at 3,998 remains intact. This puts us right in a no-man's-land. I used to force trades in these tight, compressed ranges, trying to guess the next direction before the market made up its mind. I'd enter, get stopped out on a random wick, and then watch the price do exactly what I originally predicted. I've learned it's much better to wait for the market to pick a side and confirm it with a solid candle close. I'm treating this as a potential continuation long, but only if buyers actually defend the MA14. If we get a clean bounce off that 4,031 level with a strong 4H close, the setup becomes valid. If we just slice through it, the whole thesis changes. Entry: 4,030 – 4,035 Confirmation: 4H close above 4,045 Stop: 4,010 (below the MA28) TP1: 4,067 TP2: 4,090 TP3: 4,120 Invalidation: 4H close below 4,015 If we lose the 4,015 area, I'm out. There is no point in holding on and hoping. How are you playing this mid-range chop? #ByXIMPACT $XAUTUSDT
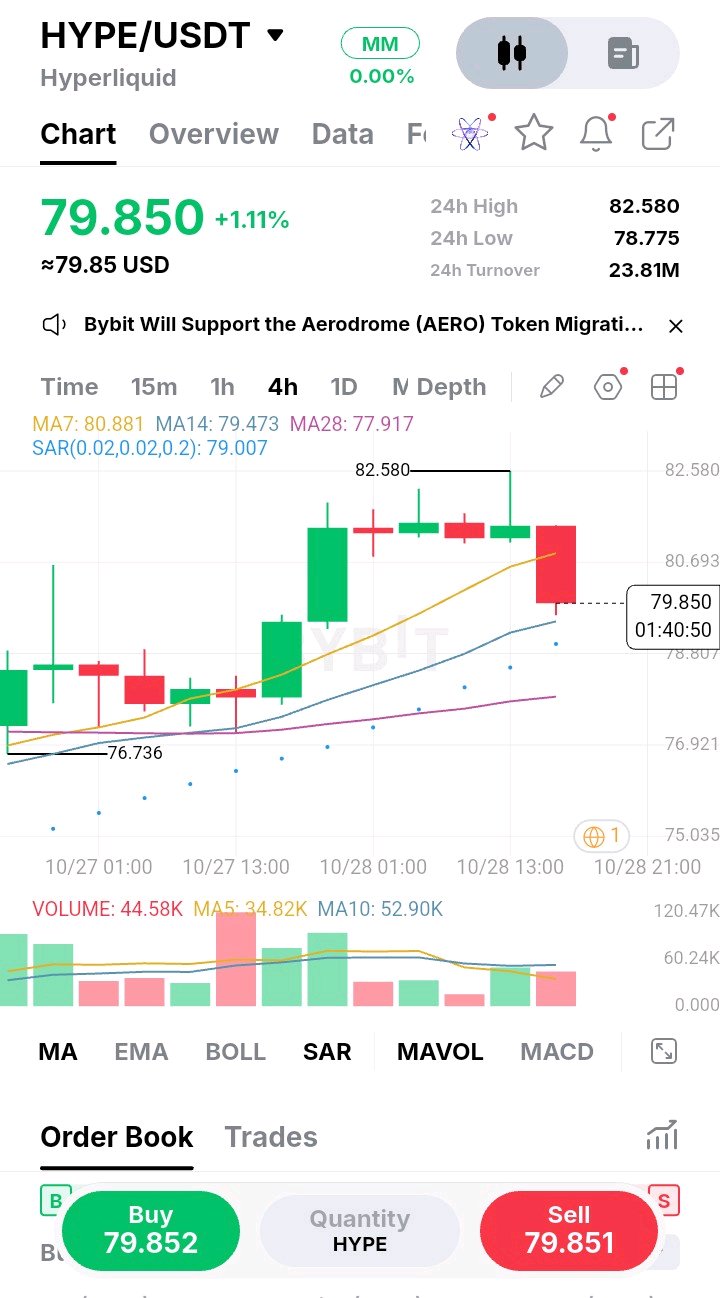
I keep looking at how price is behaving around this 80.88 MA7, and it feels like a classic momentum shift that’s easy to overlook if you aren't paying attention. The initial push up to 82.58 looked decent at first glance, but the follow-up was just a series of weak, indecisive candles grinding sideways. Now, we are finally seeing a heavy red 4H candle slicing right back into the moving average cluster, currently sitting at 79.85. What really stands out to me is that this rejection happened right at the top of the local range, and the buyers completely failed to defend it. There was no aggressive wick rejection or volume spike to save the day. I’ve definitely made the mistake of holding a long through a slow bleed like this, stubbornly thinking it was just a healthy pause, only to watch the price suddenly accelerate into a full-blown breakdown. That painful lesson taught me to respect the first hard push back through the MA7, especially when volume starts to dry up on the bounces. Right now, price is dropping toward the MA14 at 79.47. If we lose this immediate cluster, the path of least resistance is clearly lower. I expect a quick flush toward the next structural support levels as late longs get shaken out. I'm not front-running the break, but I am ready to act if the support cracks. Entry: 79.60 – 79.80 Confirmation: 4H close below 79.40 Stop: 80.90 (above the MA7 rejection) TP1: 78.80 TP2: 77.90 Invalidation: Reclaiming 80.80 with strong volume If price bounces cleanly from here and reclaims the 80.80 level, I’ll stand aside and wait for the next setup. How are you handling this breakdown? #ByXIMPACT $HYPEUSDT
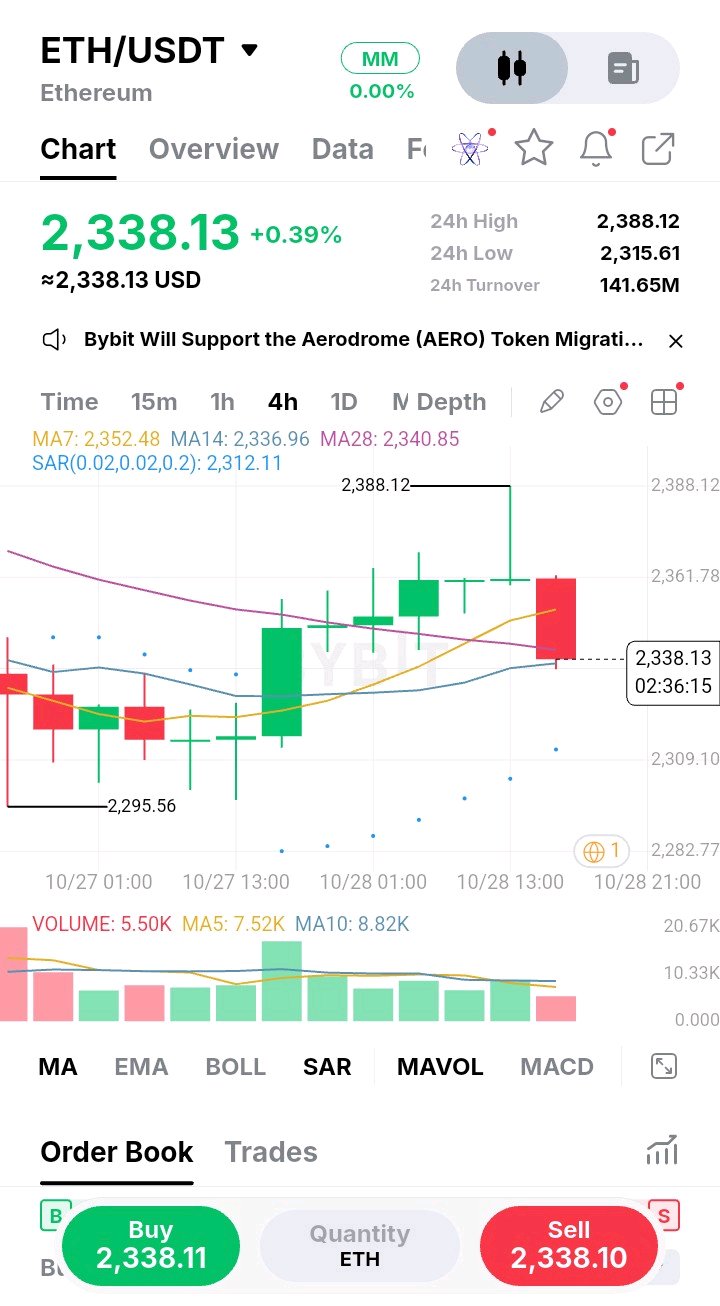
I'm noticing a classic liquidity trap forming here on the 4H chart, and it’s exactly the kind of price action that demands patience. Price just wicked all the way up to 2,388, sweeping the previous local highs, but it immediately reversed and printed a heavy red candle right back into the moving averages. That long upper wick tells me buyers tried aggressively to push higher, but sellers quickly stepped in and trapped them. It looks like a clear rejection of higher prices. I've definitely been on the wrong side of that kind of fakeout before. I used to see a quick spike and immediately market buy, thinking it was a breakout, only to watch the price aggressively dump back into the range and take out my stop. It's the exact reason I always wait for the 4H candle to actually close rather than just reacting to the live wick. Structure takes time to confirm. Right now, price is sitting at 2,338, squeezed tightly between the MA7 at 2,352 and the MA14 at 2,336. This cluster is the immediate battleground. If we lose this support zone on a closing basis, the path back down to the 2,315 area opens up quickly. I'm leaning short, but only on a confirmed break of this zone. Entry: 2,334 – 2,336 Confirmation: 4H close below 2,330 Stop: 2,350 (above the local MA resistance) TP1: 2,315 TP2: 2,295 Invalidation: Reclaiming 2,350 with strong volume If buyers manage to bounce and hold above the MA7, I'll stand aside and let the range play out. No need to force a short into strong support. How are you playing this rejection? #ByXIMPACT $ETHUSDT
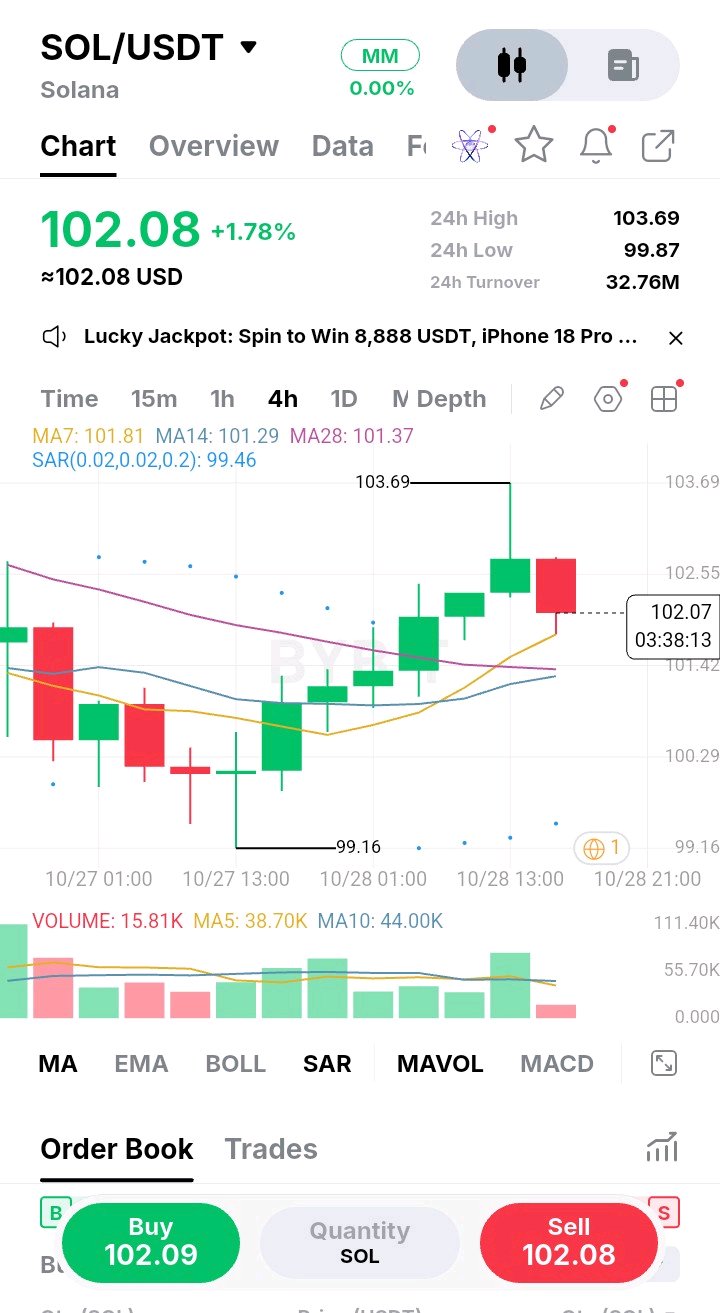
What I’m focusing on here is how SOL reacted after tagging that 103.69 high. It’s interesting because the push up looked strong, but the immediate follow-up is a heavy red 4H candle rejecting right off the top. That tells me sellers are actively defending that zone, and buyers are losing their immediate grip on the momentum. Notice how price is now dropping back into the MA cluster around 101.80–101.30. This is the real test. The structure of higher lows from the 99.16 sweep is technically still intact, but if we lose the MA7, I expect a deeper retracement to shake out the late longs. I’ve definitely been guilty of buying these pullbacks too early because I was afraid of missing the next leg up. I'd see a red candle touching a moving average and instantly market buy, only to watch the price continue to bleed lower. Waiting for the support to actually prove itself, rather than just assuming it will hold, has saved me from a lot of unnecessary drawdowns. I’m looking for a reaction here, but I won't front-run it. If we hold the 101.30 area and print a clear higher low on the lower timeframes, I’m interested. If not, the setup is invalid and I'll step aside. Entry: 101.30 – 101.60 Confirmation: 4H close back above 102.20 Stop: 100.20 (below the MA28) TP1: 103.60 TP2: 105.00 Invalidation: 4H close below 100.80 If price just rips back to 103 without giving this pullback, I'll wait for the next setup. How are you playing this rejection? #ByXIMPACT $SOLUSDT
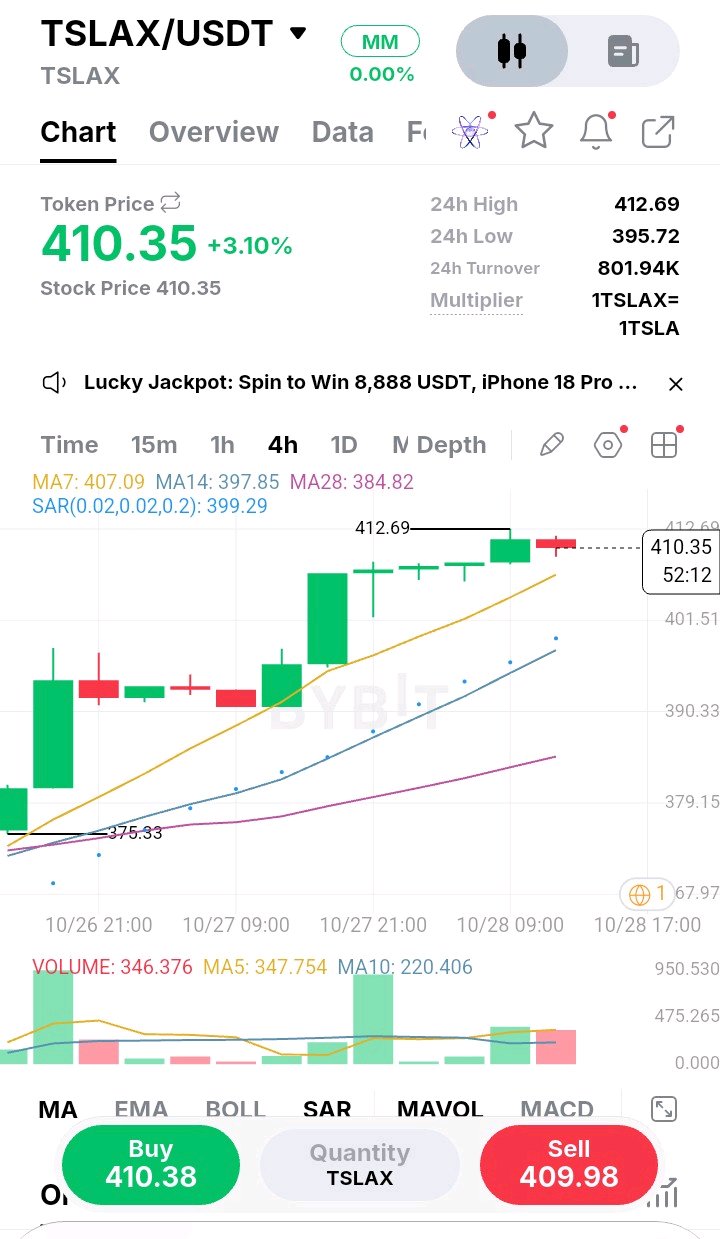
I've learned to be extremely careful when I see a massive green candle, and that’s exactly why I’m pausing on TSLX right now instead of hitting the buy button. The move from the 375 base up to 412 was aggressive and definitely caught a lot of attention, but the current price action on the 4H chart is telling a very different story. We just printed a sharp rejection wick right at the 412.69 high, and the latest candle is heavy, red, and struggling to hold its ground at 410.35. The moving averages are incredibly stretched here, with price sitting miles above the MA14 at 397.85. This huge gap tells me buyers are overextended and a mean reversion is highly likely. If you look at the volume bars, the buying pressure that fueled that massive initial push has completely dried up as we approach these highs. The follow-through simply isn't there. I’ve been trapped before buying into these exhausted vertical trends just before a sharp pullback, holding the bag while price bled back to the moving averages. I’m not repeating that mistake again. I’m not looking to short a strong trend blindly, but I definitely won't chase this parabolic move. I want to see a controlled pullback to test the MA7 around 407 to see if buyers actually show up. If they defend that level, a continuation long makes sense. Entry: 406.50 – 408.00 Confirmation: 4H close above 412.00 Stop: 398.50 (below the MA14) TP1: 415.00 TP2: 422.00 TP3: 430.00 Invalidation: 4H close below 397.00 If price just slices through 412 without a retest, I’ll sit on my hands and wait for the next setup. Where are you guys looking for a pullback entry? #ByXIMPACT $TSLAXUSDT
The clean structure in this chart is hard to ignore, but I’m also keeping a very close eye on the volume. We have a steady staircase of higher highs and higher lows since that 79,461 sweep, and price is currently pushing up to 81,470. The moving averages are fanning out nicely beneath us, and the SAR dots are trailing way down below, confirming the broader trend is undeniably bullish. It’s the kind of setup that makes you want to just market buy and hold on. But look closely at the volume bars. They are actually declining as price pushes into these new local highs near 81,822. That divergence tells me the momentum is thinning out as we approach resistance. I used to chase these aggressive green candles without ever checking the volume, and I'd consistently end up buying the exact top right before a sharp retrace. It’s a frustrating lesson to learn repeatedly, but watching volume has saved me from countless bad entries since then. I’m not chasing this current green candle into thin air. I'd much rather see a controlled pullback to test the MA7 around 80,842. If buyers defend that zone and print a clear higher low, the trend continuation setup is much cleaner and offers a far better risk-to-reward ratio. If price breaks down further, the MA14 near 80,468 is the next real line of defense. I want to see how the market reacts there before committing any capital. Entry: 80,850 – 81,000 Confirmation: 4H close back above 81,300 Stop: 80,450 (below the MA14) TP1: 81,822 TP2: 82,500 Invalidation: Losing 80,500 with volume If we just blast straight through 82k without a retest, I'll pass and wait for the next setup. Are you buying the breakout here or waiting for the dip? #ByXIMPACT $BTCUSDT

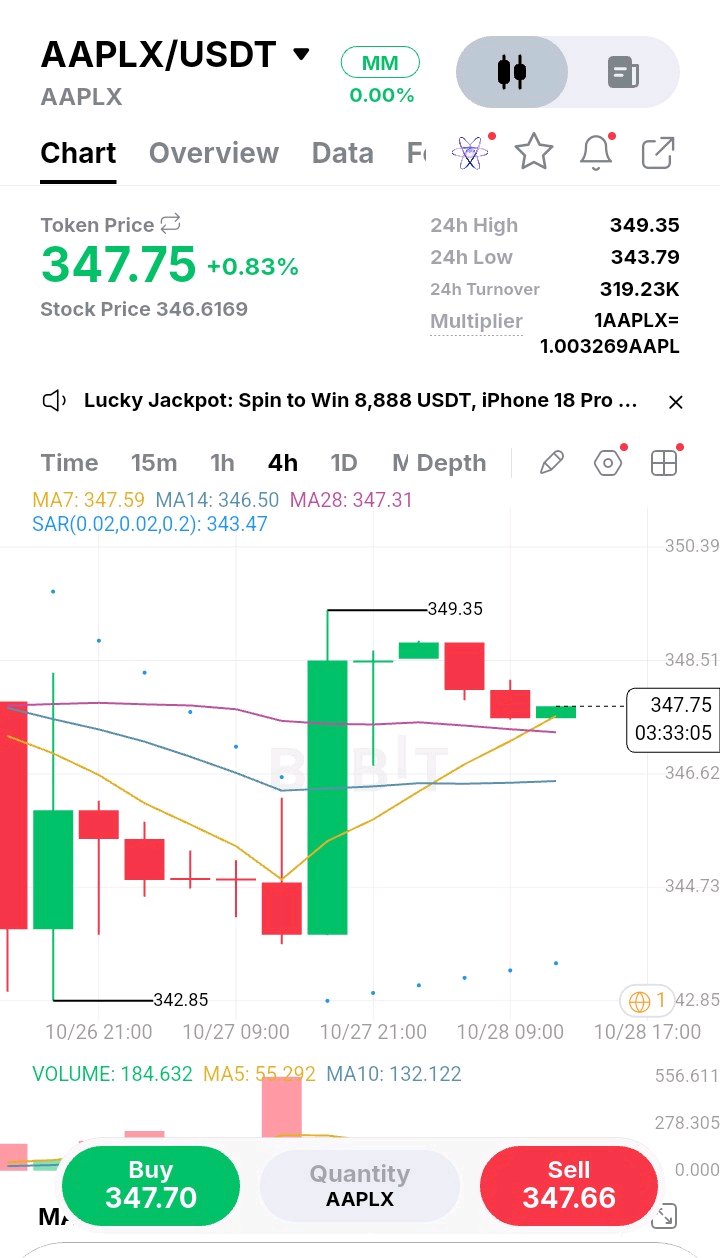
What stands out to me here is how violently AAPLX bounced off the 342.85 low, yet the follow-through at the top looks incredibly weak. That massive green candle looked like the start of a real breakout, but we immediately got stalled near the 349.35 mark. Now we are seeing consecutive red candles bleed right back into the moving average cluster. Notice how the volume on that initial push was huge, but it has completely dried up on the way down. It feels like buyers exhausted themselves too early and sellers are quietly taking the wheel back. The price is currently hovering around 347.75, resting right on the 4H MA7 and MA28, which are sitting practically on top of each other. This is a critical inflection point. If the buyers were truly in control, they would have defended this zone with aggressive volume already. Instead, we are just drifting sideways. I've made the mistake before of buying into these moving average crossovers while ignoring the fact that momentum had already peaked. I remember holding a long position through a similar structure, convincing myself it was just a healthy pullback, right up until the floor completely fell out. I'm not doing that again. Unless buyers step up aggressively right here at 347.50, the path of least resistance looks lower. The SAR indicator is already printing above the current price, confirming the short-term trend is shifting bearish. I am waiting for a confirmed break of this MA support before stepping in. If we lose this level, the gap down to the previous swing low opens up quickly. Entry: 347.20 – 347.50 Confirmation: 4H close below 346.50 Stop: 349.60 (above the local high) TP1: 344.80 TP2: 342.90 Invalidation: Reclaiming 348.50 with strong volume If price bounces hard from this MA line and reclaims the recent highs, I'll happily sit on my hands and wait for the next opportunity. There is no need to force a short into a choppy range if the market doesn't want to give it up. Are you guys seeing this as a healthy retest or a fakeout? #ByXIMPACT $AAPLXUSDT
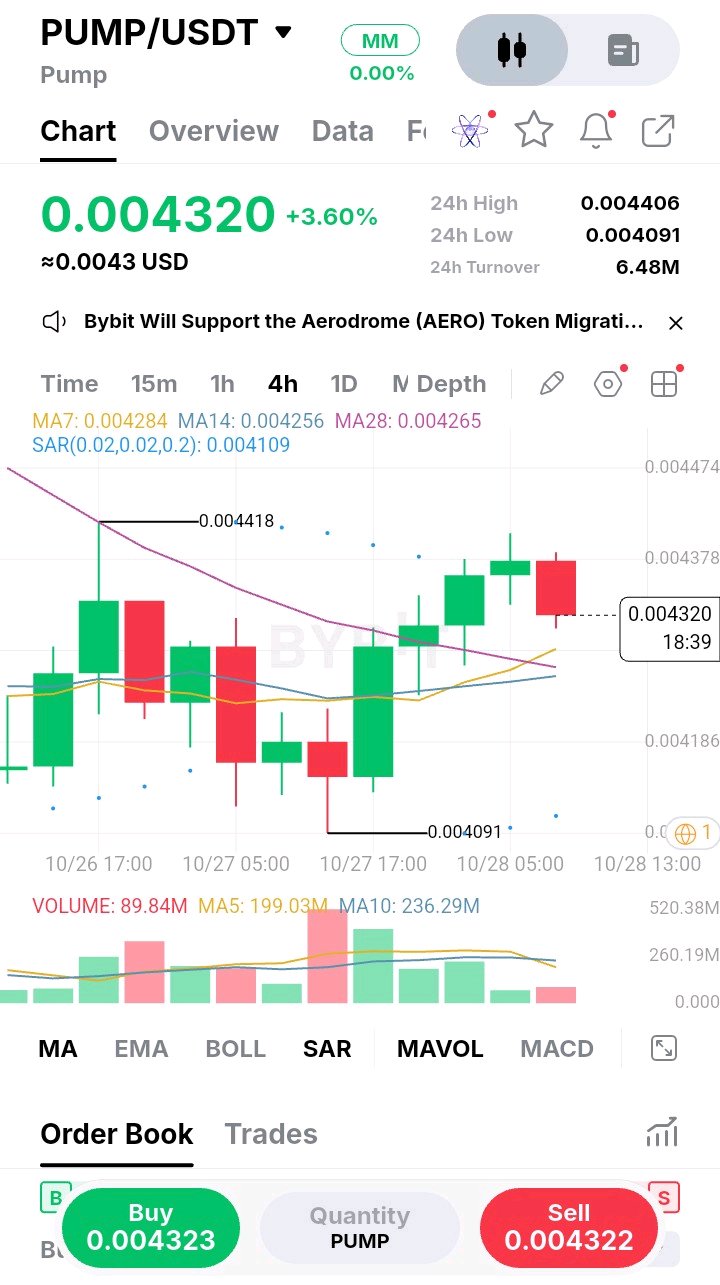
I've learned to be careful when a chart looks too perfectly set up, and that’s exactly what I’m seeing here on PUMP. We had a nice sweep down to the 0.004091 low, and the subsequent bounce looks relatively solid. We've reclaimed the short-term moving averages, and the 4H structure is trying to print higher lows. On the surface, it’s a textbook setup for a long continuation. But here is what bothers me: look at that recent rejection candle right at the 0.004418 high. Buyers pushed hard, but sellers immediately slammed it back down, and we are currently sitting at 0.00432. The volume on this latest leg up is also trailing off compared to the previous push. That tells me the momentum is fading as we approach local resistance. I’ve been burned before by blindly buying a moving average reclaim when the immediate prior high gets violently rejected. I used to see those MA crossovers and instantly market-buy, ignoring the fact that the market had just told me exactly where the sellers were waiting. Structure is improving, but the follow-through isn't there yet. Right now, I'm waiting for a minor pullback to test the MA cluster around 0.00425. If buyers step in there to form a clear higher low, I'll take the trade. I am definitely not chasing this current indecisive candle. Entry: 0.00425 – 0.00427 Confirmation: 4H close back above 0.00435 Stop: 0.00418 (below the local support) TP1: 0.00440 TP2: 0.00447 Invalidation: Losing 0.00420 with volume If it just blasts through 0.00445 without giving us that dip, I'll let it go and wait for the next chart. Are you guys waiting for the retest here, or just buying the momentum? #ByXIMPACT $PUMPUSDT
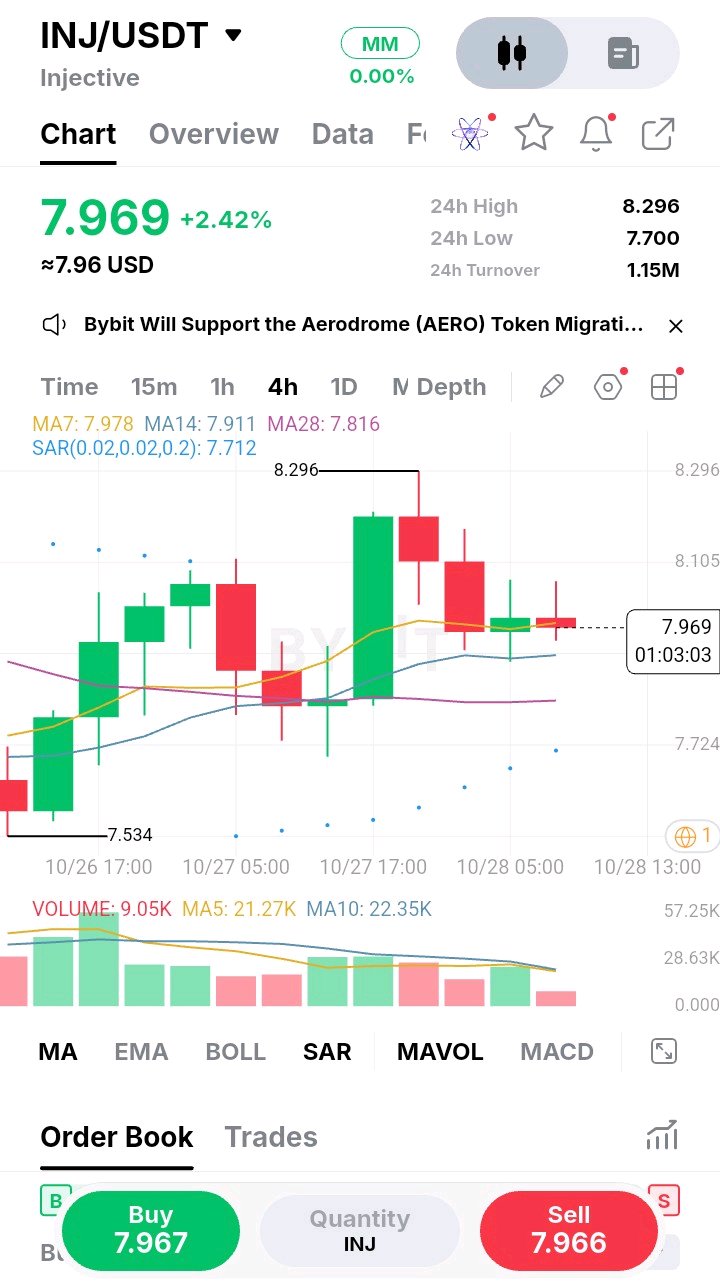
The part of this chart I keep coming back to is that massive green candle that spiked into 8.29. It looked incredibly bullish in the moment, but the follow-through just wasn't there. Instead, we got a slow, grinding bleed back down to the 7.96 area. That kind of price action usually tells me buyers overextended themselves and sellers quietly took control. Notice how volume has completely dried up on this pullback compared to that initial push. It feels heavy. Price is currently resting right on the 4H MA7 at 7.97, but the lower highs are starting to stack up. I'm leaning short here, but I want to see the support actually crack first. If we lose this MA cluster, the path down to the previous consolidation zone looks clear. I've been burned before shorting right into a moving average without confirmation, so I'm letting the market prove it's weak before stepping in. Entry: 7.94 – 7.96 Confirmation: 4H close below 7.90 Stop: 8.12 (above the recent lower high) TP1: 7.70 TP2: 7.53 Invalidation: Reclaiming 8.05 with volume I know it's tempting to catch a bounce right on the MA7, but this structure doesn't inspire confidence for longs. The momentum faded too quickly at the top. If price does bounce hard off this moving average line, I'll happily sit on my hands and wait for the next setup. There is no need to force a trade when the chart is this undecided. Are you guys treating this current dip as a buying opportunity or just a pause before more downside? #ByXIMPACT $INJUSDT
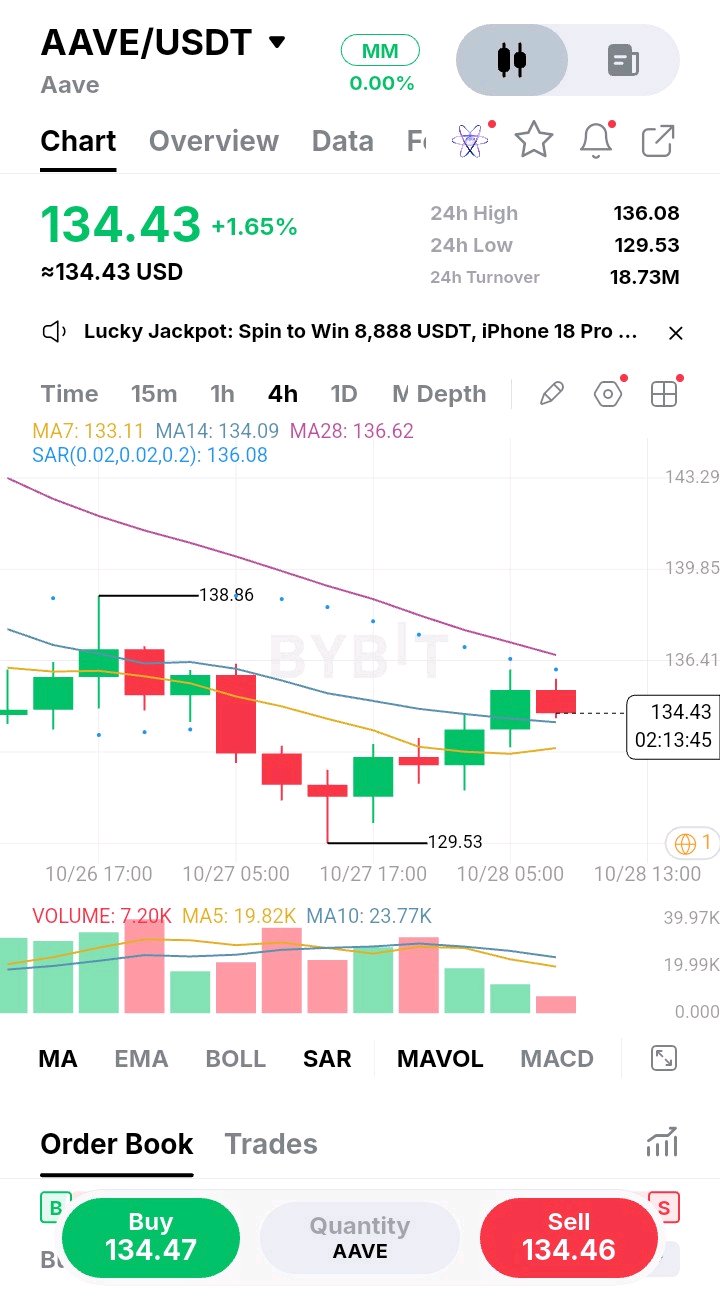
What caught my attention here was the way AAVE swept the 129.53 low and immediately rejected it, snapping back above 134 before most traders could even react. That kind of aggressive recovery tells me sellers ran out of steam at the bottom rather than the market actually breaking down. Price is now trying to reclaim the 4H moving averages, with the 134.09 MA14 acting as immediate dynamic support. The structure is still compressed, but the higher low around the sweep is a decent building block for buyers. Volume isn't exploding yet, so I'm not blindly chasing this green candle. I'd rather wait for a controlled pullback into 134–135 and see how price reacts. If buyers defend that zone, the setup is clean. The 136.08 SAR level is the real test, and a 4H close above it would confirm momentum. Entry: 134.50 – 135.20 Confirmation: 4H close above 136.10 Stop: 131.80 (below the sweep zone) TP1: 138.80 TP2: 142.00 TP3: 146.50 Invalidation: 4H close back below 133.50 If price runs straight through 136.50 without offering the pullback, I'm passing. I've learned the hard way that chasing a reclaimed resistance after a sweep usually ends with a bad fill. Sellers are still lingering near 136, so patience here matters more than speed. Where are you watching for the reclaim? #ByXIMPACT $AAVEUSDT
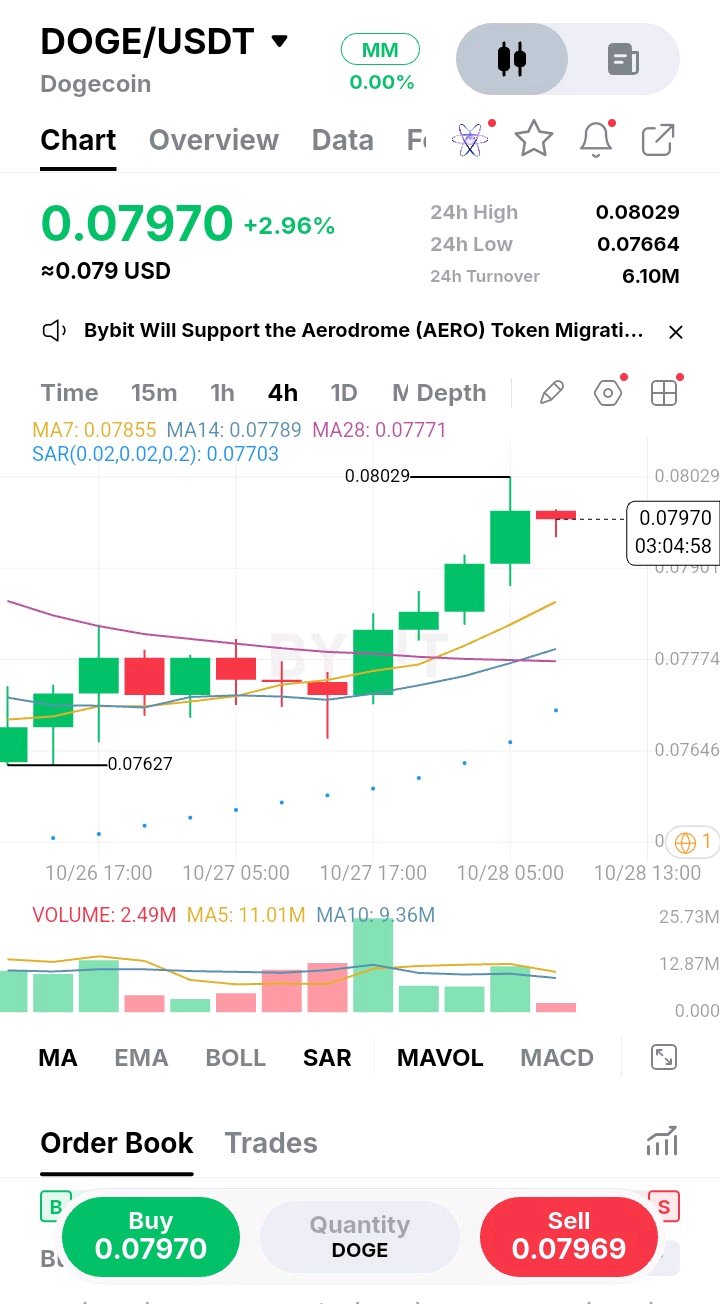
What caught my attention here wasn’t the big green candles—it was the hesitation on the most recent one. DOGE has climbed from the 0.0767 swing low, printing a clean series of higher lows and higher highs on this 4H chart, but the current candle is already telling a different story. Price tagged 0.0802, the 24h high, and immediately stalled. We’re sitting at 0.0797 with a weak body and an upper wick forming. That’s not a breakout—that’s a pause, and pauses near local highs often precede a retrace. The structure itself is still bullish. The MA7 (0.07855), MA14 (0.07789), and MA28 (0.07771) are all stacked and curling upward, which confirms the trend is intact. But the volume profile is the part I keep coming back to. The volume spike that pushed price from the base was strong, yet the follow-through on the current candle is shrinking. That divergence between price and participation is a classic warning sign. When buyers stop showing up at the highs, sellers usually test the lows. I’ve learned this lesson the hard way. A few years back, I chased a breakout exactly like this—bought the top of a green candle because I was afraid of missing the move, and watched price retrace 3% before I could blink. The breakout wasn’t fake; I was just early. The market needed to digest the move before continuing. That’s the difference between a good setup and a good entry. The setup here is still long, but the entry is not at 0.0797. What I want to see is a pullback into the 0.0777–0.0785 zone. That area is where the moving averages converge, where the prior consolidation sits, and where the SAR dot (0.07703) provides a secondary layer of support. A retest and hold there gives us a real invalidation point—not an arbitrary stop, but a level where the bullish thesis actually breaks if lost. Trade Plan: · Entry: 0.0780–0.0785 on a retest and hold · Stop: 0.0765 (below the swing low and 24h low of 0.07664) · TP1: 0.0802 (recent high) · TP2: 0.0820 (next resistance zone) · TP3: 0.0845 (extension target) · Invalidation: A 4H close below 0.0765 kills the bullish structure If price breaks 0.0802 without giving a retest, I won’t chase. Let it come back or leave it. The edge is in the pullback, not the breakout candle. That’s the discipline that keeps me in the game—waiting for the market to come to my level instead of forcing an entry at a level I don’t control. #ByXIMPACT $DOGEUSDT
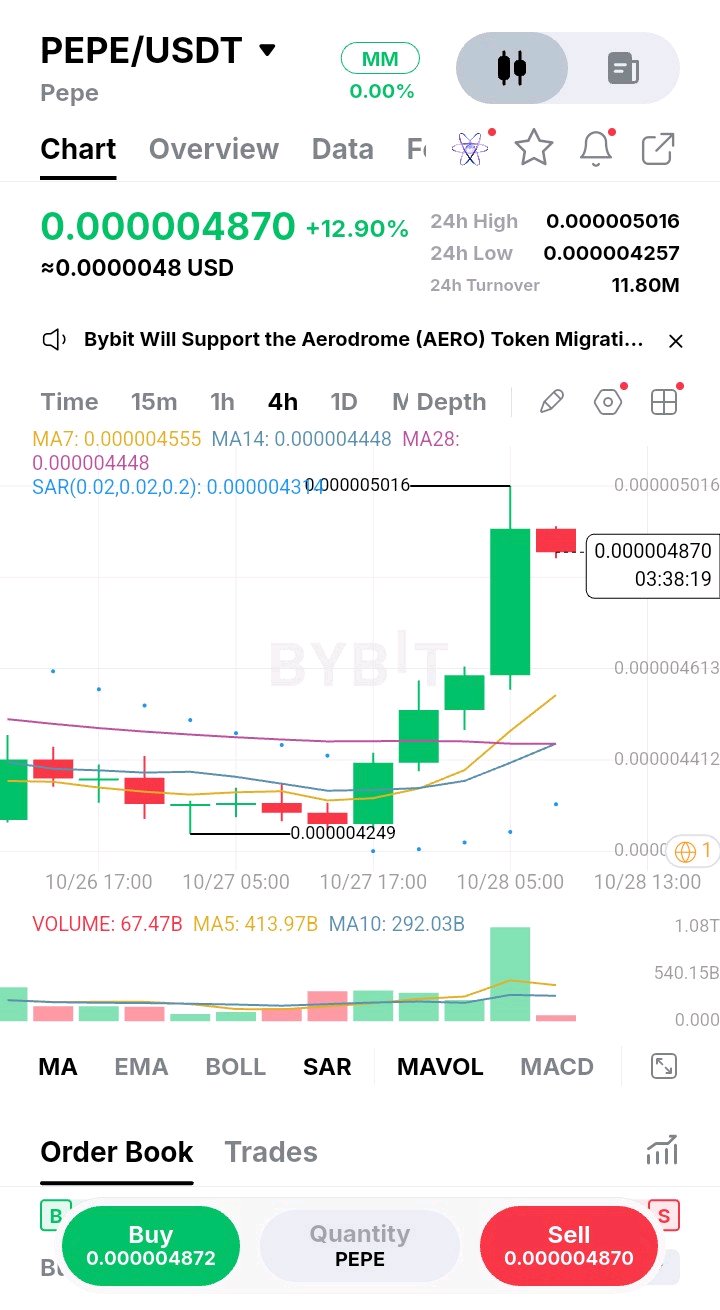
I’ve learned to be careful when a chart goes vertical like this, but the way PEPE just sliced through its moving averages is hard to ignore. We are sitting at 0.000004870, up almost 13% on the day, and that single massive green candle tells me buyers are firmly in control. When a move is this aggressive, my first instinct is usually to step back—vertical charts have a habit of trapping late chasers. The 4H structure has completely shifted, though. Price is now trading well above the MA7 at 0.000004555 and the MA14 at 0.000004448, meaning the short-term trend has flipped bullish. The volume expansion on this breakout is what stands out most—it’s not a quiet drift, it’s genuine participation. That kind of volume usually signals real intent rather than a random spike. However, the next candle is already printing red, and price is sitting just below the 24h high of 0.000005016. This is exactly where late longs could get trapped if the volume starts to fade. I’ve been on the wrong side of that setup before, buying the top of a green candle only to watch it retrace instantly. I’d rather buy the retest than chase this vertical move. If price pulls back to the MA7 and holds, that’s a much safer entry with a tight stop. Entry: limit buy near 0.000004600, confirmed by a 1H bullish rejection candle. Stop: 0.000004350 — below the moving average cluster. TP1: 0.000004900 TP2: 0.000005100 TP3: 0.000005400 Invalidation: a 4H close below 0.000004350 breaks the breakout structure. If price rips through 0.000005000 without a retest, I’ll let it go. No chasing. Are you buying the breakout or waiting for the pullback? #ByXIMPACT $PEPEUSDT
The part of this chart I keep coming back to is how steep this run looks without any real pullback. We are sitting at 1.3407, right under the local high of 1.3442, and the 4H candles are just stacking green. The MA7 at 1.3176 is trailing far below price, which tells me the move is clearly extended. When price gets this far away from its dynamic support, late longs usually end up providing the liquidity for a quick flush. The market rarely rewards people who chase vertical moves. I’ve definitely chased candles like these before, thinking momentum would just keep going, only to get stopped out on the first wick down. That experience taught me to respect the distance between price and the moving averages. The MA14 sits at 1.3050 and the MA28 is all the way down at 1.3004, which shows just how much air is beneath us. If sellers decide to take control, there is a lot of room to fall before buyers find their footing. Volume is another thing catching my eye. The latest green candles are strong, but they aren’t showing the same explosive expansion as the initial breakout. That is often a subtle warning that the buying pressure is starting to thin out. I’d much rather wait for a controlled pullback than try to jump in right at the highs. Entry: limit buy on a pullback into 1.3180–1.3200, confirmed by a 1H bullish rejection candle. Stop: 1.3000 — just below the MA28 and the recent consolidation shelf. TP1: 1.3440 TP2: 1.3650 TP3: 1.3900 Invalidation: a 4H close below 1.3000 breaks the short-term structure. This is a wait-for-the-dip setup. If price just keeps ripping through 1.3440, I’ll skip it. No chasing, no FOMO. Do you wait for the retest here, or chase the momentum? #ByXIMPACT $XRPUSDT

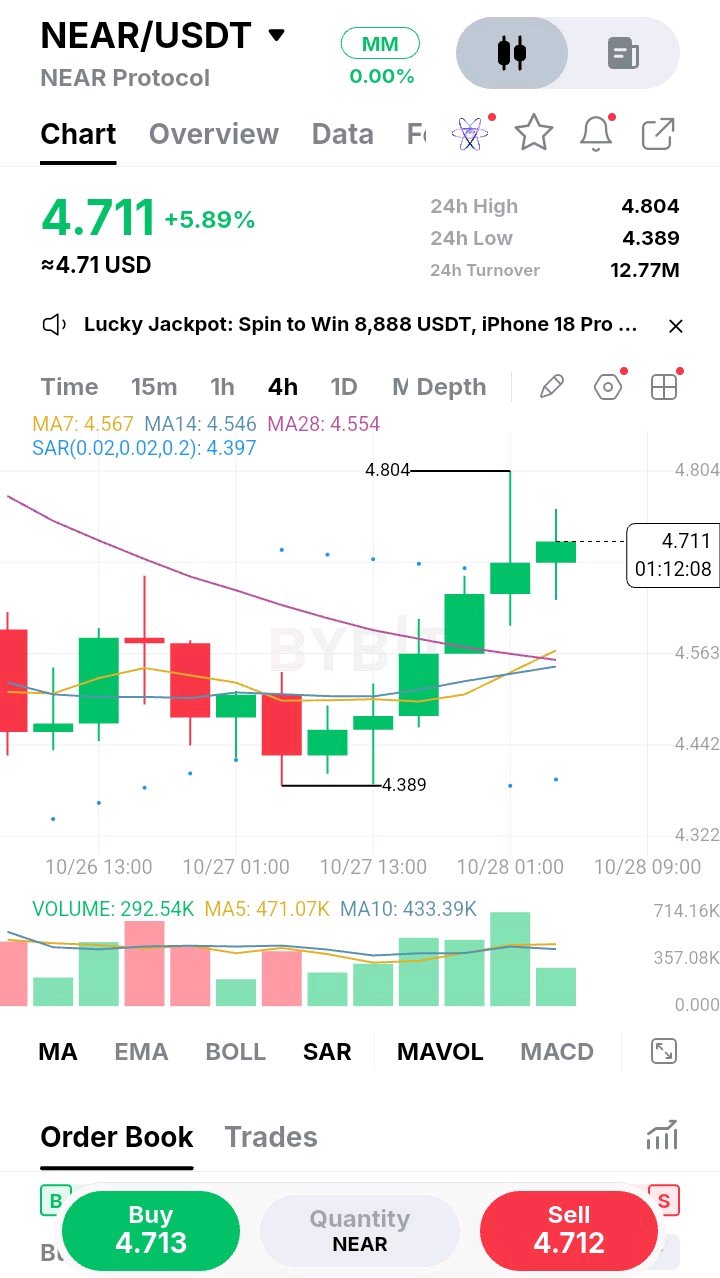
I wasn’t interested in this setup at first because the move already looked stretched, but the way price is holding near the highs tells me buyers aren’t done yet. We are sitting at 4.711, right below the local high of 4.804, and the 4H structure is clearly bullish with higher highs and higher lows. When a market refuses to pull back after a strong impulse, it usually means there is real demand absorbing the selling pressure. What stands out is the moving average alignment. The MA7 at 4.567 and MA14 at 4.546 are stacked below price, acting as dynamic support. Every dip is being bought up quickly, which is a sign of genuine demand rather than a random bounce. The MA28 is also catching up around 4.554, giving us a tight structural zone underneath. However, the volume on this latest push is noticeably lighter than the previous breakout candle. I’ve been burned before buying right into resistance on fading volume, so I’m cautious about chasing green candles here. I’d rather let the market come to me and see if this support actually holds under pressure. Entry: limit buy on a pullback to 4.620, confirmed by a 1H bullish rejection candle. Stop: 4.500 — below the MA14 and recent swing support. TP1: 4.800 TP2: 4.950 TP3: 5.100 Invalidation: a 4H close below 4.480 breaks the current uptrend structure. If price blasts through 4.800 without a retest, I’ll let it go. Chasing extended moves is how you get trapped at the top. Are you waiting for a dip, or taking the breakout here? #ByXIMPACT $NEARUSDT
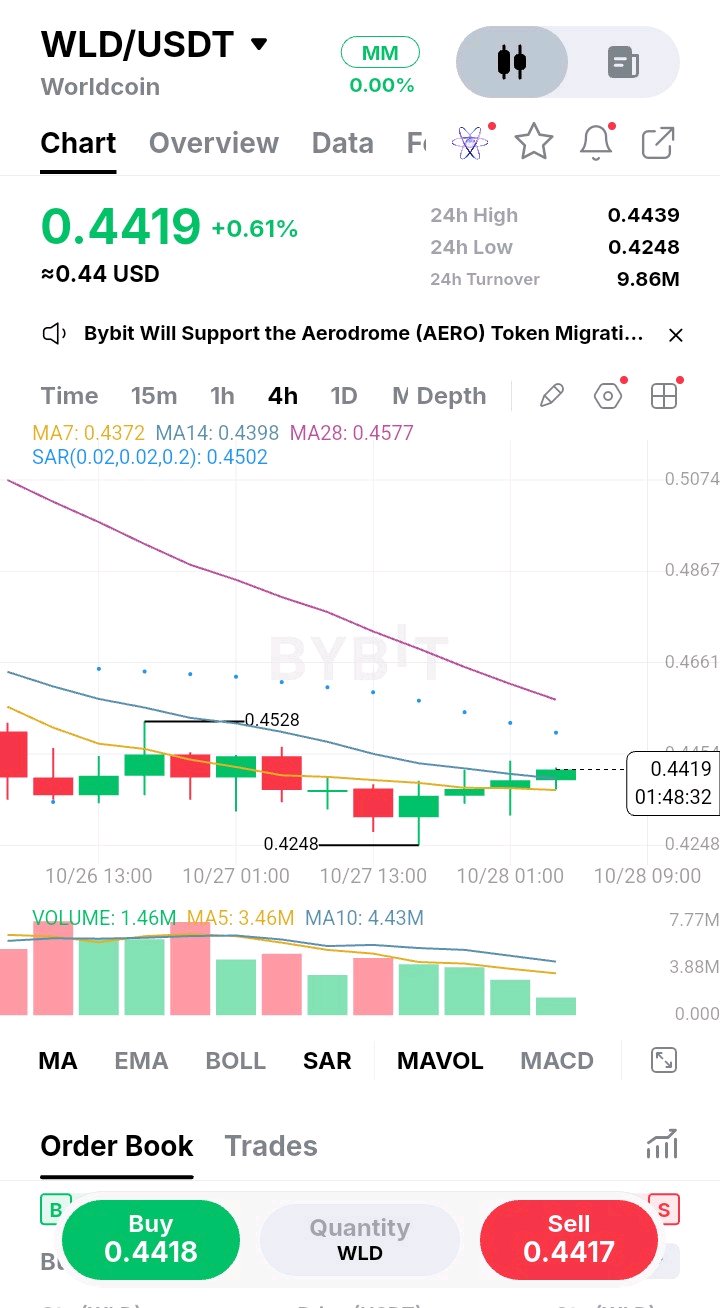
I usually avoid charts that look this quiet, but the way Worldcoin is compressing right below its moving averages has my attention. We are sitting at 0.4419, just drifting sideways while the MA7 and MA14 flatten out around 0.437–0.440. The real ceiling, however, is the MA28 up at 0.4577. Price hasn’t touched that level in days, which tells me the broader bearish structure is still very much in control. What matters here is the absolute lack of momentum. Sellers pushed down to 0.4248 and found buyers waiting, but the bounce we are seeing isn’t aggressive. The volume is visibly drying up, which means neither side is willing to commit. I’ve been burned buying this kind of low-volume drift before—it often resolves with a quick sweep of the lows to grab liquidity before any real move happens. I’d much rather wait for price to prove itself than guess and get chopped up. Entry: only on a 4H close above 0.4528, with volume expanding. Stop: 0.4380 — just below the current consolidation base. TP1: 0.4620 TP2: 0.4720 TP3: 0.4850 Invalidation: a 4H close below 0.4380 or a rejection at 0.4528 with weak volume. If price just chops here without breaking either level, I’ll stay out. No trade is better than a forced trade. Are you waiting for the breakout or expecting a sweep lower? #ByXIMPACT $WLDUSDT
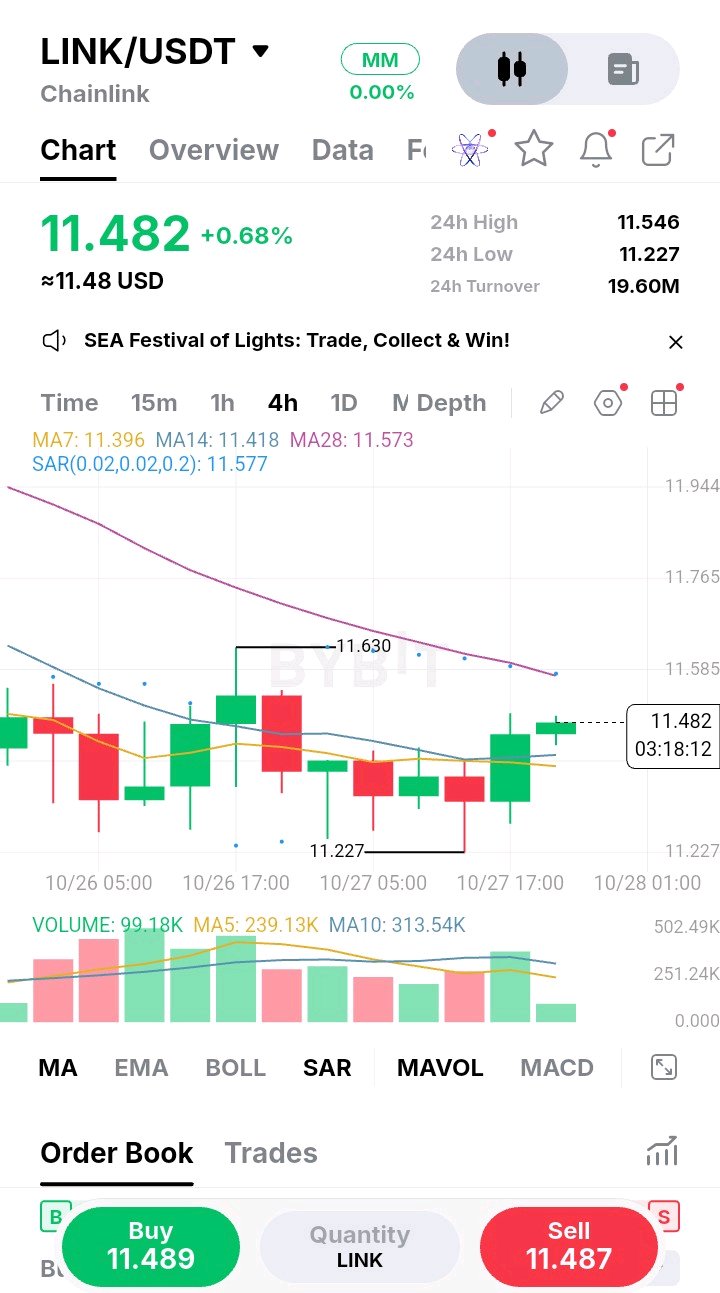
I’ve learned to be careful when price starts grinding sideways after a sharp drop. That is exactly what is happening here on Chainlink. We are sitting at 11.482, trying to find some footing, but the overall 4H structure still looks heavy. The bounce we are seeing right now doesn’t have the aggressive, high-volume energy of a true reversal. Instead, it feels like a pause—a moment where the market is catching its breath before the next move. What stands out is the moving average cluster. The MA7 is at 11.396, the MA14 at 11.418, and the MA28 up at 11.573. Price is currently squeezed right into this pocket. It hasn't reclaimed the MA28, meaning buyers are still fighting an uphill battle. In my experience, when price gets pinched between these moving averages after a downtrend, it usually resolves in the direction of the broader trend. Until that MA28 is broken, the sellers still have the structural advantage. The volume is also trailing off significantly, which tells me neither side is overly aggressive right now. The previous selling volume was much higher, and this low-volume drift upward is suspicious. I’ve definitely made the mistake of buying a slow bounce like this, mistaking consolidation for a reversal, only to watch it get rejected and stop me out. So, I’m going to wait for actual confirmation before acting. I’d rather miss the first few dollars of a move than get trapped in a fakeout. Entry: long only on a 4H close above 11.580. Stop: 11.350 — below the MA7 and recent wick. TP1: 11.730 TP2: 12.000 TP3: 12.250 Invalidation: rejection at the MA28 or a clean 4H close below 11.350. If we get a clean push and close above 11.580, the structure shifts and I’ll look for continuation. If we reject here, the downside remains open, and I’ll stay patient. This is a wait-and-see setup. Are you expecting a breakout, or a rollover? #ByXIMPACT $LINKUSDT
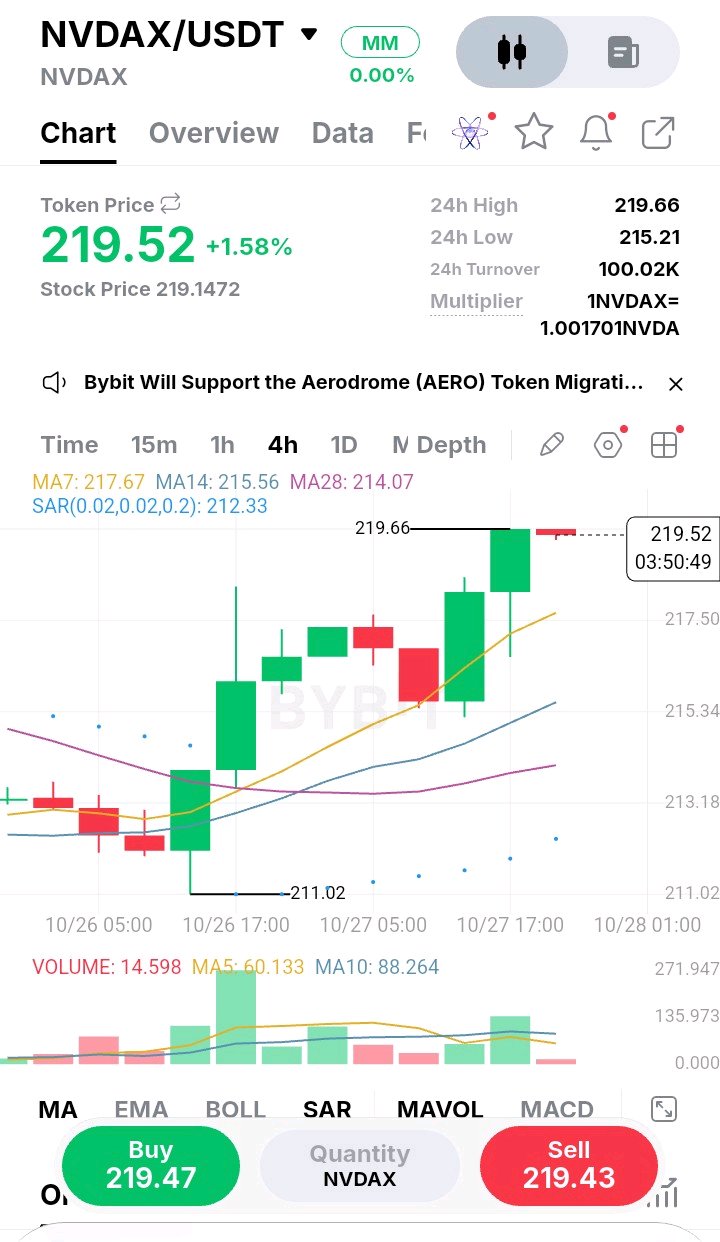
I wasn’t interested in this setup at first because the move already looked extended, but the way price is stubbornly holding near the highs tells me something else is going on. We are sitting at 219.52, right below the local high of 219.66, and the buyers simply aren’t backing off. The 4H structure is clearly bullish, printing higher highs and higher lows. What catches my eye is the moving average alignment—the MA7 at 217.67 is acting as a tight dynamic floor. Every time price dips, buyers scoop it up before it even tests the MA14 at 215.56. That kind of aggressive dip-buying is a sign of genuine demand, not just a random bounce. However, the volume on this latest push is noticeably lighter than the previous breakout candle. I’ve been burned before buying right into resistance on fading volume, so I’m cautious about chasing green candles here. I’d rather let the market come to me and see if this support actually holds under pressure. Entry: limit buy on a pullback to 217.50, confirmed by a 1H bullish rejection candle. Stop: 215.00 — safely below the MA14. TP1: 221.00 TP2: 225.00 TP3: 230.00 Invalidation: a 4H close below 214.50 breaks the current uptrend structure. If price just blasts through 220 without giving a retest, I’ll let it go. Chasing extended moves is how you get trapped at the top. Are you waiting for a dip, or taking the breakout? #ByXIMPACT $NVDAXUSDT
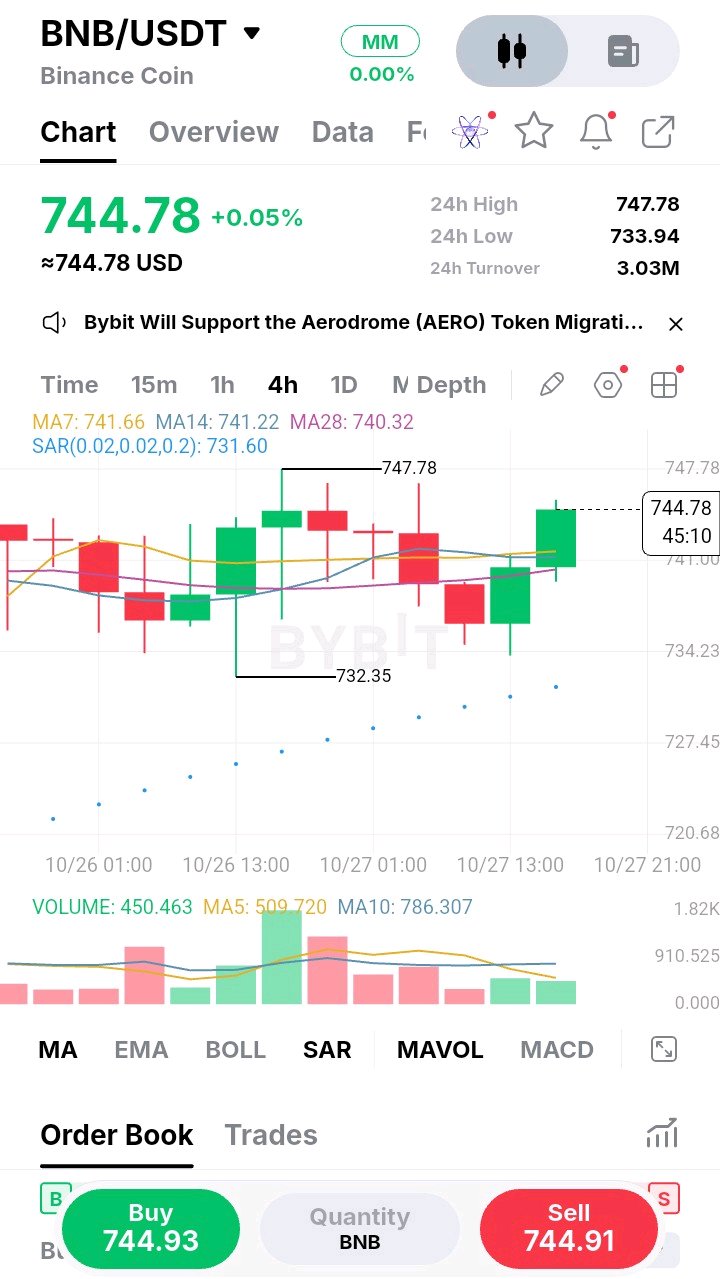
I’ve learned to be careful when price grinds slowly toward a previous high without any real volume behind it. That is exactly what I am seeing here on BNB. We are sitting at 744.78, creeping up toward the 747.78 local resistance, but the volume bars are visibly shrinking. That divergence between price action and participation always makes me pause. The 4H structure shows buyers are still holding the line—the MA7 and MA14 are acting as solid dynamic support around 741–742. However, this low-volume push into resistance is a classic trap. Sellers are likely waiting at 747.78 to defend the high, and late longs could easily get shaken out if we see a sudden rejection. I’ve been on the wrong side of that exact scenario before, buying the top of a lazy uptrend right before a sweep. I would much rather buy the pullback than chase this slow grind. If price dips back into the moving average cluster, that is where the risk-to-reward makes sense. Entry: limit buy near 742.00, confirmed by a 1H bullish rejection wick. Stop: 737.50 — below the MA14 and recent consolidation. TP1: 747.50 TP2: 755.00 TP3: 762.00 Invalidation: a clean 4H close below 738.00 flips the short-term momentum bearish. This is a patience game. If price breaks out above 748 without a retest, I will just watch. Chasing a low-volume breakout is how you end up holding the bag. Are you buying this grind, or waiting for the dip? #ByXIMPACT $BNBUSDT