The Fed meeting may be over, but the research doesn't stop at the closing bell. Did the market reaction teach you something about rate expectations, cross-asset correlations, liquidity or your own trade process? Try to explain one lesson with a concrete observation. A strong community grows when people share not just their predictions, but how they update them after new evidence arrives. What's your takeaway? #FOMCRateDecision

What caught my attention about XRP is that the XRP Ledger is attracting more value, but that does not automatically mean more people are using it. That distinction matters more than another bullish headline. CoinDesk reported that XRP Ledger order-book trading volume increased 79% year over year in Q2 2026, while the number of accounts initiating trades fell approximately 41%. Meanwhile, average tokenized-asset and RLUSD balances reached roughly $4.26 billion, compared with just $99 million six quarters earlier. Much of that growth came from Ripple’s dollar-backed RLUSD stablecoin. CoinDesk +1 The interesting part is how these developments connect. XRPL is building activity around tokenized assets, stablecoins and on-ledger trading, while XRP itself remains essential for transaction fees and account reserves. However, those functions do not guarantee that ecosystem growth will translate into proportional demand for XRP. xrpl.org +1 Supply also deserves attention. Ripple reported holding approximately 37.66 billion XRP, including 32.6 billion in escrow, as of June 30, 2026. Escrow releases and subsequent movements matter, but released tokens should not automatically be treated as immediate selling pressure. Ripple The regulatory picture has also changed: the SEC and Ripple ended their appeals in August 2025, while the existing judgment and injunction remained in effect. That removes one major chapter of uncertainty, not every market risk. Reuters For traders, I would watch whether rising on-ledger value is accompanied by stronger participation, sustained XRP spot volume and improving price structure. If activity keeps concentrating among fewer accounts, the growth story deserves closer scrutiny. The real question is whether expanding XRPL utility eventually creates measurable, sustained demand for XRP itself. $XRPUSDT #ByXIMPACT


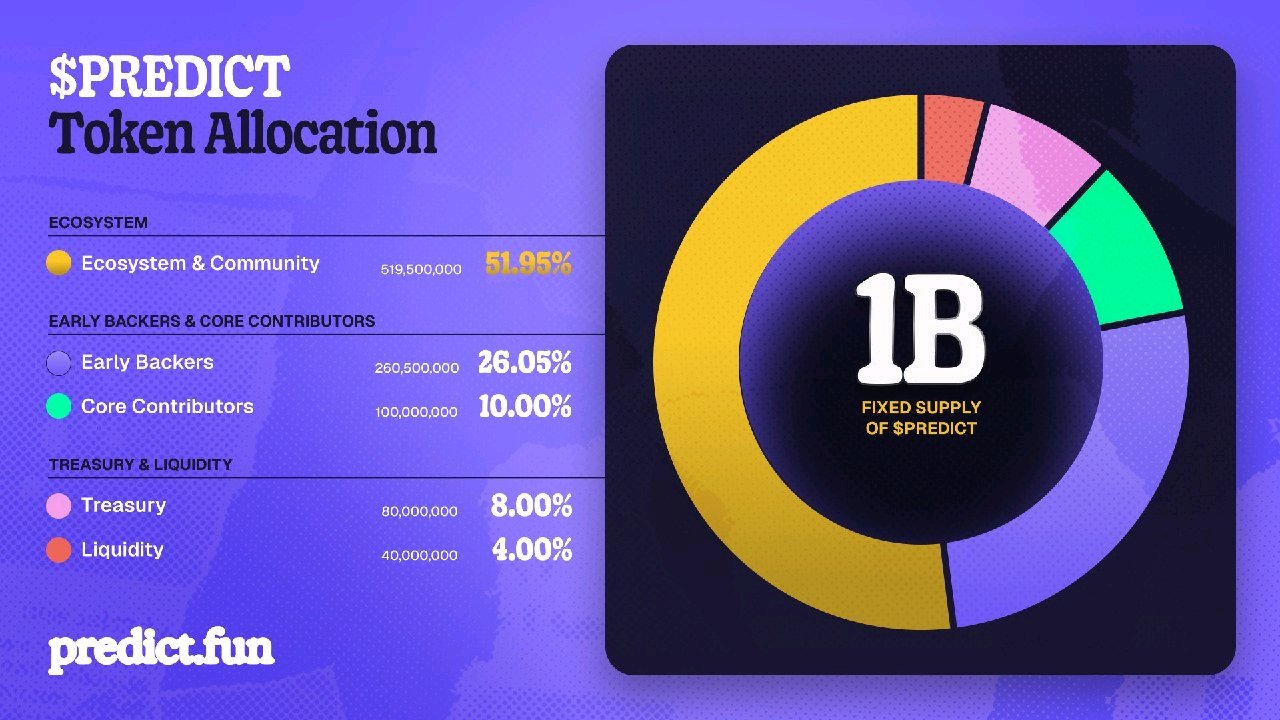
PREDICT TGE Analysis: High FDV, Aggressive Airdrop Mechanics, and the Binance IDO Gamble As a crypto trader, you already know the game: a hot prediction market project, a massive FDV, and the classic "take the money and run" airdrop dilemma. Here’s the breakdown of what’s actually happening with $PREDICT and how to position yourself. Tokenomics: Supply Overhang and the TGE Unlock The headline is the 1B fixed supply, but the devil is in the details. · Ecosystem & Community (51.95%): This is the largest chunk, but 70M (7%) is earmarked for the Season 1 airdrop. The rest is subject to long-term emission schedules. · Early Backers & Core Contributors (36.05%): This is the most critical data point. These allocations are fully locked at TGE with a 24-month cliff followed by a 36-month vesting schedule . This means no VC or team selling pressure on day one, which is a massive positive for the initial price action. · Circulating Supply at TGE: 16% of the total supply (160M tokens) will be in circulation. This is relatively high, but given the lockups, the actual float might be manageable if market makers absorb the airdrop sells. The Airdrop: The "Greedy vs. Patient" Dilemma The 70M token airdrop (7% of supply) comes with a predatory mechanic that you need to game: · Option A (Instant Gratification): Claim 35% immediately. The remaining 65% is burned/forfeited forever . This is designed to create sell pressure on day one. · Option B (The Long Game): 100% of the allocation via 12-month vesting. You have a one-month window post-TGE to change your mind and downgrade to Option A . · Trader Strategy: If you are farming the airdrop, Option B is mathematically superior unless you desperately need liquidity. The 35% instant claim essentially values your allocation at a ~65% penalty. Even if you plan to sell, vesting allows you to sell into potential pumps over the year rather than capitulating to the initial TGE dump. The Binance IDO and FDV Reality Check Tomorrow’s Binance Wallet IDO is the immediate catalyst. While the exact Alpha Points requirement is unclear, the pre-market data is screaming overvaluation: · Pre-Market FDV: It is currently trading around $1.4B to $1.64B FDV, with a recent pump touching $2B . · The Risk: A $1.4B FDV for a project with minimal initial float is a massive ask. As a trader, you must calculate the Point Value. If the FDV holds at $1.4B, the implied price is $1.40 per token. However, airdrop farmers who took Option A will likely dump their 35% immediately. This creates a scenario where the actual spot listing could see significant downside volatility unless there is aggressive market-making. · The Verdict: The FDV is currently driven by hype and perp pre-market mechanics, not actual user adoption. Do not chase the pre-market price. If you are participating in the Binance IDO, treat it as a short-term flip. If the FDV opens above $1.5B, the risk/reward for holding is poor. Summary $PREDICT has a clean TGE float (no VC dumps), but the 16% unlock and the airdrop's "burn 65%" mechanic are designed to test your conviction. The $1.4B+ FDV is rich. If you get an IDO allocation, consider taking profits on the initial listing volatility rather than holding for a "1B supply" long-term play. #PREDICT #BinanceIDO #Tokenomics #TGE #CryptoTrader

🚨 $BTC: ONLY 21 MILLION WILL EVER EXIST
Coinbase’s CEO highlights $BTCUSDT biggest advantage: scarcity. Gold and diamonds can still be mined. Bitcoin has a hard cap of 21 million coins.$ETHUSDT No one can change that fixed supply. 🔥 #IMPACTbyTrade



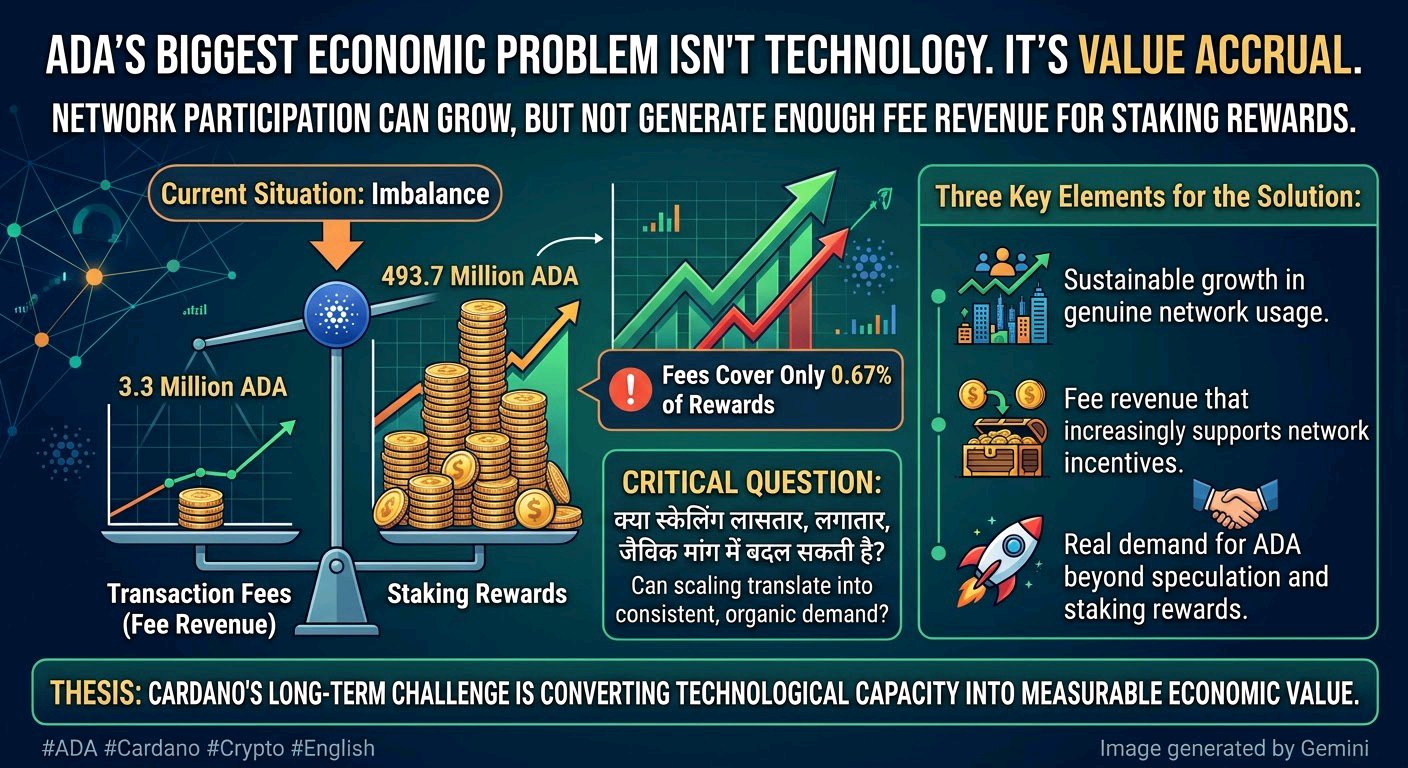
$ADAUSDT Biggest Economic Problem Isn’t Technology. It’s Value Accrual. Cardano has a clear economic contradiction: network participation can grow without generating enough fee revenue to support its reward economy. A September 2026 analysis reported 3.3 million ADA in transaction fees against 493.7 million ADA in staking rewards across 73 epochs. Fees covered just 0.67% of rewards. That gap raises a serious question about long-term sustainability. <Cite refs={["turn500931search1"]}/> The issue isn’t whether Cardano can scale. It’s whether scaling can translate into consistent, organic demand for blockspace. More transactions alone don’t guarantee stronger value for ADA. Activity driven by incentives, automated behavior, or temporary campaigns can inflate metrics without creating durable economic demand. For ADA to build a stronger fundamental case, three things matter: • Sustainable growth in genuine network usage. • Fee revenue that increasingly supports network incentives. • Real demand for ADA beyond speculation and staking rewards. My thesis: Cardano’s long-term challenge is converting technological capacity into measurable economic value. Until fee generation catches up with the reward structure, adoption metrics tell only half the story. The real question isn’t how many transactions Cardano can process. It’s how much sustainable economic demand those transactions create. #MyByXTake

ELSAUSDT: The Recovery Is Holding — But $0.0839 Still Matters ELSA was trading around $0.0760 in the October 28 market snapshot, after pulling back from its recent highs. Buyers are still trying to defend the recovery, but I’m not treating this as a fresh breakout while price remains below $0.0839 resistance. There’s an important fundamental detail worth watching. HeyElsa is developing an AI crypto copilot for transactions, swaps and DeFi activity. Its official litepaper describes ELSA utility features such as execution-fee discounts, premium-agent access and on-chain execution. These are stated use cases, but real adoption and sustained demand still need to be demonstrated. Supply matters too. ELSA has a maximum supply of 1 billion tokens, while circulating-supply estimates differ across trackers: CoinGecko lists around 228.98 million, while CoinMarketCap reports approximately 255.64 million. I wouldn’t treat either figure as definitive without a consistent supply methodology. Key figures | 28 October 2026 - ~$0.0760 — Market-price reference - $0.0839 — First resistance to reclaim - $0.0899 — Second resistance if the breakout holds - $0.0754 — First support to defend - $0.0690 — Next support if the first level breaks Bullish confirmation: ELSA reclaims $0.0839 and holds above it on a retest. That would strengthen the recovery setup and bring $0.0899 into focus. Bearish confirmation: Price closes below $0.0754 and fails to reclaim it. That would weaken the short-term setup and put $0.0690 back on the radar. I’m also watching the November token unlock. Trackers estimate around 17.7 million ELSA, but disagree on whether it is scheduled for November 19 or 20. That is potential additional supply, not guaranteed selling. I wouldn’t chase ELSA just because its AI narrative is attracting attention. I want price confirmation and a clearer picture of how new supply may affect the market. The recovery needs confirmation. Supply pressure deserves attention. $ELSAUSDT #ByXIMPACT


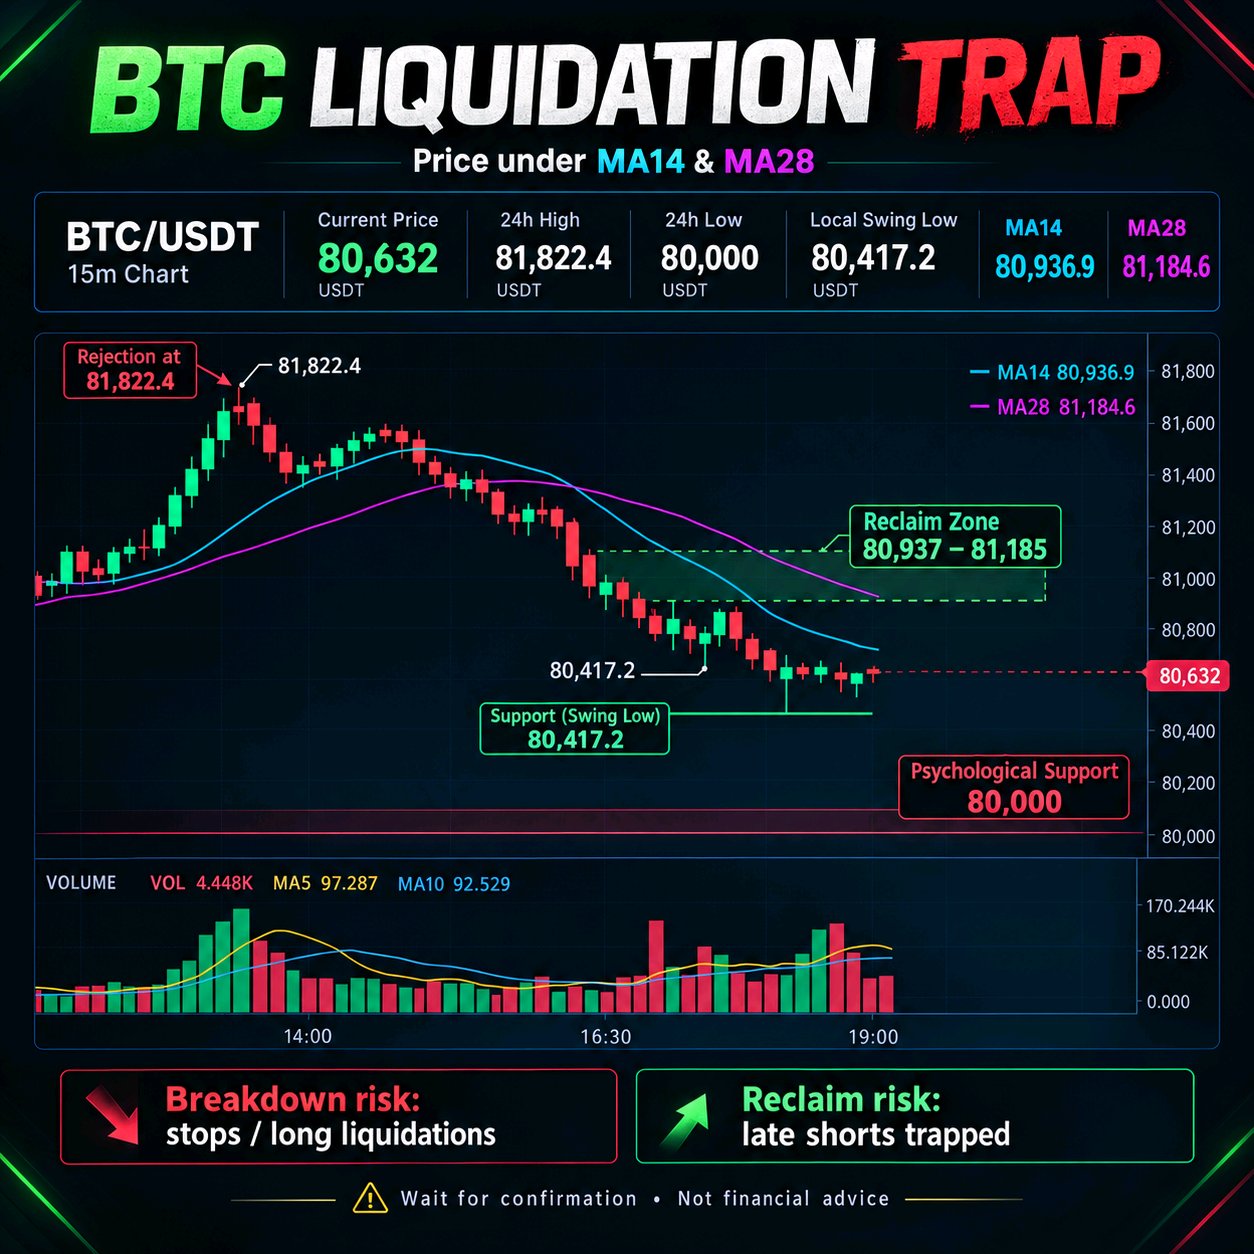
BTC Liquidation Trap ⚠️ | $80.6K Bitcoin is showing weakness after rejection near $81,822. Price is now around $80,632, trading below both MA14 and MA28. 🔻 $80,417: Local support to watch 🔻 $80,000: Key psychological level 🔺 $80,937–$81,185: Recovery zone to reclaim A breakdown could trigger stop-losses and long liquidations. But a strong recovery above the moving averages could trap late sellers instead. Don't chase the move. Let price confirm the next direction. Which comes first: a sweep below $80K or a bounce toward $81.2K? $BTCUSDT #IMPACTbyTrade

$BMTUSDT: BMT’s 68% surge has turned into a test of whether buyers can actually regain control. Bubblemaps (BMT) exploded on October 24, reaching an intraday high near $0.0585 as daily trading volume climbed to roughly 1.59 billion BMT. But the follow-through disappeared: by October 27, BMT closed near $0.0281—more than 50% below that spike’s high. Now comes the more interesting signal. BMT has rebounded from its October 28 low around $0.0268, with price returning toward $0.029. Yet derivatives data still shows negative funding, meaning short positions are paying longs to remain open. Open interest was also down 1.3% over 24 hours in one October 28 snapshot, despite the price recovery. That combination matters: the rebound may be partly a reaction to crowded bearish positioning—not proof that sustained spot demand has returned. Negative funding can help fuel a squeeze, but it cannot guarantee one. What confirms a stronger recovery? BMT needs to hold above the recent $0.0268 low and challenge the $0.030–$0.031 area, where the previous sessions saw selling pressure. A sustained move above that zone would improve the recovery case; losing $0.0268 would put the rebound thesis under pressure. The key question for the next few sessions is not whether BMT can bounce. It already has. It is whether buyers can turn that bounce into a durable recovery while derivatives positioning remains skewed toward shorts$BMTUSDT #ByXIMPACT

Crypto is starting to prove its value beyond trading. Tether, Bybit, Kraken, Solana Foundation and other major players have joined forces to launch FASE, a Swiss nonprofit focused on financial security, scam prevention and support for trafficking survivors. The scale is what caught my attention: • Up to 10M young people targeted with digital education and anti-scam tools • Stablecoin-based humanitarian aid pilot could reach 1M people • Support planned for organizations helping trafficking survivors across Africa This is a different side of crypto: not just markets, but access, protection and real-world financial utility. For the industry, initiatives like this could matter far beyond the next market cycle. $SUSDT $SOLUSDT #ByXIMPACT #IMPACTbyTrade #WSOT2026



🪙 LTCUSDT | Trade Update Successful trading requires a clear strategy, patience, and disciplined execution — not emotional decisions. • Market: LTCUSDT • Direction: Market Confirmation Required • Timeframe: 15M • Strategy: Market structure, momentum & key levels • Focus: Capital protection and risk management Watch how price reacts around support and resistance. A breakout with strong volume may present an opportunity, while a breakdown below support could invalidate the setup. Unrealized P&L is not realized profit. • Follow the plan. • Control your risk. Discipline over emotion. 🚀📊 $LTCUSDT $CHILLGUYUSDT #FOMCRateDecision #Bybit8thAnniversary #IMPACTbyTrade #MyByXTake #MidtermsMarketWatch


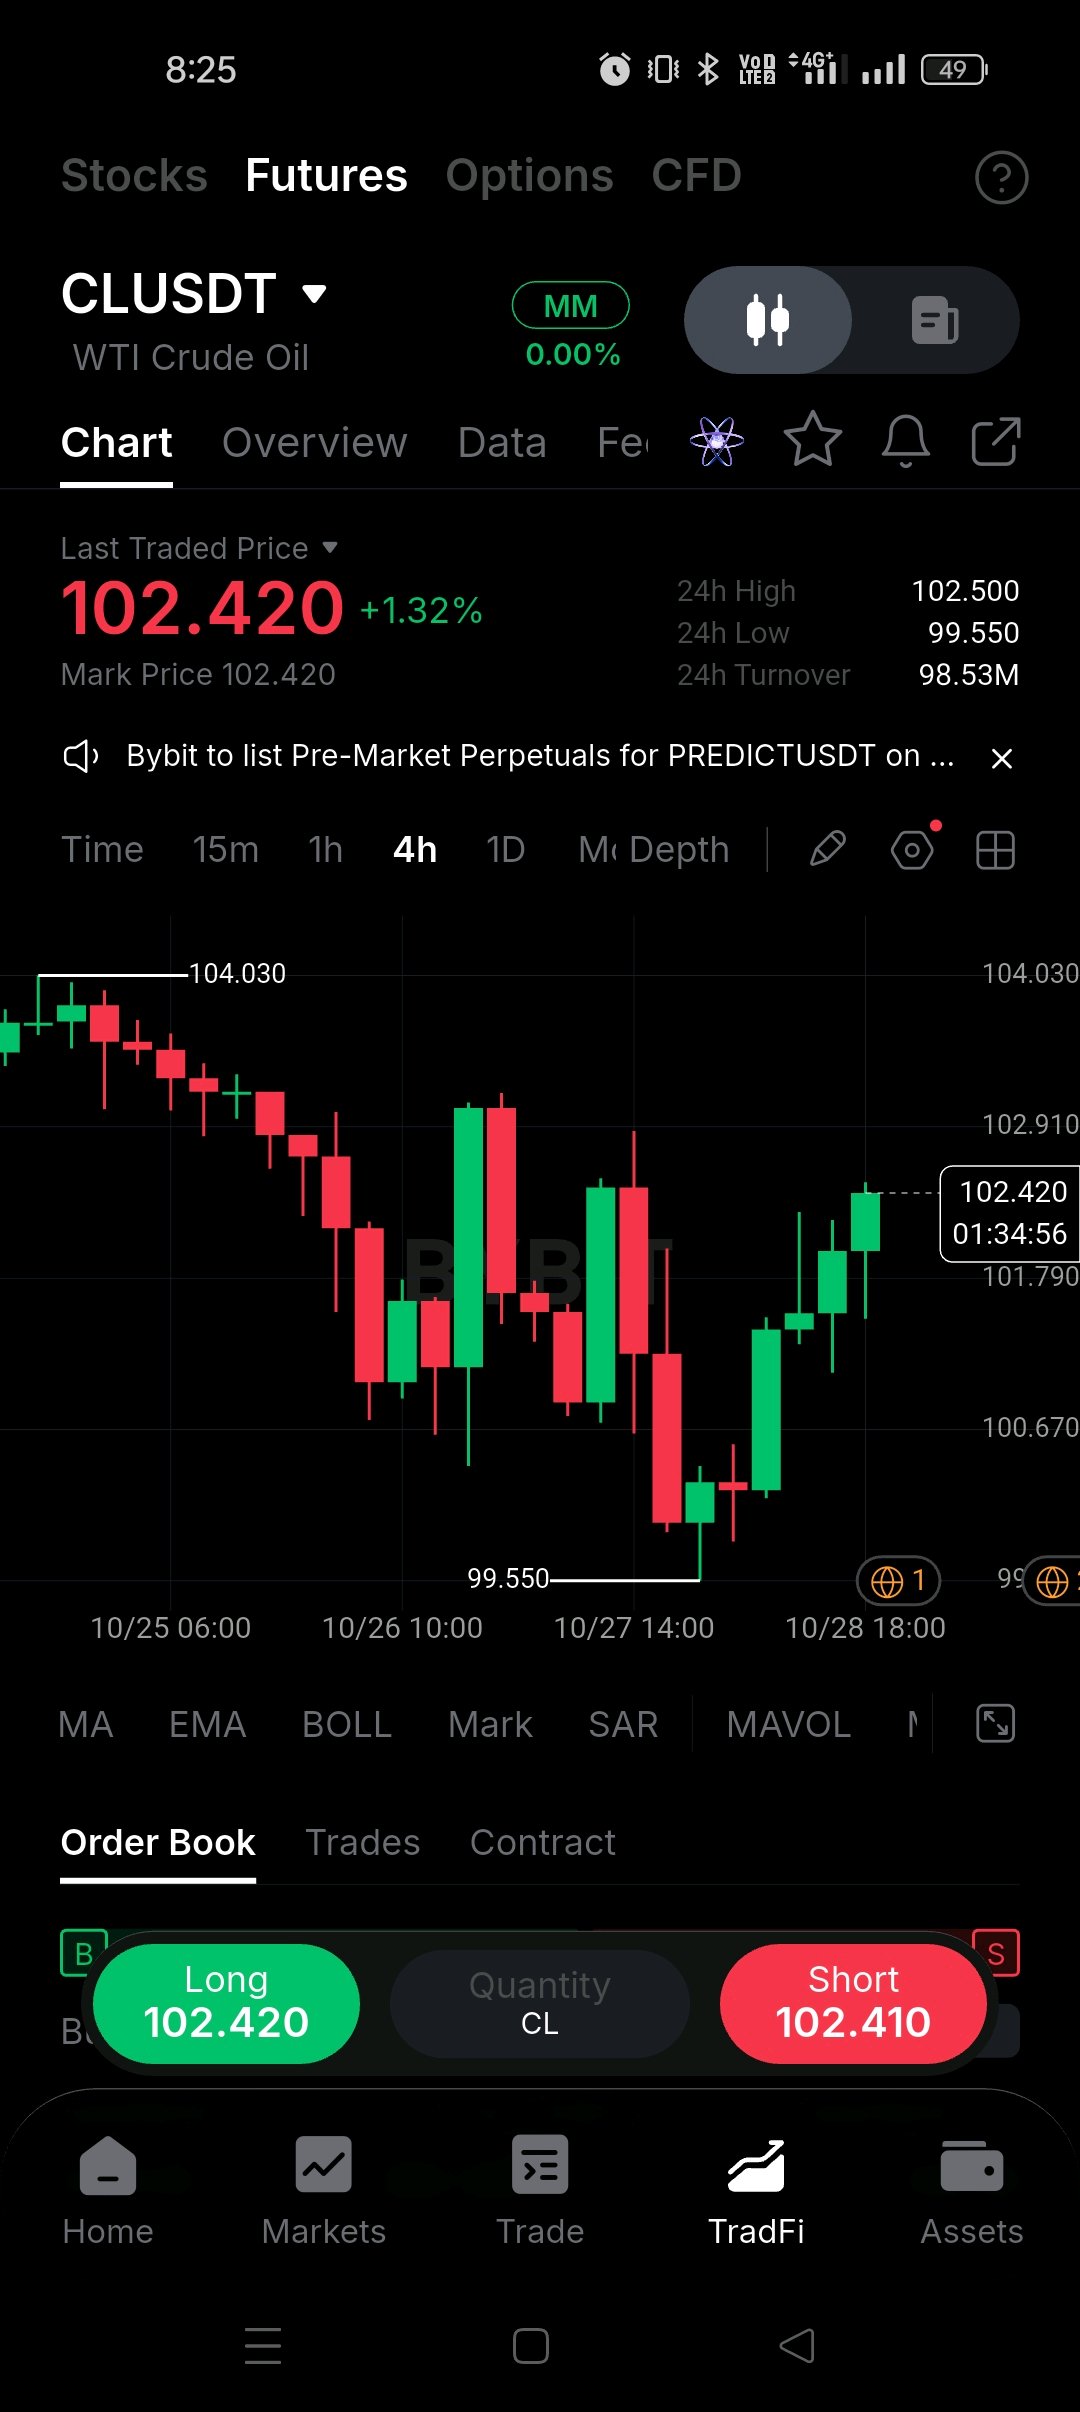
CLUSDT 4H Chart Analysis
WTI Crude Oil is showing a recovery after dropping to the $99.55 support zone. Buyers have pushed the price back above $102 and the recent candles show positive momentum. The next resistance is around $102.90. If buyers break this level and hold above it the price could move toward $103.50 and $104.00. However if the price gets rejected near resistance it may pull back toward $101.80 or $100.70. My view is cautiously bullish as long as the price holds above the nearby support levels. I will watch the $102.90 zone closely for the next move. #MyByXTake #CLUSDT

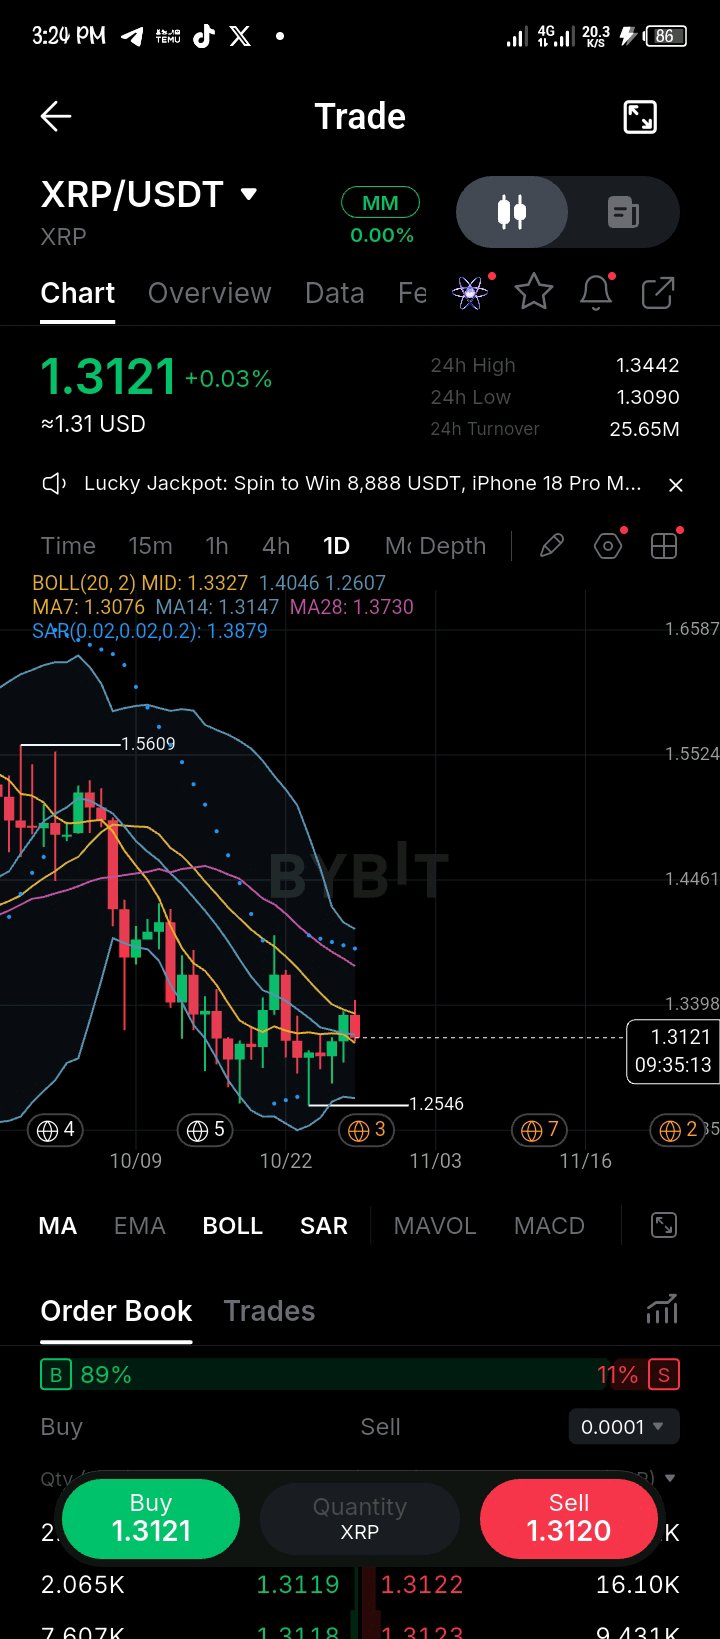
$XRPUSDT +0.03% to 1.3121 — This is a bottom coiling after a trend flush, trying to reclaim the MA cluster.* What caught my attention isn't the flat +0.03%, it's the structure behind it. Price topped around 1.5609 near BOLL Upper, then flushed straight down - losing MA7: 1.3076, MA14: 1.3147, MA28: 1.3730, and BOLL MID: 1.3327, and washed to 1.2546 low, tagging near BOLL Lower at 1.2607. Now we are sitting at 1.3121, chopping back into the MA7/MA14 box after that drop. The detail that matters most is the BOLL + MA compression. BOLL(20,2) MID is 1.3327, Upper 1.4046, Lower 1.2607. Price is still BELOW MID but holding above MA7: 1.3076 - first sign of support reclaim. MA14: 1.3147 is the immediate trigger, MA28: 1.3730 is still way above - bear stack still intact but tightening. SAR is high at 1.3879 - downtrend dot not flipped. Order book 89% Buy vs 11% Sell - heavy absorption on this bottom. My read is this is late-stage downtrend basing, not a breakout. Selling at 1.3121 right above 1.3090 (24h Low) / 1.2607-1.2546 support is terrible risk/reward. Buying here is also early without confirmation above MID. If price holds above 1.3076 (MA7) and closes above 1.3147 / 1.3327 (MA14 + BOLL MID), the setup for a mean-reversion long towards 1.3442 (24h High) then 1.3730 (MA28) and 1.4046 (BOLL Upper) becomes attractive. Lose 1.3090, then 1.2607-1.2546 gets retested. Structural lines I care about: Capitulation support 1.2546-1.2607, immediate support 1.3076, trigger 1.3147 / 1.3327, expansion 1.3730 / 1.4046. This is bottom coiling holding MA7 - watch the BOLL MID reclaim, don't chase inside the box. #MyByXTake #IMPACTbyTrade $USDCUSDT @

🚀 Wall Street Just Took a Big Step Toward Putting Securities on Blockchain. And this time, it's not just another experiment. On October 28, DTCC announced the launch of its Tokenization Service through its subsidiary, The Depository Trust Company (DTC). Why is this important? Because DTCC is a major part of the infrastructure behind traditional securities markets. Its new service allows eligible securities held at DTC to be represented as blockchain tokens, while preserving their existing ownership rights and investor protections. The initial eligible list includes 34 securities, covering selected stocks, ETFs and U.S. Treasuries. But here's the part that makes this different from the usual tokenization headlines. Participants can convert eligible holdings between traditional and tokenized forms, while tokenized securities remain recorded in DTC’s official books and records. The service currently supports Canton Network and DTCC's private Besu network, with additional blockchain integrations planned for 2027. There's a catch, though. This isn't permissionless trading for anyone with a crypto wallet. Participants must opt in, wallets must be registered, and transfers are restricted to registered wallets. DTCC says 20 participants have signed access agreements. So what's the bigger opportunity? Tokenized securities could eventually move more efficiently between traditional financial systems and blockchain infrastructure, potentially improving how institutions manage and transfer collateral. Those benefits still need to prove themselves in practice. The real milestone isn't that Wall Street discovered tokenization. It's that a major piece of Wall Street's existing infrastructure has now launched a service built around it. #RWA #Tokenization #Blockchain #TradFi


Hyperliquid Unstakes 180,000 $HYPE For Monthly Team Unlocks, As Buyer Of Previous OTC Sale Remains A Mystery$HYPEUSDT #Hypeusdt

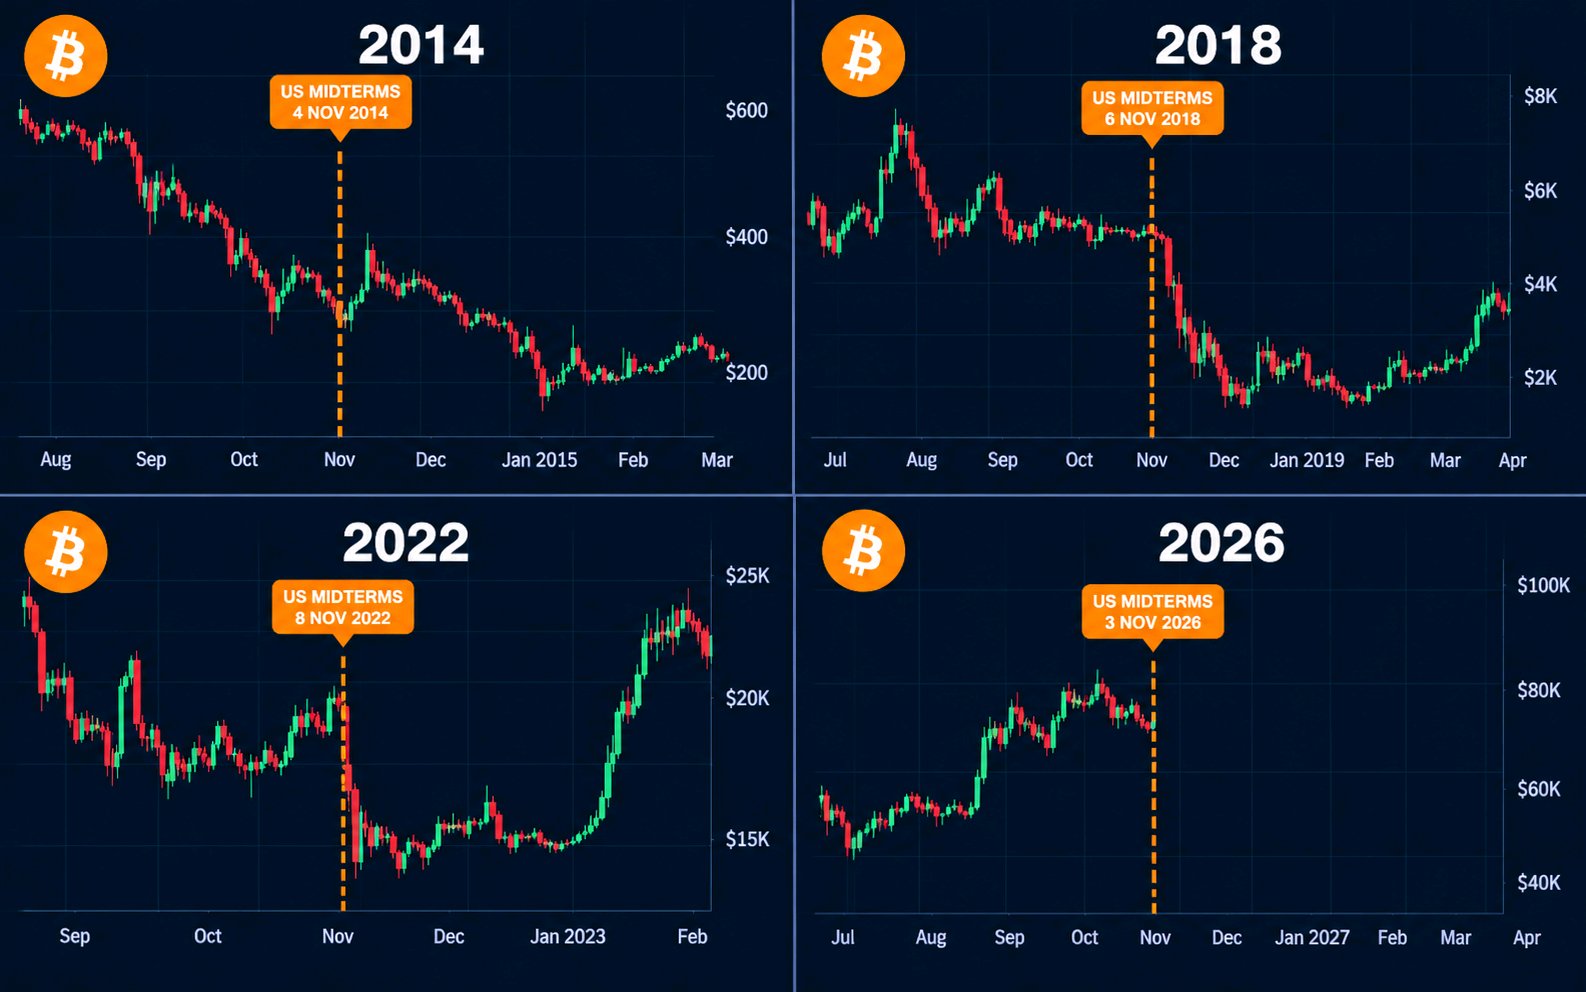
🚨 Will Bitcoin Crash After the 2026 Midterms?
HISTORY IS WARNING BITCOIN HOLDERS! Bitcoin has crashed after every US midterm election. Will history repeat, or will BTC finally break the cycle? $BTCUSDC #BybitStocks

SK hynix Smashes Q3 & Halts Solidigm’s $10B IPO
Revenue: KRW 104.62T Operating Profit: KRW 83.33T 🔥 Key Driver: Surging HBM4 shipments and AI-driven memory demand. Meanwhile, SK hynix discontinued its review of Solidigm’s pre-IPO financing and potential US listing, previously valued at around $10B. 🤔 What’s your move? Buy the pullback, hold, or take profit? Trade SKHY Now #SKHynixEarningsBeat #MyByXTake #NewFinancialPlatform

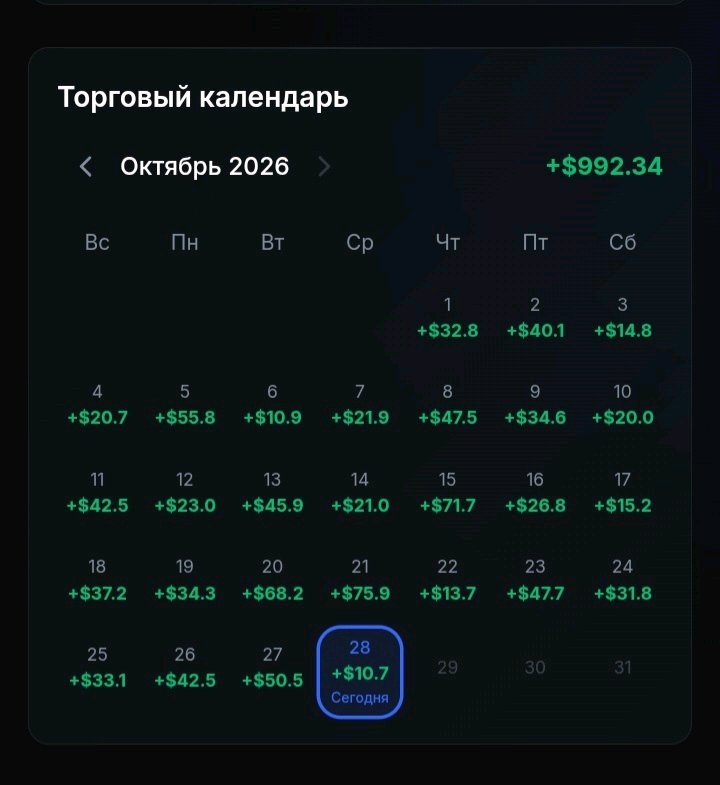
Смешно, когда люди спорят, работает это или нет. Я просто открываю приложение. Вот 👇

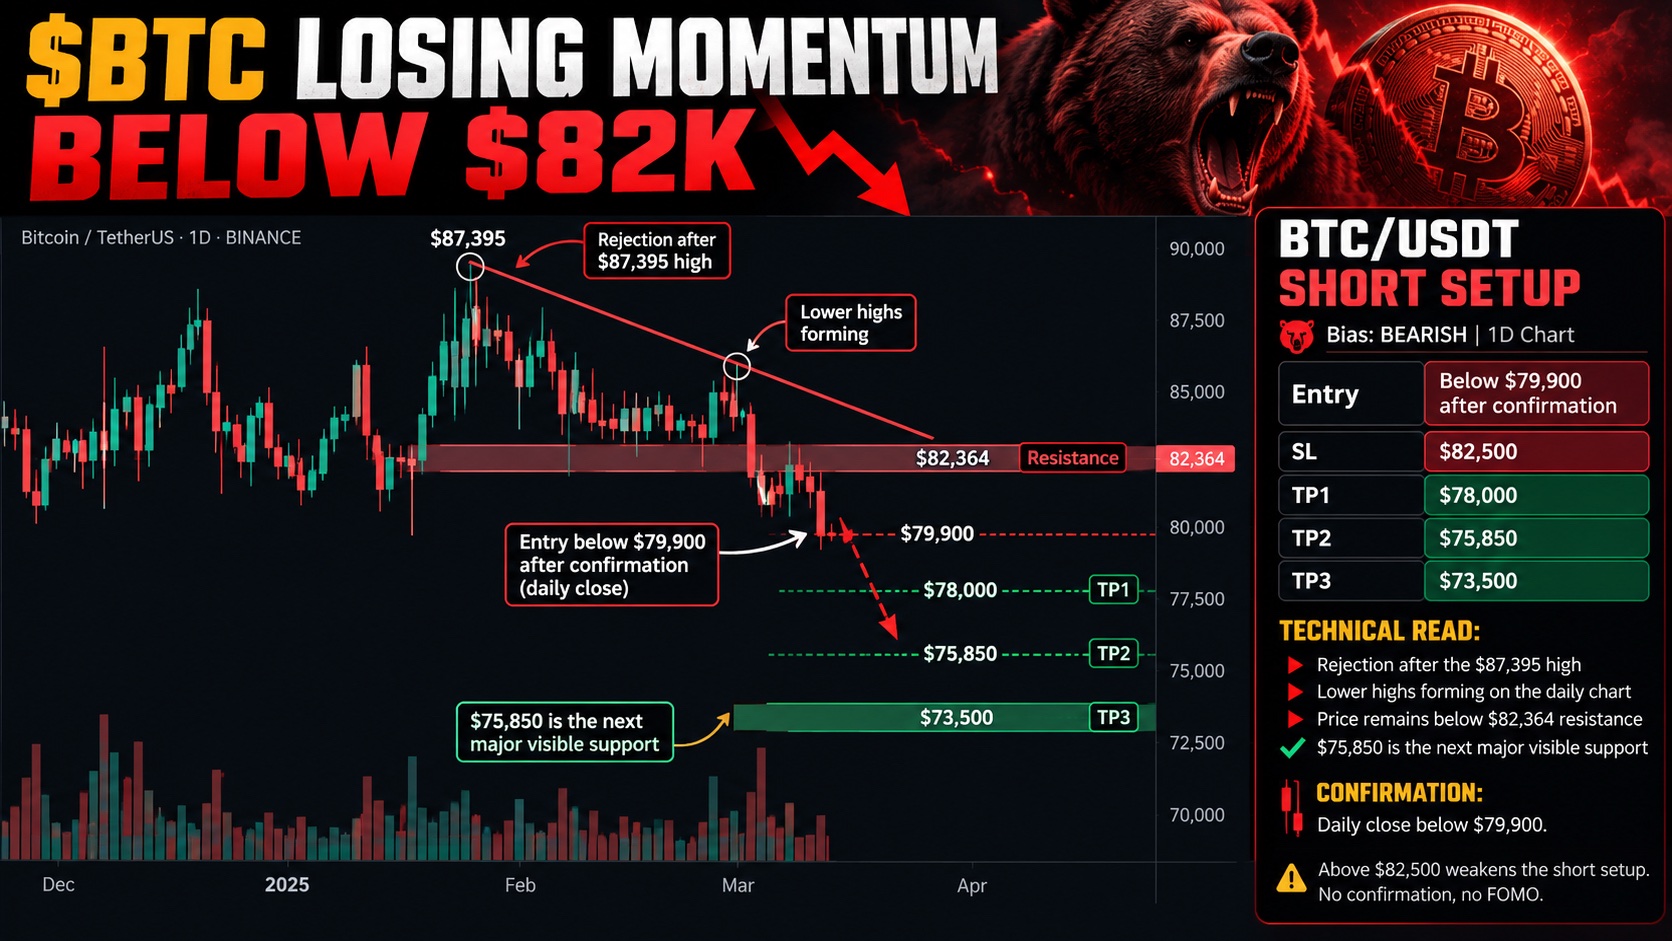
📉 $BTC Losing Momentum Below $82K
$BTCUSDT /USDT: SHORT SETUP Bias: BEARISH | 1D Chart Entry: Below $79,900 after confirmation SL: $82,500 TP1: $78,000 TP2: $75,850 TP3: $73,500 Technical read: 🔻 Rejection after the $87,395 high 🔻 Lower highs forming on the daily chart 🔻 Price remains below $82,364 resistance ✅ $75,850 is the next major visible support Confirmation: Daily close below $79,900. Above $82,500 weakens the short setup. No confirmation, no FOMO. #IMPACTbyTrade #ByXIMPACT

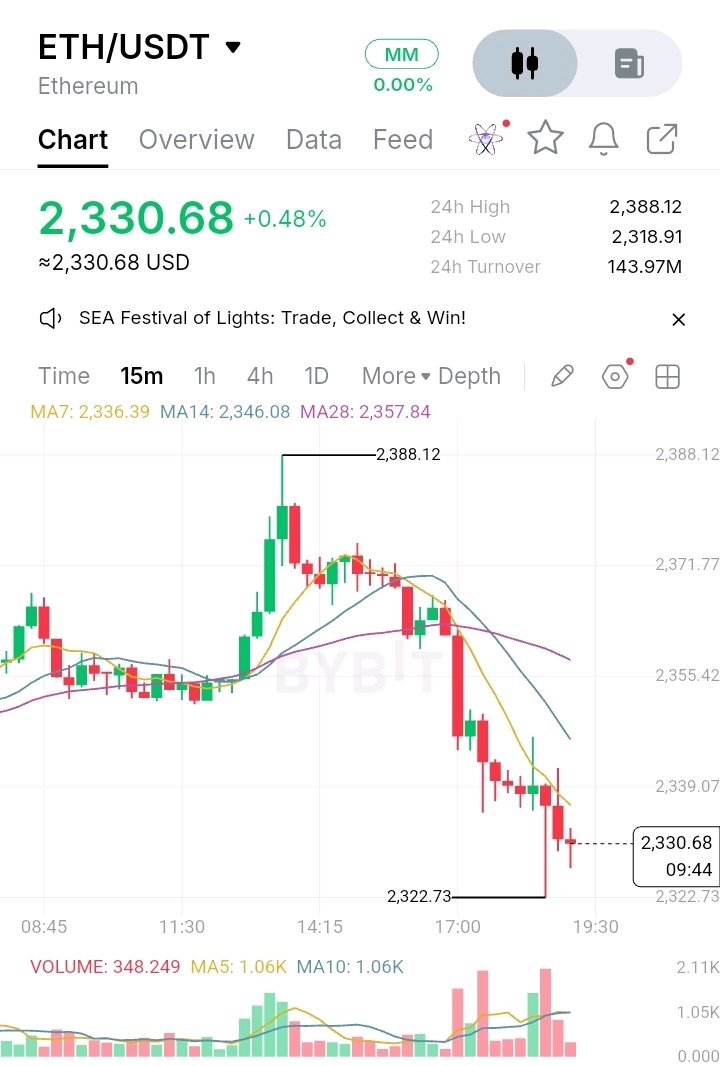
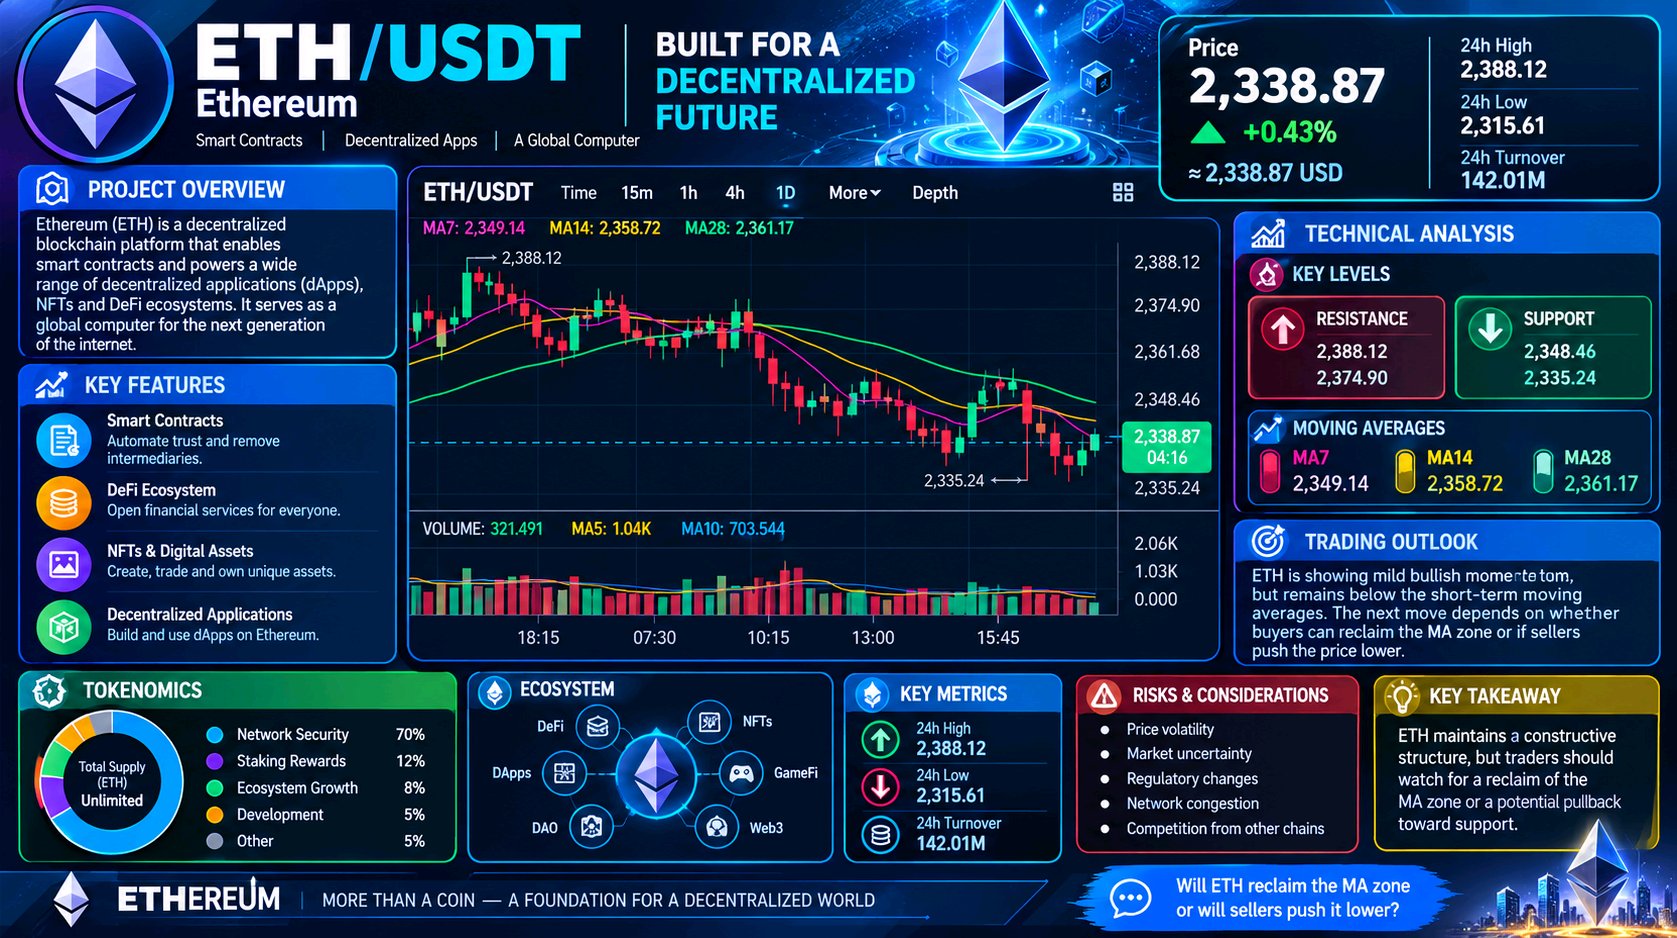
📊 $ETHUSDT Technical Analysis 💰 Price: $2,330.68 (+0.48%) 🔺 24h High: $2,388.12 🔻 24h Low: $2,318.91 📈 Moving Averages - MA7: $2,336.39 - MA14: $2,346.08 - MA28: $2,357.84 ETH is trading below all three moving averages, indicating short-term bearish pressure despite its positive 24-hour performance. 🎯 Key Levels - Resistance: $2,336, $2,346, $2,358 - Support: $2,322.73, $2,318.91 🚀 Bullish Scenario: Reclaiming $2,336 could open the way toward $2,346 and $2,358. ⚠️ Bearish Scenario: A break below $2,318.91 may signal further weakness. 📉 Volume: Displayed volume is below MA5 and MA10, suggesting limited buying momentum. Market Outlook: ETH remains under short-term pressure. Watch for a moving-average reclaim or a breakdown below support for the next directional signal. 💬 Will ETH recover above $2,350 or retest $2,319 first? #ByXIMPACT #IMPACTbyTrade

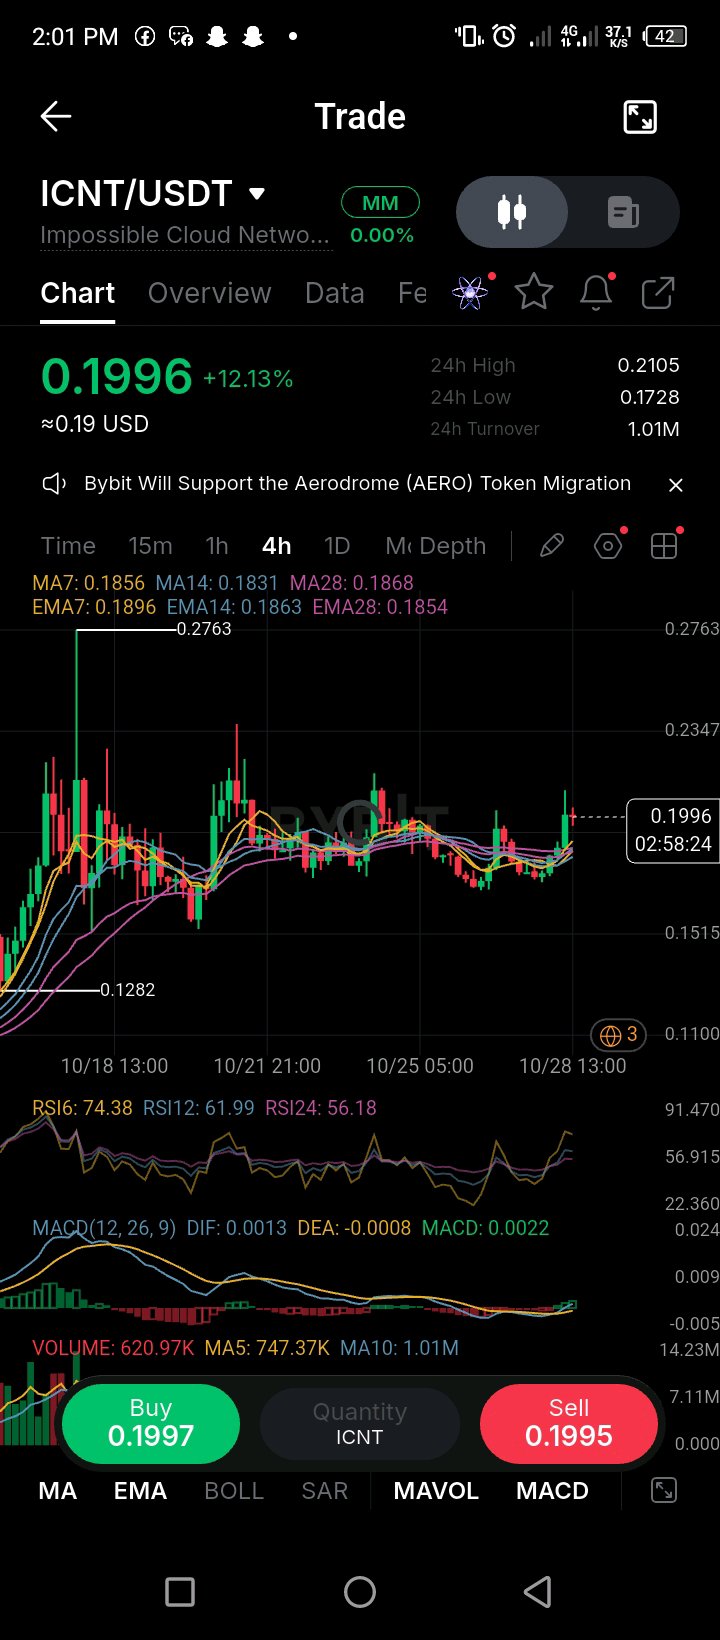
ICNT Is Picking Up Momentum Again 👀
$ICNTUSDT is making a move on the 4H chart, trading at 0.1996 and up 12.13%. After spending several candles moving sideways, the price is starting to push higher again. Now I’m watching to see if buyers can keep this momentum going. The moving averages are looking better, with MA7 at 0.1856 sitting above MA14 at 0.1831 and MA28 at 0.1868. The price is also trading above these averages, which is a positive sign for the bulls. MACD has turned positive, with DIF at 0.0013 and the histogram at 0.0022. RSI6 is at 74.38, so the price is already getting a bit hot in the short term. A pullback wouldn’t be surprising after this kind of move. Here are the levels I’m watching: Resistance: 0.2105, the 24-hour high. If $ICNT breaks above this level and holds, buyers could push for another move higher. Support: Around 0.1850–0.1870, where several moving averages are sitting. If the price pulls back, this is the area I’d watch first. My take? $ICNT looks bullish for now, but after a 12% move, I wouldn’t rush to chase the price. A clean break above 0.2105 would be a stronger sign that buyers are ready to take it higher. Risk Disclosure: Always DYOR. #WSOT2026 #AnthropicS1Filing #IMPACTbyTrade #MyByXTake #MidtermsMarketWatch

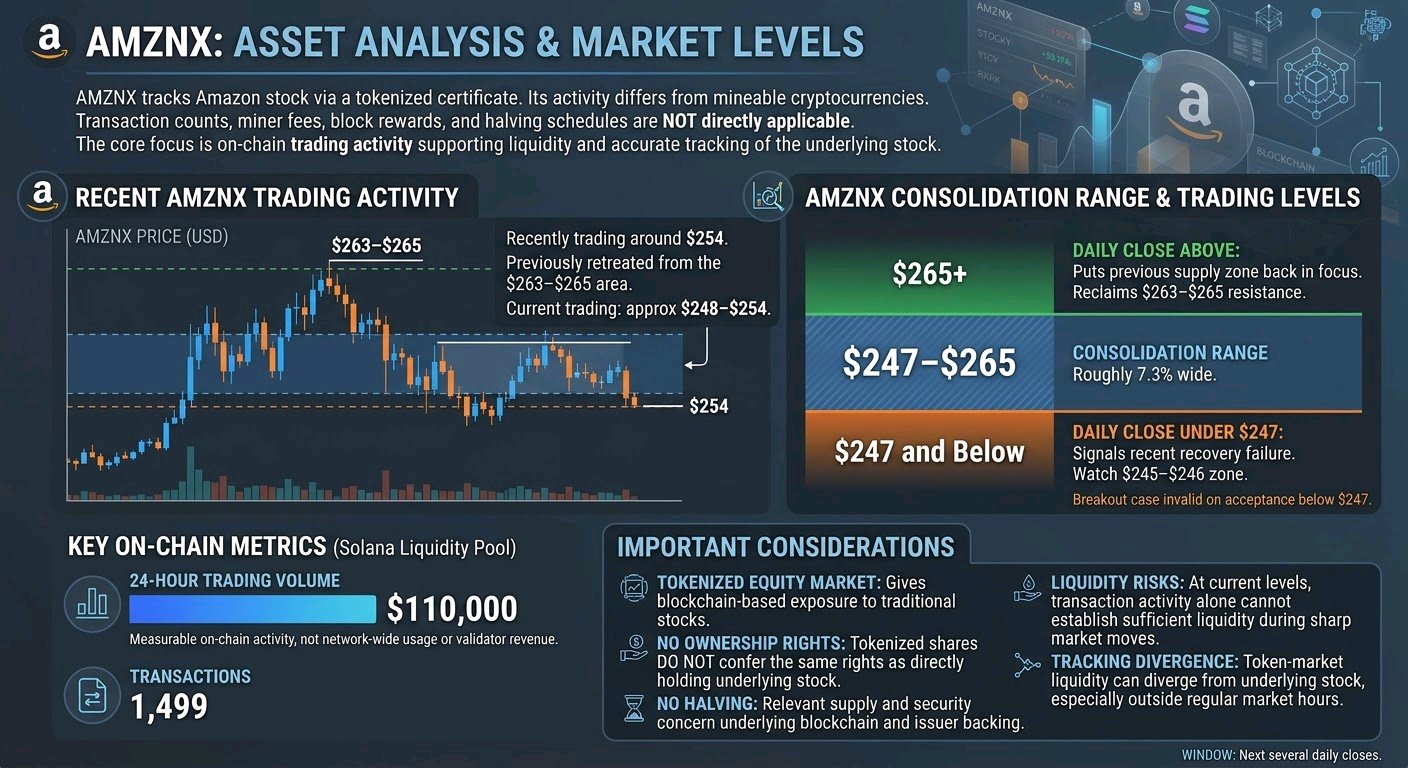
$AMZNXUSDT is a different kind of asset: it tracks Amazon stock through a tokenized certificate, so its activity needs to be read differently from a mineable cryptocurrency. Transaction counts, miner fees, block rewards and a halving schedule do not apply directly to AMZNX. The relevant question is whether on-chain trading activity supports liquidity while the token continues to track its underlying stock. AMZNX has traded around $254 recently, with the token tracking Amazon's underlying share price. On one tracked Solana liquidity pool, recent data shows roughly 1,499 transactions and about $110,000 in 24-hour trading volume. That is measurable on-chain activity, but it is not the same as network-wide usage or revenue paid to validators. AMZNX is a tokenized stock, and that is the point. Its value comes from exposure to Amazon shares, not mining rewards or a native block-reward schedule. Solana's validator economics secure the underlying blockchain, while AMZNX holders remain exposed to token liquidity, tracking differences and issuer-related risks. There is no AMZNX halving to circle on the calendar. The relevant supply and security questions concern the underlying blockchain and the token issuer's backing arrangements. At current trading levels, transaction activity alone cannot establish whether the token's liquidity is sufficient during a sharp market move. I don't think that's a design flaw. When someone quotes the transaction count, the number that pays for security is a different one. AMZNX has recently traded around $248–$254 after retreating from the $263–$265 area. Underneath is the broader tokenized-equity market, which gives eligible users blockchain-based exposure to traditional stocks. AMZNX is designed to track Amazon, but tokenized shares do not confer the same ownership rights as directly holding the underlying stock. That explains the attention, not a dated price trigger. No directional call from the middle of a box after a move this size. Levels instead: Above $265: a daily close over it puts the previous supply zone back in focus. The $263–$265 area is the first resistance region to reclaim. Below $247: a daily close under it signals that the recent recovery is failing. The $245–$246 area is the next zone to watch. $247–$265: consolidation, roughly 7.3% wide. Window: the next several daily closes. AMZNX tracks Amazon's share price, but its token-market liquidity can diverge from the underlying stock, particularly outside regular market hours. The breakout case is invalid on acceptance below $247.#ByXIMPACT

据Bybit行情数据显示,MNT跌破$0.5,现报价$0.4998。

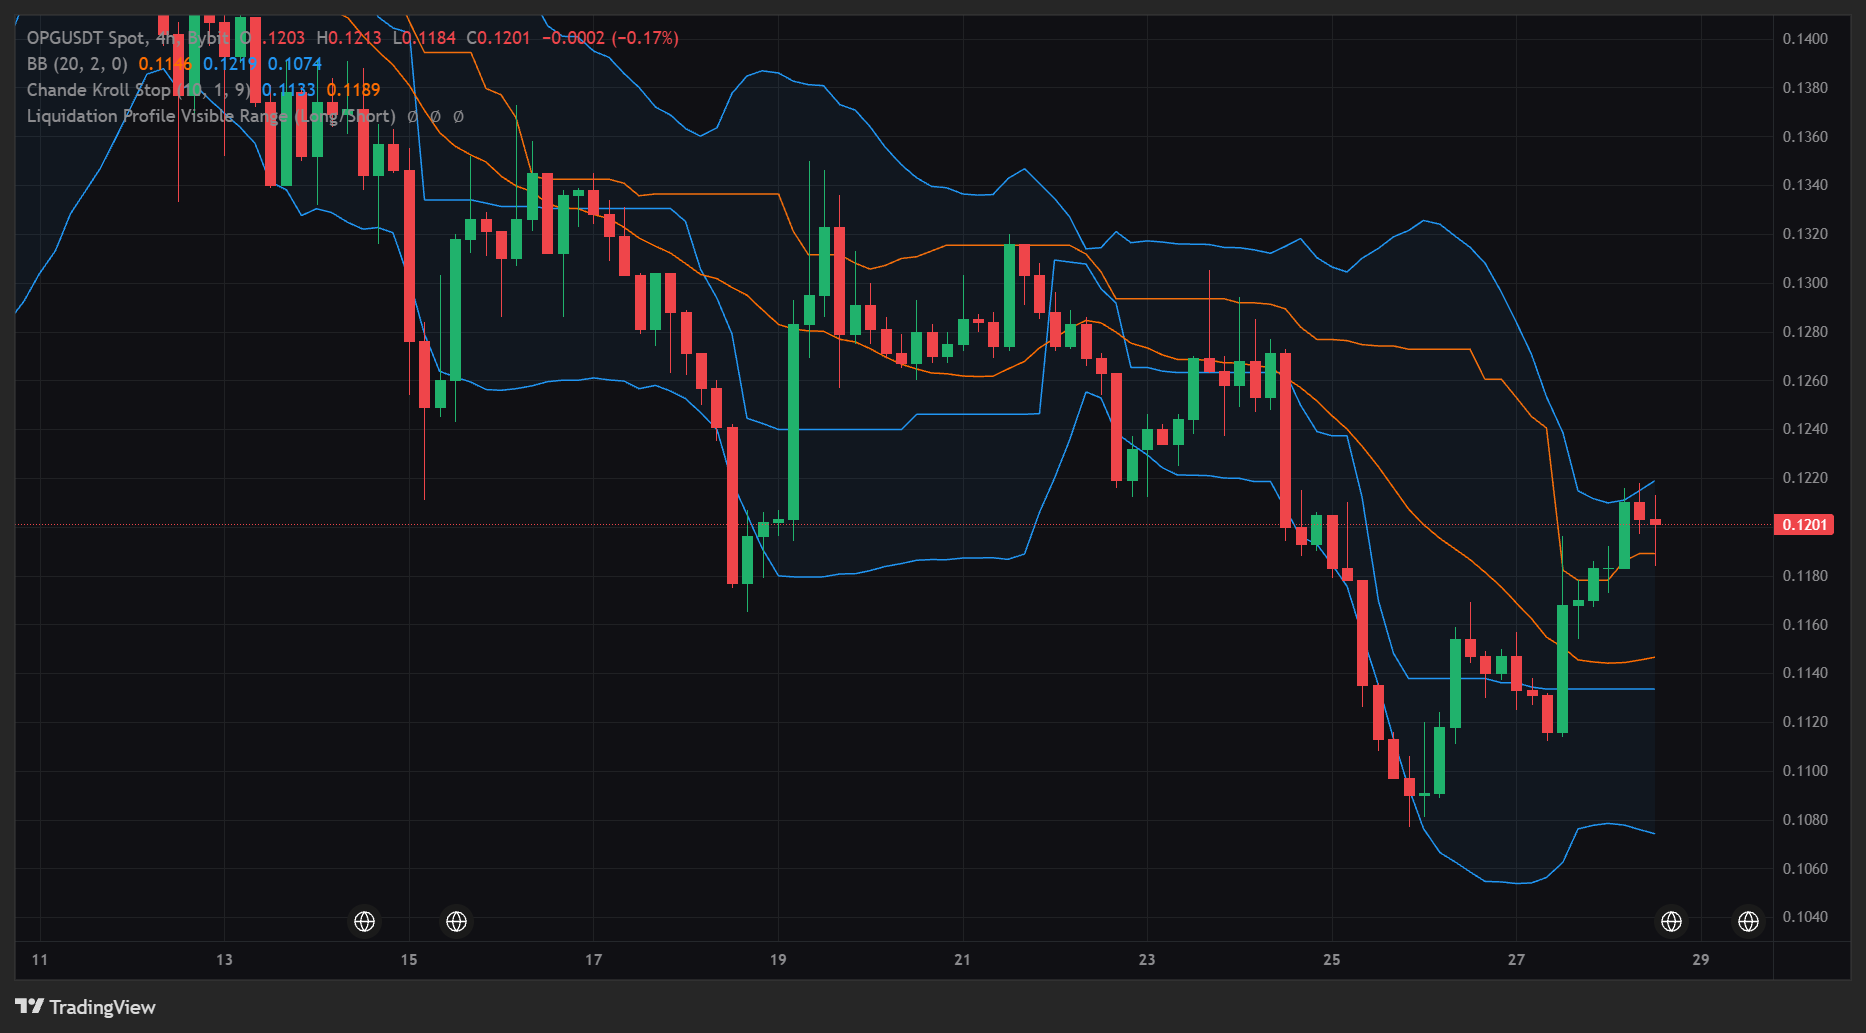
OPG is showing an interesting short-term recovery: buyers have pushed the price higher, but the market still needs to prove that this momentum can develop into a sustained move rather than another temporary bounce. Recent market data places OPG around $0.119–$0.120, with a positive 24-hour move despite a weaker performance over the previous seven days. This suggests that short-term buyers are returning, although the broader structure still requires confirmation. The key question now is whether OPG can break above nearby resistance or whether sellers will use the recovery to take profits. There is a fundamental development that makes this token worth watching beyond its immediate price action. OpenGradient is building decentralized infrastructure for artificial intelligence, focusing on running and verifying AI model inference. The idea is to make AI computation more transparent and verifiable through blockchain-based infrastructure. As demand for AI applications grows, networks offering reliable computational services could become increasingly relevant. But I keep coming back to one distinction: growth in AI adoption does not automatically translate into buying pressure for OPG. The project needs to demonstrate that real usage creates meaningful demand for its network and token. Developer adoption, computational demand, and sustainable ecosystem activity matter more than the AI narrative alone. Without a clear connection between network usage and token utility, market enthusiasm can fade even when the underlying technology continues developing. The token economics add another layer to the analysis. OPG has a total supply of 1 billion tokens, with allocations covering ecosystem development, the foundation, contributors, investors, staking rewards, liquidity, and airdrops. These allocations can support long-term development, but token distribution also matters when assessing potential selling pressure. An important detail is that approximately 9.13 million OPG tokens were scheduled to unlock on October 21, 2026. The market should distinguish between scheduled releases and actual selling: an unlock does not mean every token will immediately enter circulation or be sold. On the technical side, OPG is attempting to recover, but resistance remains important. The $0.1200–$0.1220 area is the first region I would watch. A convincing breakout above this zone, supported by stronger volume, could open the door toward $0.1260 and potentially $0.1300. On the downside, $0.1150 is an initial reference, followed by the $0.1100 region if selling pressure increases. My read is that OPG has an interesting AI infrastructure narrative, but the next move depends on whether buyers can maintain momentum above resistance. For a conditional long setup, I would wait for a confirmed breakout and successful retest. Entry zone: $0.1200–$0.1220 after confirmation SL: $0.1160 TP1: $0.1260 TP2: $0.1300 TP3: $0.1350 These are illustrative trading levels, not verified live chart signals. They should be reassessed against current price action and volume before entry. On the bearish side, a decisive break below $0.1150 would weaken the recovery thesis and increase the risk of a move toward $0.1100. A sustained move above $0.1220 would strengthen the bullish scenario. For now, I would avoid chasing the first green candle. The better opportunity would come from a confirmed breakout or a clear defense of support. The bigger OpenGradient thesis is whether verifiable AI infrastructure can generate sustainable network usage and meaningful token demand. The narrative is promising, but lasting market strength will depend on adoption, token economics, and buyers proving they can defend higher prices. #ByXIMPACT #NewFinancialPlatform $OPGUSDT $DIAMUSDT

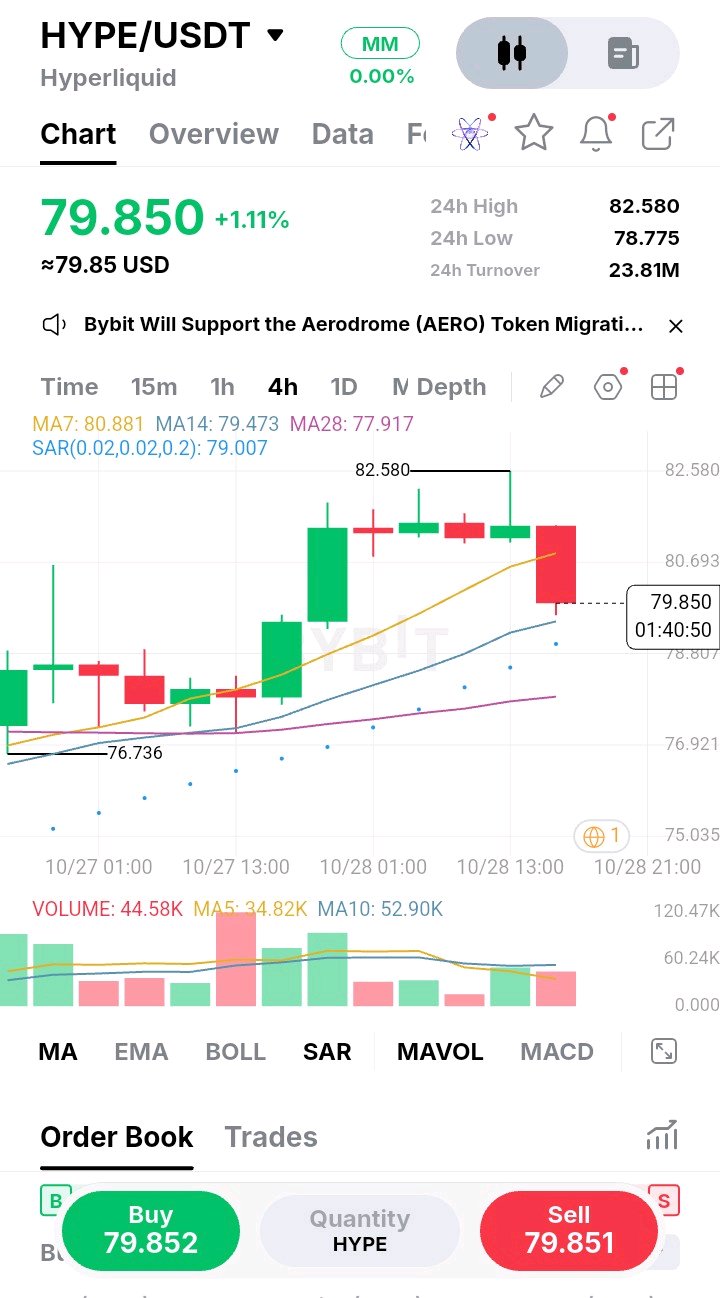
I keep looking at how price is behaving around this 80.88 MA7, and it feels like a classic momentum shift that’s easy to overlook if you aren't paying attention. The initial push up to 82.58 looked decent at first glance, but the follow-up was just a series of weak, indecisive candles grinding sideways. Now, we are finally seeing a heavy red 4H candle slicing right back into the moving average cluster, currently sitting at 79.85. What really stands out to me is that this rejection happened right at the top of the local range, and the buyers completely failed to defend it. There was no aggressive wick rejection or volume spike to save the day. I’ve definitely made the mistake of holding a long through a slow bleed like this, stubbornly thinking it was just a healthy pause, only to watch the price suddenly accelerate into a full-blown breakdown. That painful lesson taught me to respect the first hard push back through the MA7, especially when volume starts to dry up on the bounces. Right now, price is dropping toward the MA14 at 79.47. If we lose this immediate cluster, the path of least resistance is clearly lower. I expect a quick flush toward the next structural support levels as late longs get shaken out. I'm not front-running the break, but I am ready to act if the support cracks. Entry: 79.60 – 79.80 Confirmation: 4H close below 79.40 Stop: 80.90 (above the MA7 rejection) TP1: 78.80 TP2: 77.90 Invalidation: Reclaiming 80.80 with strong volume If price bounces cleanly from here and reclaims the 80.80 level, I’ll stand aside and wait for the next setup. How are you handling this breakdown? #ByXIMPACT $HYPEUSDT

Two names. One man. One narrative that could change everything. $TSLA is sitting at $398.30, down 0.97% today. $SPCX is trading around $147 after a volatile week — rising 7.79% one day then dropping 9.14% the next. Both companies are now under special committee review for a potential merger. That single word — merger — is what every serious trader needs to be watching right now. SpaceX just reported Q3 revenue of $14.57 billion, up 161% year over year. Its AI segment alone generated $7.6 billion — more than Starlink. Goldman Sachs has a $245 price target. UBS says $300. Yet the stock is sitting at $147. That gap between price and analyst targets tells you something. Tesla on the other hand is carrying the weight of Musk's political exposure, share sales for tax obligations, and uncertainty around what a merger would mean for existing shareholders. The key levels to watch on $TSLA are support around $385 to $390. A break below that opens the door to further downside. On $SPCX, $138 to $143 is the zone that determines whether this is a buying opportunity or the beginning of a deeper correction. Analysts put the three month recovery target between $170 and $220 — but only if that support holds. My honest take — the merger narrative is the real story here. If it happens, the combined entity becomes something the market has never seen before. If it falls apart, both stocks face serious selling pressure. The next few weeks will answer that question. $TSLAXUSDT $SPCXXUSDT #ByXIMPACT #BybitStocks #IMPACTbyTrade #MyByXTake



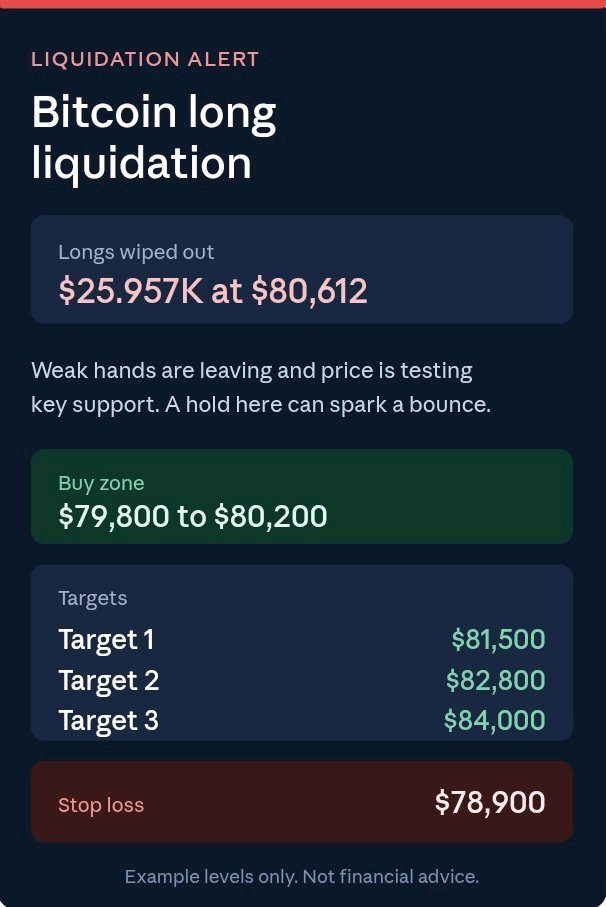
$BTCUSDT Longs worth $25.957K were wiped out at $80,612. Weak hands are leaving, and price is now testing a key support. If buyers defend this area, a sharp bounce can follow. Buy zone: $79,800 to $80,200 Targets: $81,500, $82,800, $84,000 Stop loss: $78,900 Wait for a candle to close above support before entering. Manage your risk. (About 60 words.) These levels are examples based on the price you gave, not live market data, and I'm not a financial advisor. Check the current chart before trading, and never risk more than you can afford to lose. #ByXIMPACT
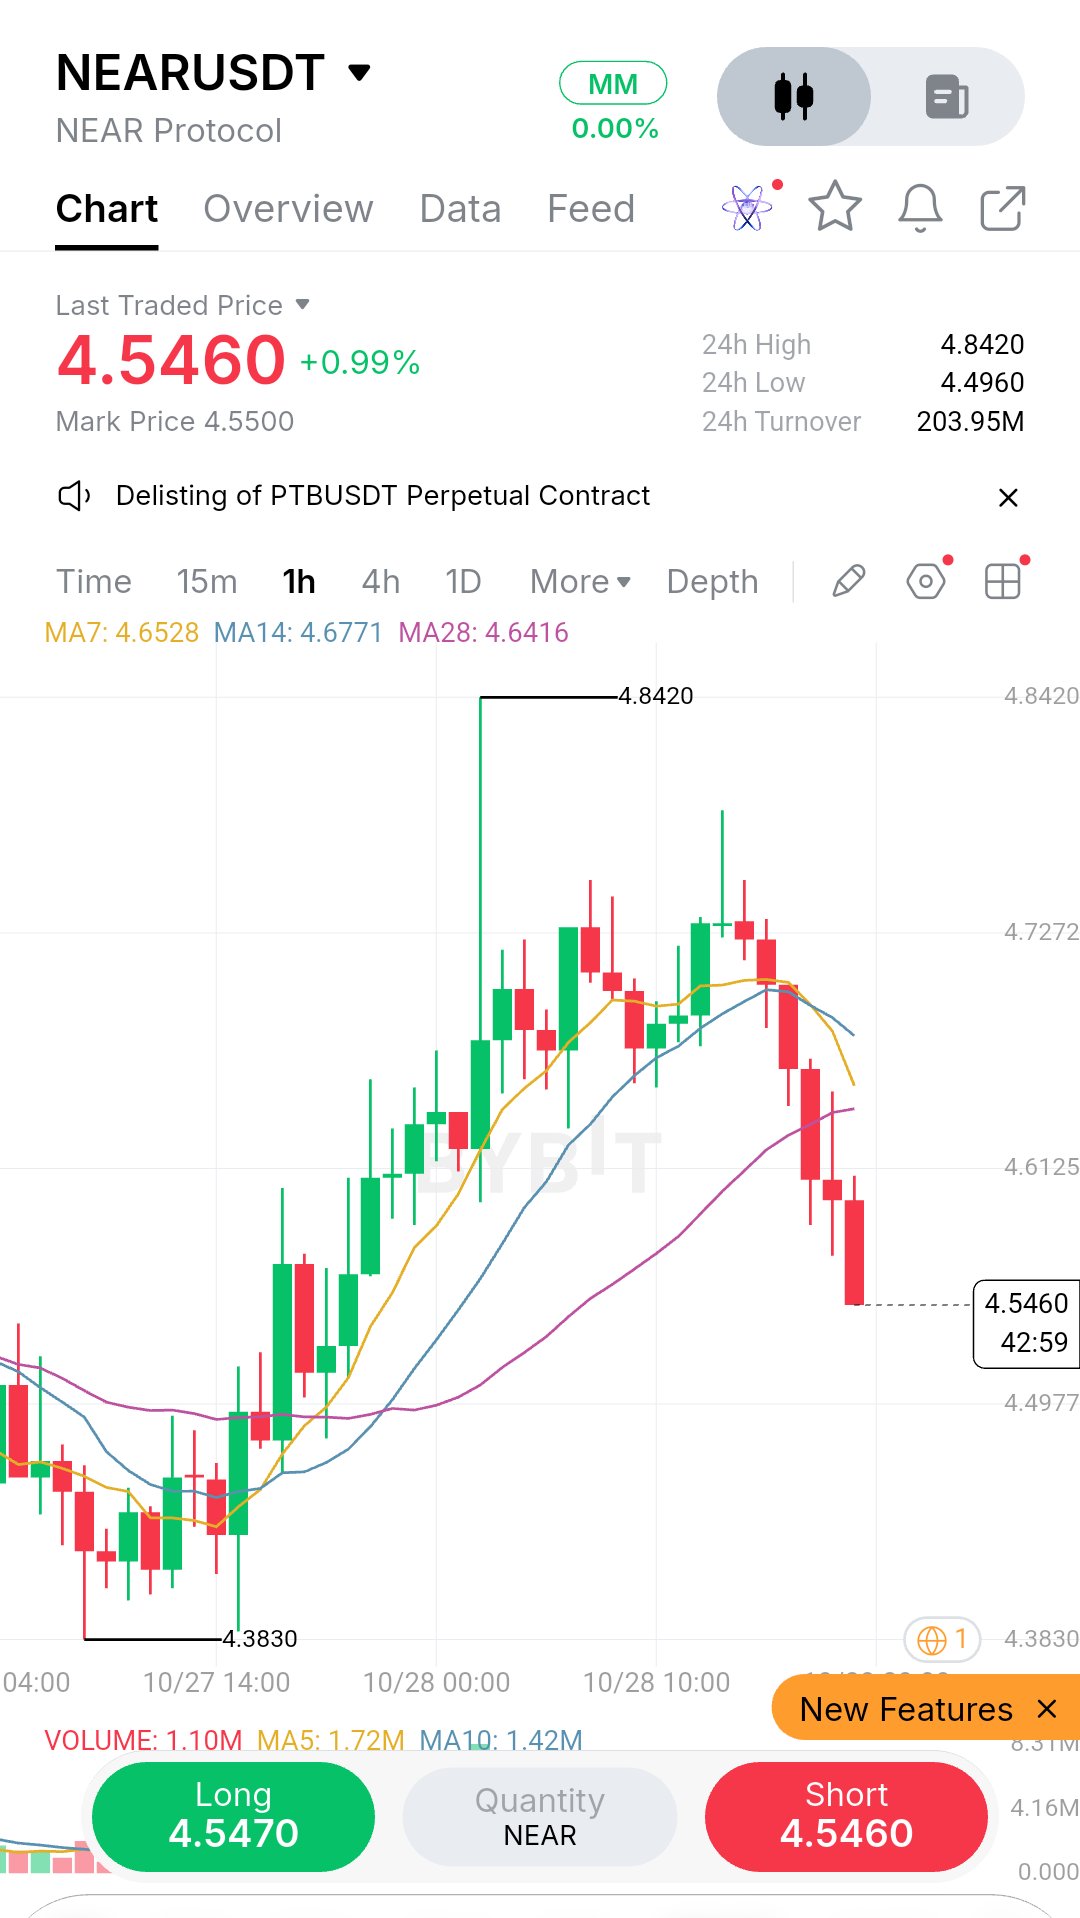
The move I’m paying attention to on $NEAR is the speed of the reversal from $4.8420. Buyers pushed price to a new visible high, but sellers have now erased much of that advance, and the latest candle is pressing toward the session low area. On the 1H chart, NEAR rallied from $4.3830 to $4.8420 before forming lower highs and accelerating downward. Price is now $4.5460, below MA7 at $4.6528, MA14 at $4.6771, and MA28 at $4.6416. That puts short-term momentum firmly under pressure, although the $4.4960 24H low is the next key area to watch. Volume is 1.10M, below MA5 at 1.72M and MA10 at 1.42M. Selling is clear in the candles, but volume has not expanded above its recent averages. I want a failed reclaim before committing to a short. My preferred setup is a conditional SHORT: Entry: $4.6000–$4.6500 after rejection Stop: $4.6900 TP1: $4.4960 TP2: $4.4400 TP3: $4.3830 R:R: Approximately 1.5R–3.7R from a $4.6250 entry. Invalidation: A sustained reclaim above $4.6900 cancels the short thesis. If TP1 hits, I’d consider taking partial profit and reducing risk. If NEAR drops without a retest, I won’t chase. The alternative is a reclaim of $4.6528 followed by a hold, which could signal stabilization. I’ve learned that after a sharp reversal, the best short is often the failed bounce—not the candle that has already fallen furthest. #ByXIMPACT $NEARUSDT

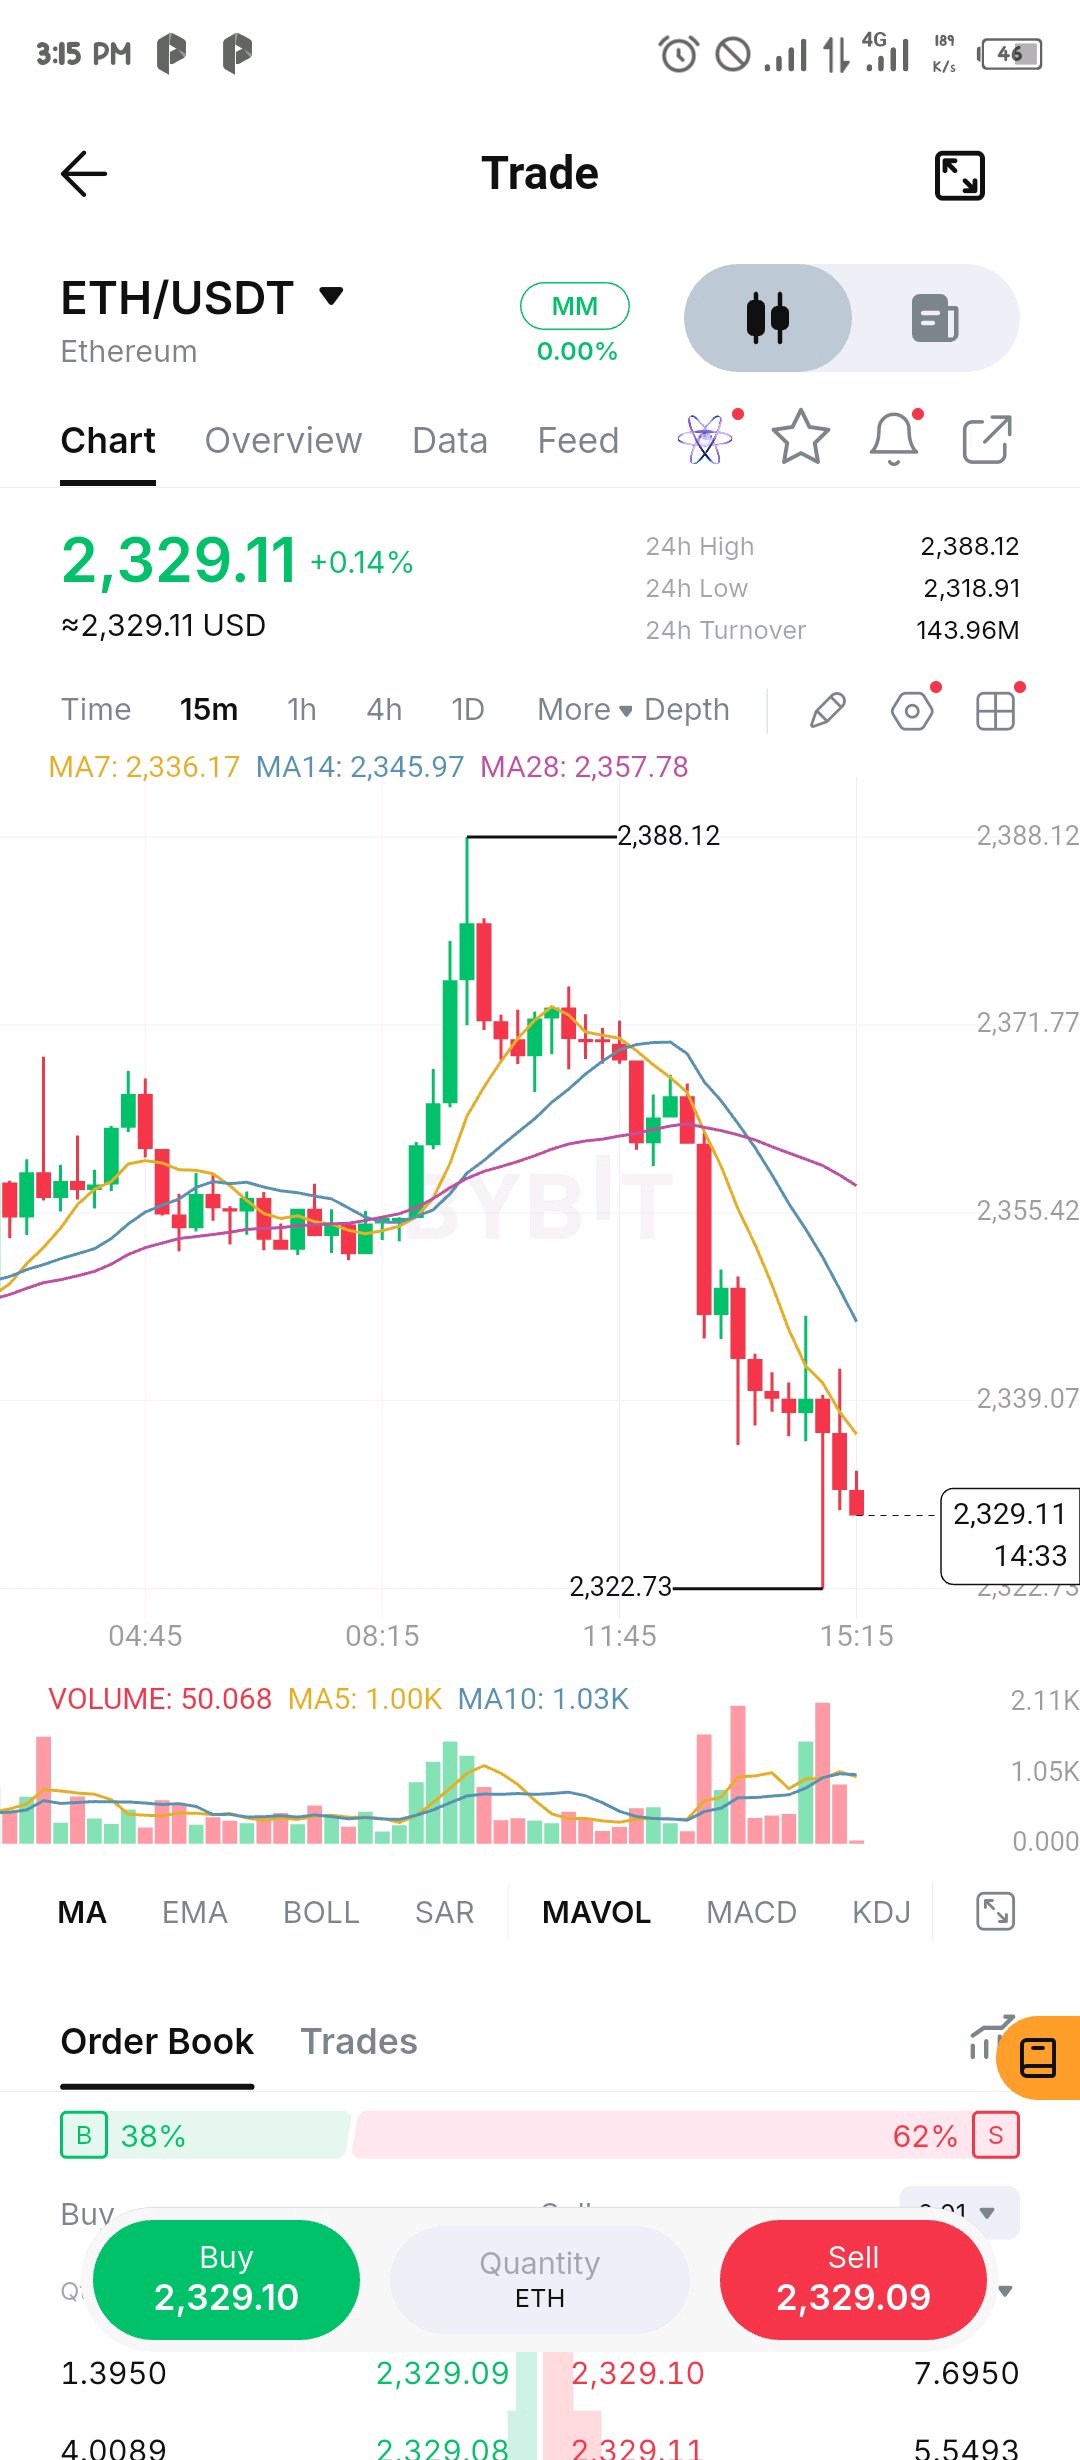
$ETHUSDT didn't just give back its spike, it lost the whole base underneath it ETH has done more than give back the spike to 2,388. It has now lost the base the move started from, which sat around 2,350 to 2,360, and the 2,340 area that held as a double bottom last night is behind it too. Price is 2,329.11. The way it came down matters. The slide has been a run of big red candles, and the three heaviest volume bars on the chart are all red, including the long flush wick to 2,322.73 that was only partly bought back. The averages have rolled over in order, MA7 (2,336.17) under MA14 (2,345.97) under MA28 (2,357.78), with price below all three, and the order book is 62% asks. That leaves overhead supply stacked. The MA7 near 2,336 is the first thing to reclaim, then the 2,346 to 2,358 zone where the MA14, MA28 and the old base sit. A real bounce has to get through that, not just tag it. Underneath, the 2,322.73 flush low and the 24h low at 2,318.91, only about 10 points away, are the next levels. A close below them leaves nothing on this chart to lean on. A quick reclaim of 2,336 would be the first sign this was just an overshoot. $ETHUSDT #ByXIMPACT
🇺🇸 BREAKING: US TREASURY MOVES FORWARD WITH CRYPTO REGULATION —WITH OR WITHOUT CONGRESS $BTCUSDT U.S. Treasury Secretary Scott Bessent says the government will push forward on crypto regulation even without new legislation from Congress. Speaking at Ripple’s Swell conference on October 27, Bessent indicated that the Treasury would bring the SEC and CFTC together to address regulatory gaps and establish clearer rules for the digital asset industry. The move follows the Senate’s failure to advance the CLARITY Act in September. 📌 Why This Matters: 🔹 Greater regulatory clarity for crypto businesses. 🔹 Better coordination between the SEC and CFTC. 🔹 Potentially improved confidence among institutional investors. 🔹 Continued efforts to address banking access for crypto companies. ⚠️ The Catch: Agency-led rules may be easier for future administrations to reverse than legislation passed by Congress. The Big Picture: Washington is signaling that crypto regulation will continue, even as lawmakers remain divided. The key question is whether these efforts can deliver lasting legal certainty for the market. #WSOT2026 #AnthropicS1Filing #IMPACTbyTrade #MyByXTake #MidtermsMarketWatch



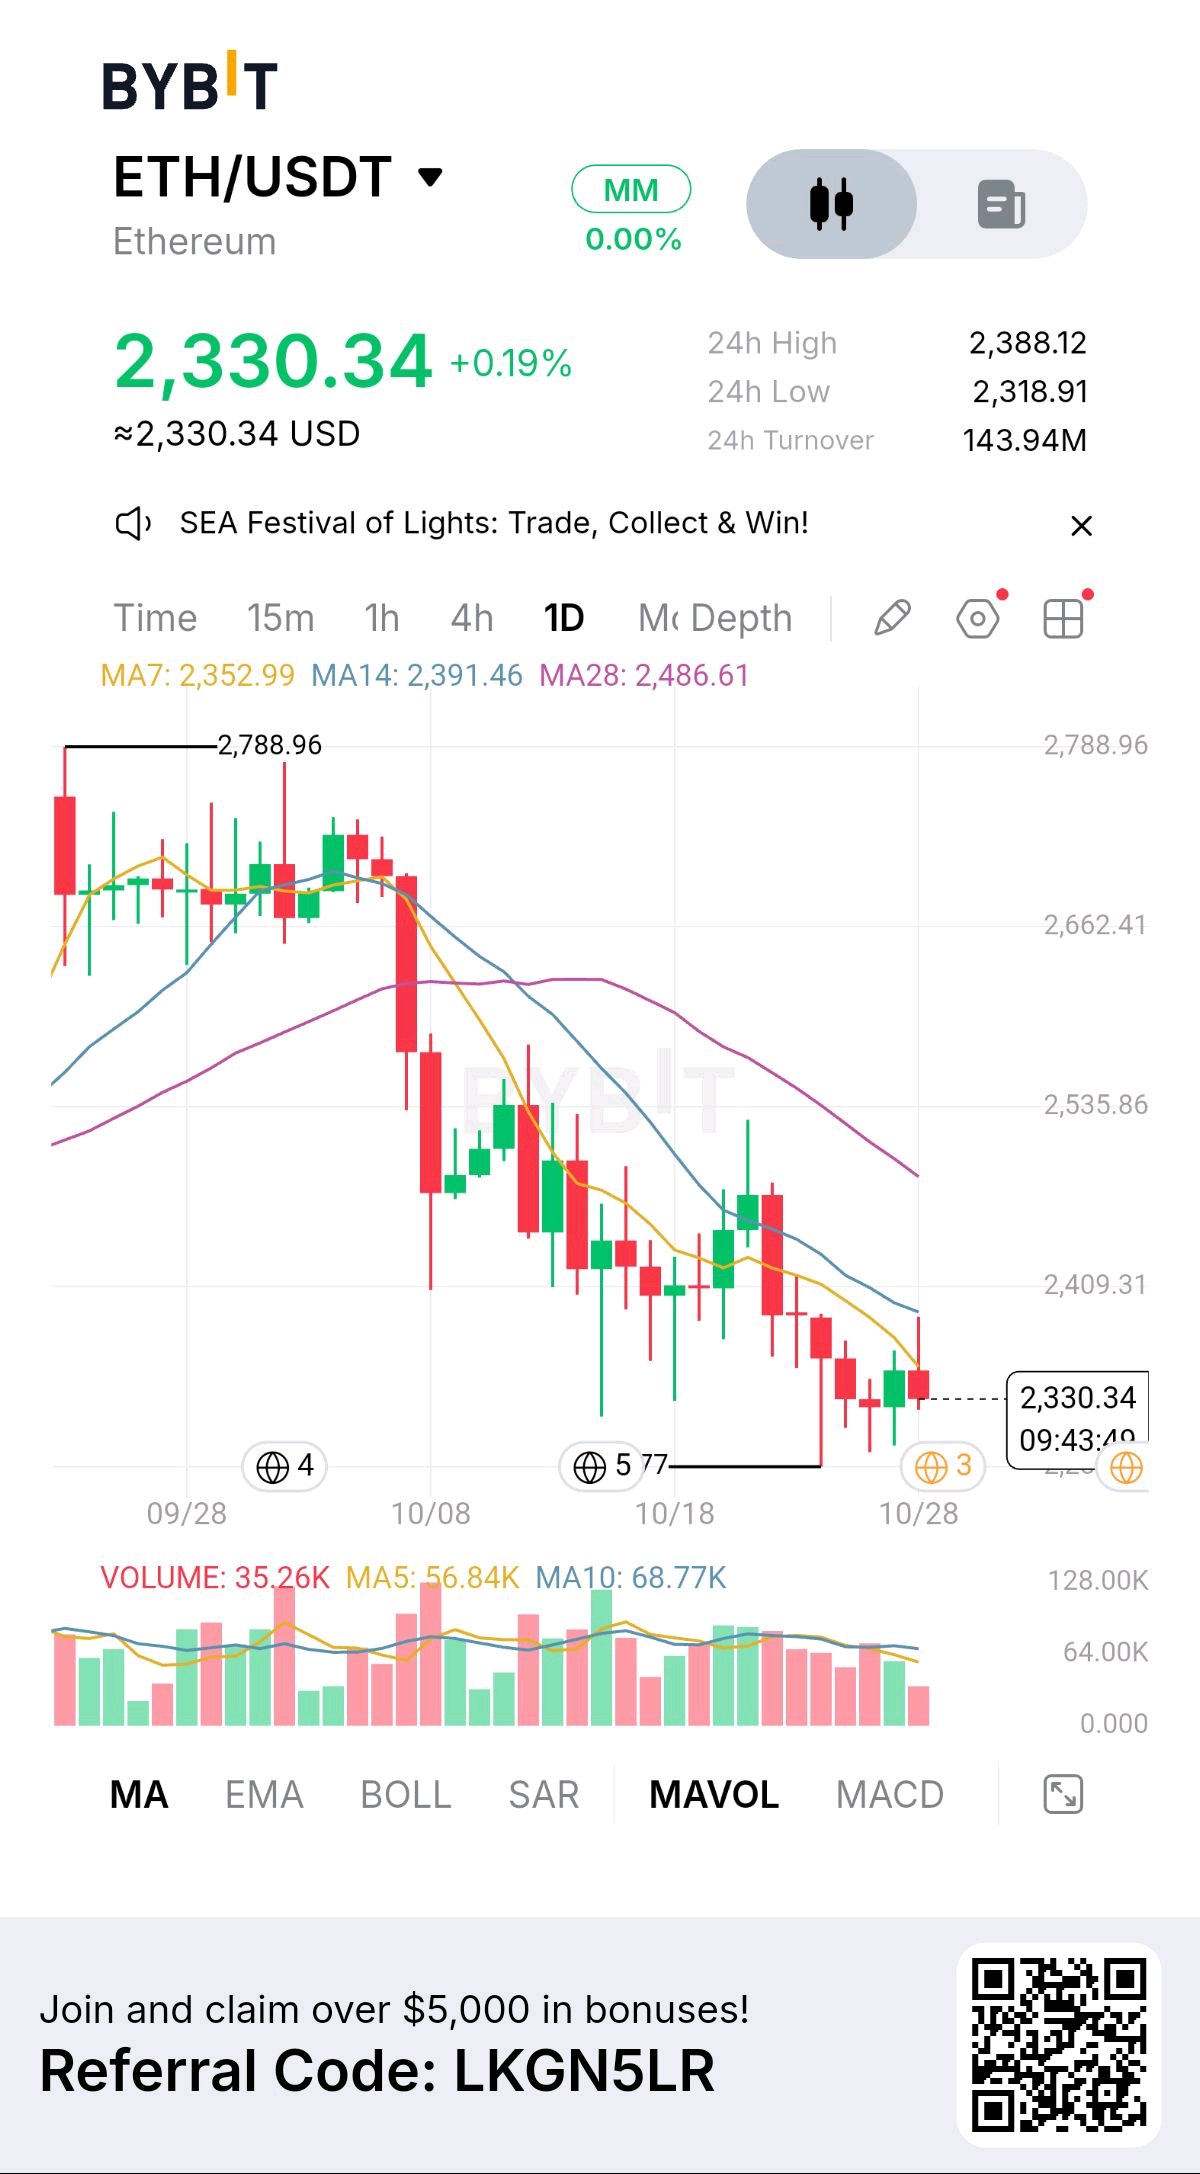
ETH ATTEMPTS BASE BUILDING BELOW OVERHEAD MOVING AVERAGES Price action is trying to hold local support, but declining moving averages keep pushing downward. One of those has to give. ETHUSDT | 1D | 2,330.34 (+0.19%) Bias: fragile below 2,352.99 (MA7), with no structural reversal until a daily close clears MA14 at 2,391.46. Market view A small green daily print is trying to stabilize after a prolonged leg down from the 2,788.96 peak. Price remains pinned underneath all major short-term moving averages, with the 24h low holding at 2,318.91 to provide temporary support. That is the constructive part. The weaker part: MA7 (2,352.99), MA14 (2,391.46), and MA28 (2,486.61) are all sloping downward in strong bearish alignment, keeping selling pressure active on every intraday bounce. Technical evidence Moving averages remain stacked bearishly directly overhead, showing tight compression that indicates ongoing range-bound consolidation before the next directional break. Volume and turnover 24h turnover stands at 143.94M, reflecting subdued volume as market participants wait for confirmation of either a breakout above MA7 or a breakdown below recent swing support. $ETHUSDT #ByXIMPACT

🚨 BREAKING: RIPPLE PARTNERS WITH COINBASE! $RLUSD IS EXPANDING ITS REACH IN CRYPTO TRADING, PAYMENTS & INSTITUTIONAL FINANCE! 🔥 #ByXIMPACT #Bybit8thAnniversary


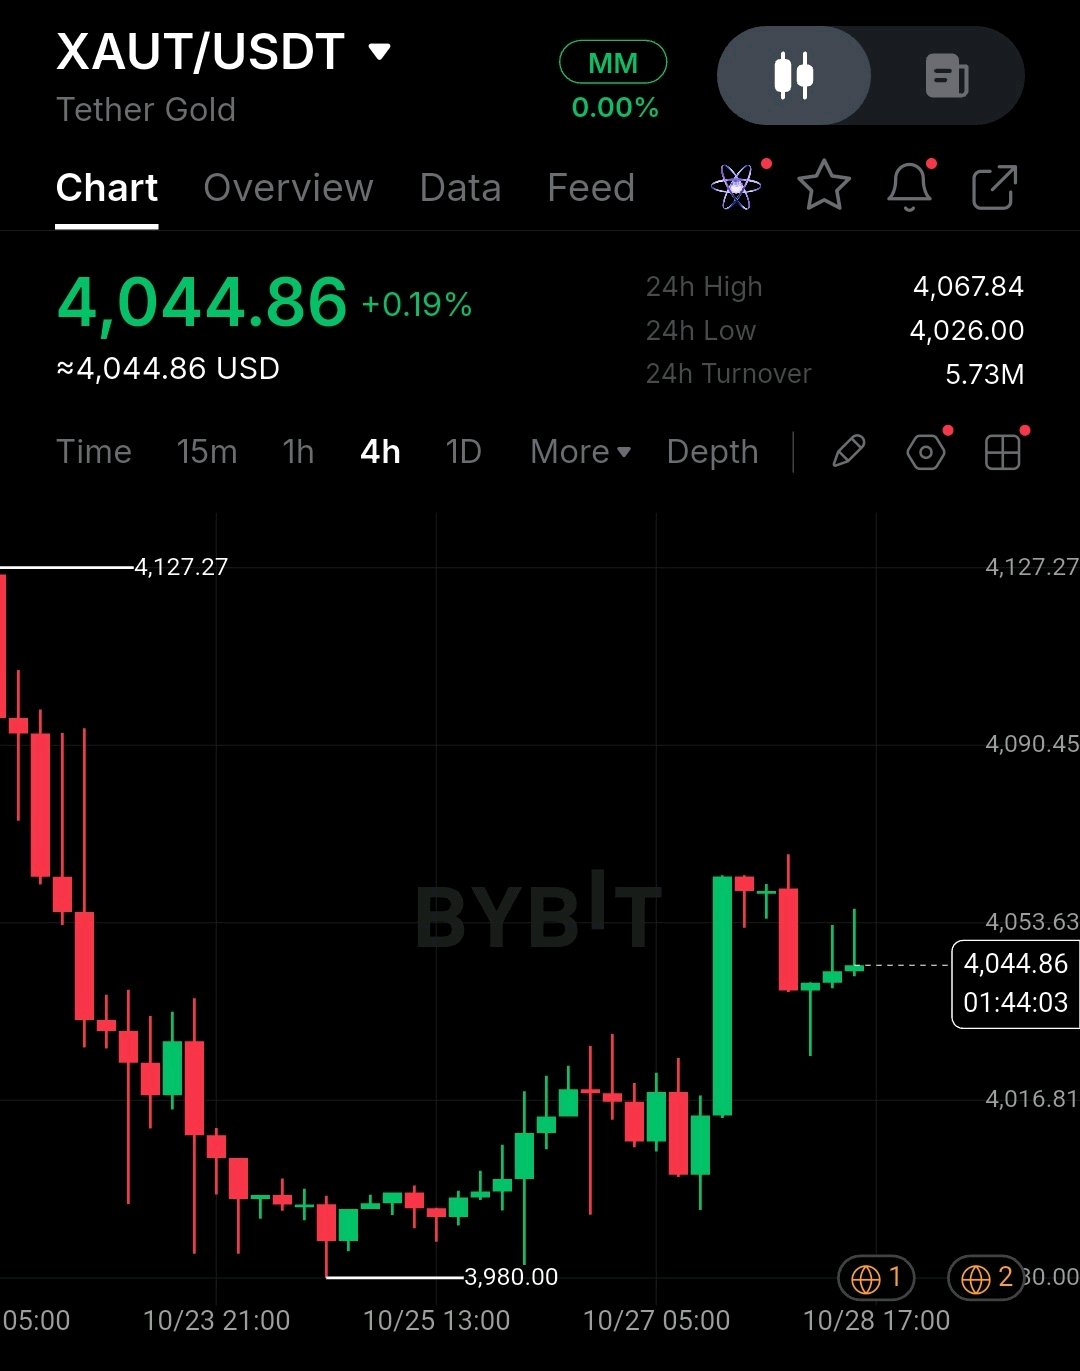
XAUTUSDT at 4,044.86, +0.19% today.
Gold took a beating from the 4,127.27 area, bottomed out at 3,980.00, then snapped back with one big green 4H candle. Since that spike, it's mostly been drifting sideways just under 4,053. What I'm seeing No moving averages on this chart, so I'm going off price action alone. The slide from 4,127.27 is the bigger story, but 3,980.00 has held and the recovery has been orderly. The recent candles are small with wicks poking both ways, which looks like the market pausing after a sharp move rather than committing to a direction. Volume and momentum MACD and RSI aren't showing. What stands out is that sellers keep capping pushes near 4,067 while buyers step in around 4,026. 24h turnover is 5.73M, which is light, so I'd be skeptical of any breakout that doesn't come with a real jump in volume. Levels on my radar Above: - 4,053.63 - 4,067.84 (24h high) - 4,090.45 - 4,127.27 (the swing high) Below: - 4,026.00 (24h low) - 4,016.81 - 3,980.00 (the swing low) How I'd approach it Long: wait for a 4H close above 4,067.84 with volume behind it. First target 4,090.45, then 4,127.27. Stop goes under 4,026.00. Short: a 4H close below 4,026.00 brings 4,016.81 into play, with 3,980.00 as the next stop on the way down. Between 4,026 and 4,067, I'm staying out. It's a tight box, and I'd rather wait for a candle to close outside it than guess which way it breaks. What would change my mind A close under 3,980.00 wipes out the bounce and puts sellers back in charge. A close above 4,127.27 would flip the bigger picture bullish. With volume this thin, moves can overshoot fast, so keep size modest and trust closes over wicks. Not financial advice. DYOR. $XAUTUSDT #MyByXTake #ByXIMPACT
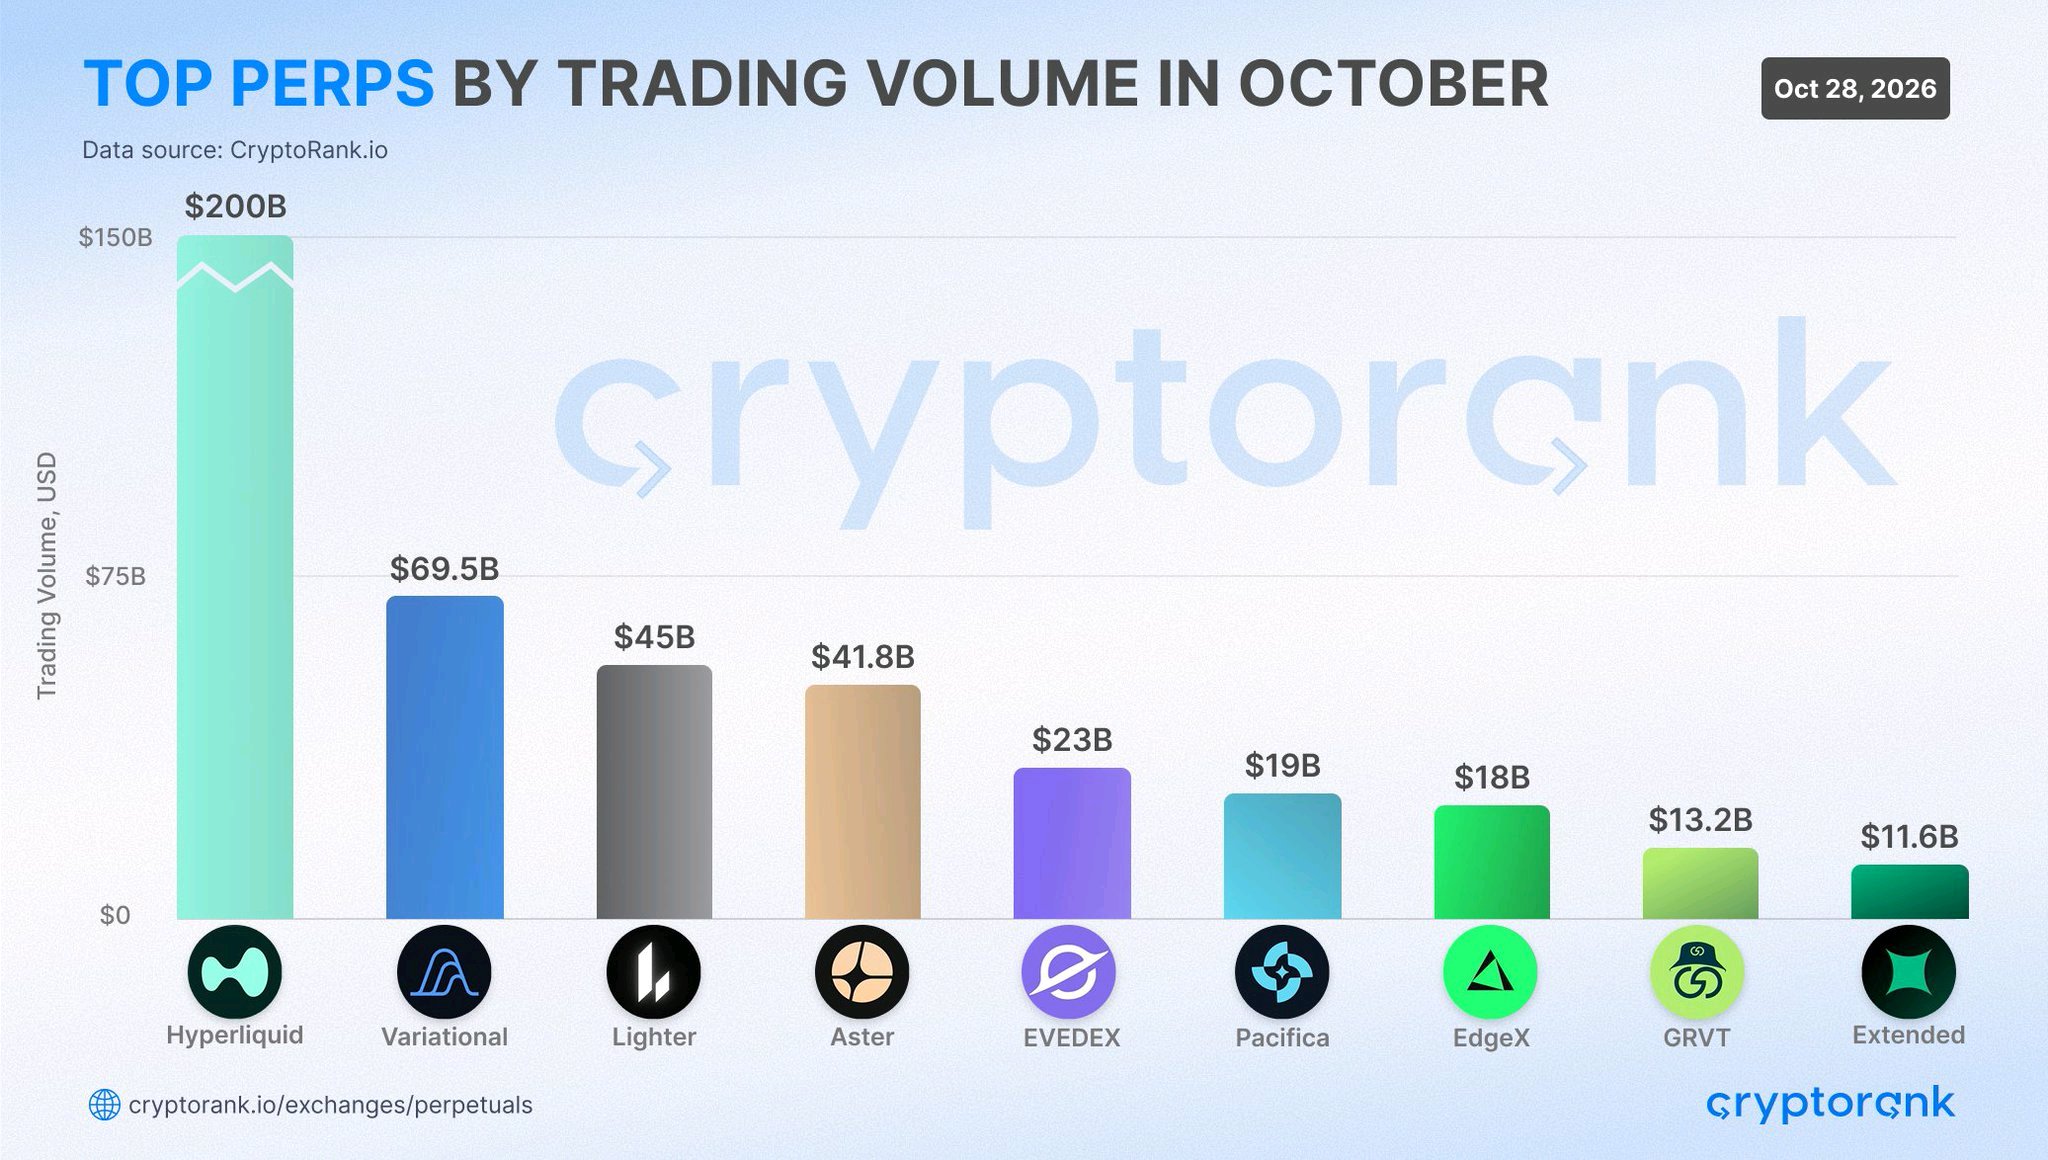
Hyperliquid's 35% Market Share: Volume Leadership Meets Data Quality Questions The headline figure is eye-catching: Hyperliquid processed $200 billion in perpetual futures volume during October, capturing nearly 35% of the entire on-chain perps market. The ranking that follows—Variational at $69.5B, Lighter at $45B, Aster at $41.8B, EVEDEX at $23B—paints a picture of a market with a clear leader and a crowded chasing pack. But as any seasoned perps trader knows, volume alone is a vanity metric. The more important question is: what kind of volume, and at what cost? The Bull Case: Hyperliquid's Structural Moat Hyperliquid's dominance is not accidental. Its custom L1 architecture delivers sub-second block latency and order book depth that rivals centralized exchanges—a prerequisite for attracting professional market makers and high-frequency flow . Unlike many competitors, Hyperliquid has built its moat on infrastructure rather than token incentives. The open interest-to-volume ratio tells a revealing story. Hyperliquid has historically maintained an OI/Volume ratio north of 280%, compared to Aster's approximately 12% . A high ratio indicates that positions are being held, not just churned. It suggests genuine directional conviction and hedging activity rather than wash trading designed to farm airdrop points. This distinction matters enormously for anyone trading on these venues. Deep, sticky open interest means tighter spreads, better fill quality, and less slippage on size. Volume that exists only to game a points program evaporates the moment incentives end. The Aster Problem: When Volume Doesn't Tell the Full Story The inclusion of Aster at $41.8B deserves scrutiny. In October, DefiLlama delisted Aster from its dashboard due to concerns that its reported volumes were mirroring Binance perpetuals data almost exactly . The platform's OI stood at roughly $4.86B against $41.78B in daily volume—a ratio that, as noted, is an order of magnitude below Hyperliquid's . For traders, the lesson is straightforward: not all perp DEX volume is created equal. Platforms that rely on aggressive token emissions or points programs to inflate activity may offer short-term trading opportunities, but they carry hidden risks. Liquidity can vanish. Execution quality can deteriorate. The counterparty you're trading against may not be what it appears. What This Means for Your Trading If you're trading size: Hyperliquid remains the default venue for on-chain perps. The depth is real, the latency is competitive, and the OI profile suggests a healthier market structure than the alternatives. That said, concentration risk is a factor—any single-venue dependency deserves monitoring. If you're hunting incentives: Lighter, Variational, and Aster all have active points or airdrop narratives. The volumes are real in the sense that trades are executing, but the durability of that liquidity post-incentive is unproven. Size positions accordingly and do not assume current spreads will persist. If you're watching the sector: The 35% figure is a snapshot, not a permanent state. October saw record total perp DEX volume of roughly $1.2 trillion, driven by incentive programs and a major liquidation event on October 10 . As those tailwinds fade, market share may shift. Hyperliquid's structural advantages should keep it in the lead, but the gap may narrow if competitors improve execution rather than just emissions. The Bottom Line Hyperliquid's 35% share is a legitimate achievement built on infrastructure, not just incentives. But the ranking below it is a mixed bag. Traders should use volume as a starting point for research, not a conclusion. Check open interest. Check spread history. Check whether the platform's volume survives when the points programs end. In perps, liquidity is oxygen. Make sure you're breathing the real thing.
🚨 A MAJOR STEP FORWARD IN FINANCIAL MARKETS! The DTCC is bringing traditional securities closer to blockchain technology, introducing tokenization for 34 securities across the Canton Network and Hyperledger Besu. With over $114 trillion in assets under custody, this move could accelerate institutional blockchain adoption and reshape how financial assets are issued, transferred, and settled. Wall Street is moving on-chain, and the next chapter of finance is taking shape. #ByXIMPACT #Bybit8thAnniversary



DOOD is showing exactly the kind of volatility that can trap late buyers. After surging from around $0.0014 to above $0.0028, the token has pulled back sharply, and now the question is whether this is a healthy reset or the start of another sell-off. What stands out is the volume behind the move. DOOD’s 24-hour trading activity surged into the tens of millions of dollars, while its market cap remains relatively small at around $16–17 million. That combination can create fast price swings in both directions, especially when leveraged traders enter the picture. Doodles is trying to build beyond its NFT origins through digital storytelling, community experiences and its DreamNet ecosystem. That gives the project a broader vision, but the token still needs sustained demand to turn that narrative into lasting value. Supply is another factor I wouldn’t ignore. DOOD has a maximum supply of 10 billion tokens, with around 7.8 billion reported in circulation. The next scheduled unlock is November 9, releasing roughly 61.1 million tokens. That is a relatively small portion of total supply, but market sentiment will determine whether traders absorb it comfortably. On the chart, $0.00200–$0.00205 is the first area I’m watching for support. Holding it could open a recovery toward $0.00230–$0.00245. A clean break above that range would bring $0.00275 back into focus. If $0.00200 fails, however, the recent rebound becomes much less convincing, with $0.00185 and $0.00150 as downside areas to watch. For now, I’m not chasing the spike. DOOD has attracted serious short-term attention, but the next move depends on whether buyers can defend support and build a base rather than simply repeat another volatility-driven pump. $DOODUSDT #ByXIMPACT
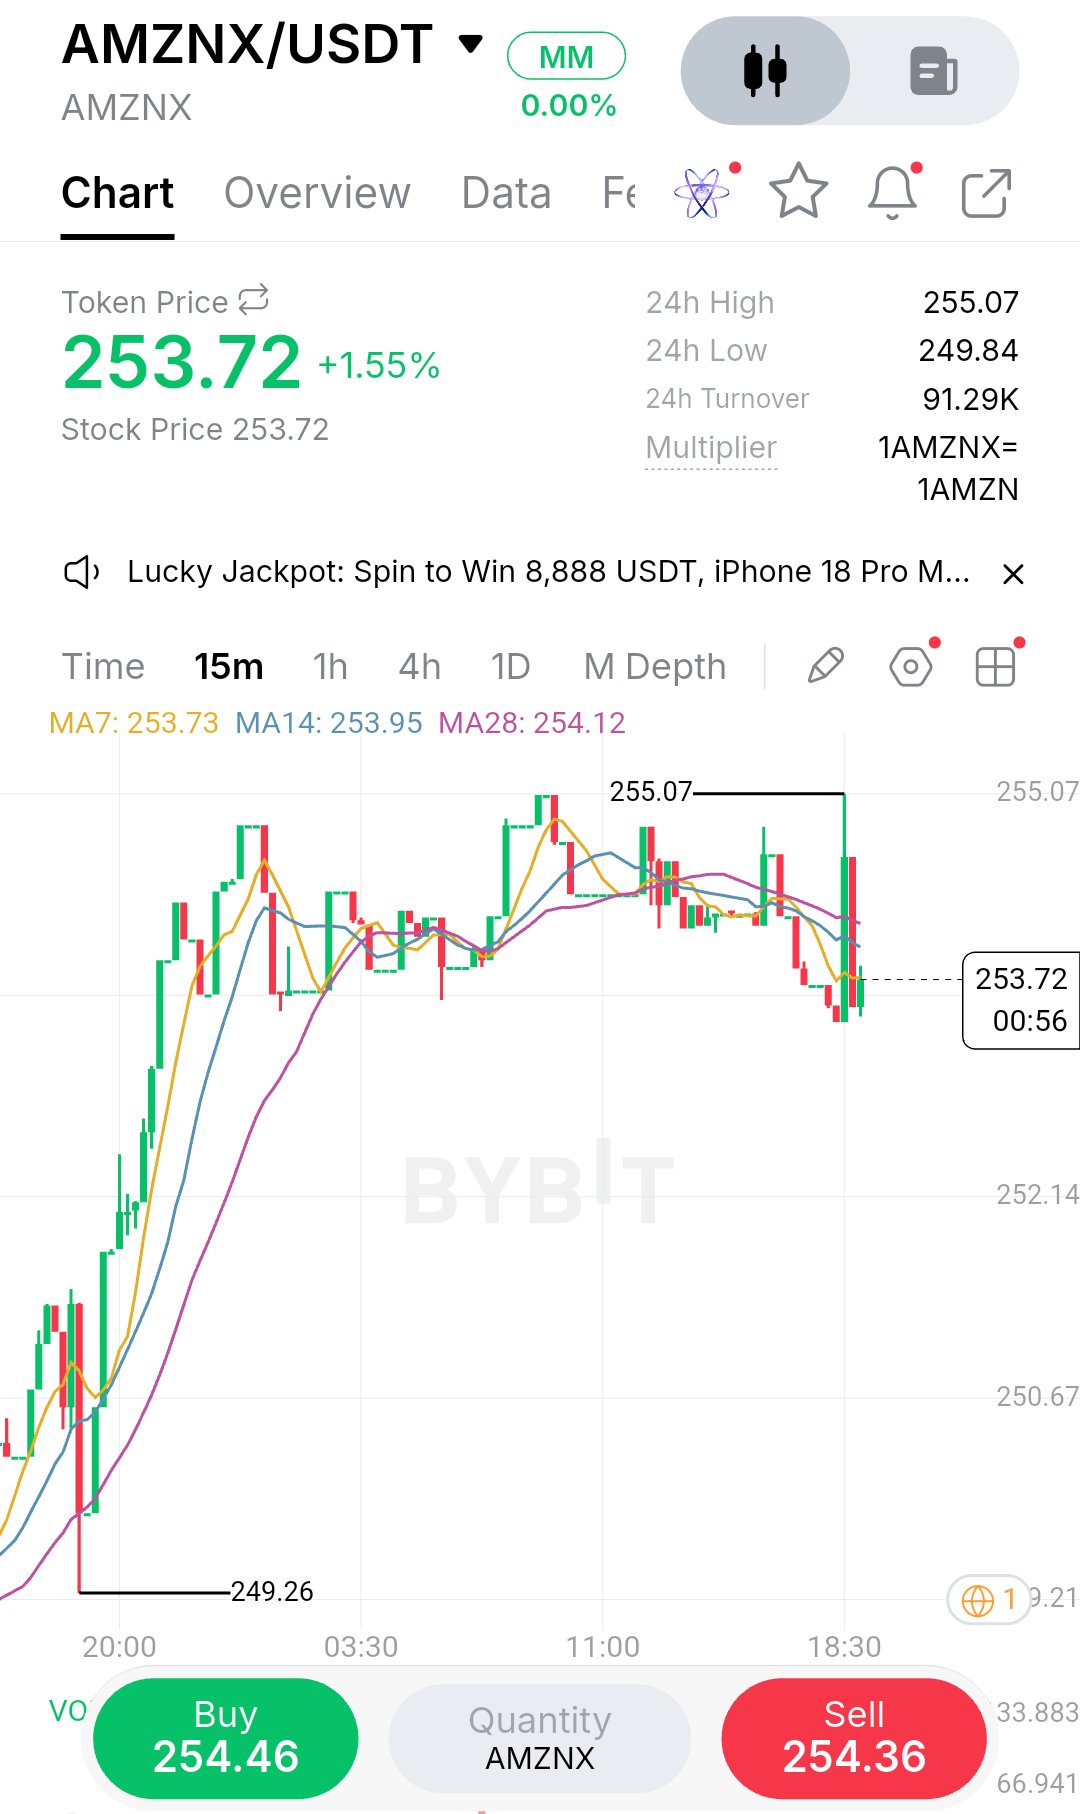
What caught my attention here wasn't the initial rally, but the way price is currently hesitating right below the 255.07 ceiling. I’ve seen this exact structure many times before: a strong impulsive push from 249.26, followed by a slow, grinding consolidation. This is where impatient traders get chopped up because they either buy the top of the range expecting a breakout, or they short the middle of the range because they think the momentum has died. Looking at the 15m chart, the market regime has clearly shifted from a strong uptrend into a short-term distribution or compression phase. The move from 249.26 to 255.07 was sharp and decisive, but since tagging that high, price has printed a series of lower highs and higher lows. It’s essentially building a tight range between roughly 252.50 and 255.07. What matters most right now is the moving average cluster. The MA7 at 253.73 and MA14 at 253.95 are starting to flatten out, while the MA28 at 254.12 is acting as immediate dynamic resistance above the current price of 253.72. The single most important feature of this chart is the rejection at the 255.00 psychological level. Price tried to break higher and got slammed back down, leaving a wick. Now, we are sitting right at the lower boundary of this micro-range. I don't see a clean, high-conviction entry at this exact moment because the current candle is sitting mid-structure relative to the MA cluster. To me, this is a wait scenario until price shows its hand at the edges of this range. If I am looking for a long, I want to see price sweep the local liquidity near 252.50 and immediately reclaim the MA28 at 254.12. That would be a classic liquidity sweep and reclaim, trapping early shorts and confirming that buyers are still defending the trend. On the flip side, if price breaks down below 252.50 and retests it as resistance, the short scenario becomes viable, targeting a fill of the inefficiency down toward 250.67. Right now, the bullish structure is still technically intact, but momentum is waning. Here is my disciplined plan based on this structure: Bias: Wait (favoring a long on a confirmed reclaim) Entry Zone: 253.80 to 254.20 (only after a 15m close above the MA28) Confirmation: A clean sweep of 252.50 followed by a strong 15m bullish engulfing candle that closes above 254.12. Stop Loss and Invalidation: 252.30 (a break below the recent swing low invalidates the higher-low structure). Take Profit 1: 255.07 (recent high) Take Profit 2: 257.50 (next psychological resistance) Take Profit 3: 259.00 (extension target) Risk/Reward: Approximately 1:2.5 if entering at 253.90 with a stop at 252.30. I’ve learned the hard way that trading the middle of a compression range is just gambling. The risk here is getting chopped up by the moving averages. If price just slowly bleeds through the MAs without a clear rejection or volume spike, the setup is dead. The invalidation is strict: if we get a 15m close below 252.30, I am canceling this long idea entirely and waiting for a lower structure. I’d rather miss a breakout than force a trade in this chop. Are you waiting for the edge of the range, or are you already positioning for the next leg up? $AMZNXUSDT #ByXIMPACT

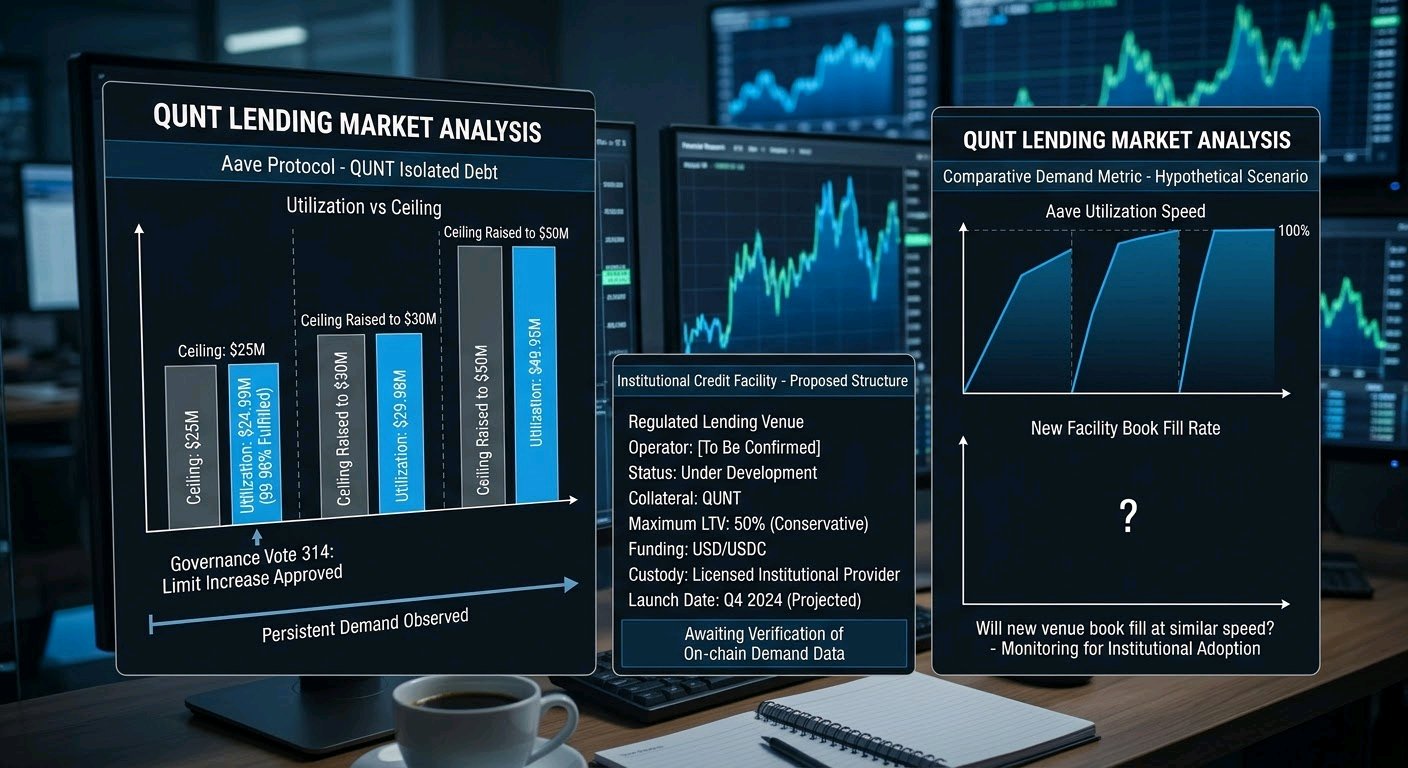
$QNTUSDT holders repeatedly exhausting borrowing capacity on a major lending protocol would signal something more specific than simple spot demand: holders want liquidity without surrendering their underlying positions. The critical evidence would be an isolated debt ceiling approaching its exact cap, followed by governance raising that ceiling, only for borrowers to consume the additional headroom again. A sequence such as $25M → $30M → $50M would establish a meaningful pattern, but verified QNT-specific utilization data is necessary before treating that sequence as fact. The next development to watch would be a more conservative lending venue offering credit against Quant’s QNT token. For that comparison to carry institutional weight, the venue would need a verifiable launch date, an identified operator, confirmed QNT collateral support, published maximum loan-to-value ratios, explicit USD or USDC funding terms, and documented custody arrangements. A regulated custodian or federally chartered bank would strengthen the distinction, provided the relationship is confirmed rather than inferred. The positioning is less a spot listing and more a credit listing — a regulated on-ramp for holders who want liquidity against QNT without touching a smart contract or selling the underlying position. The more consequential question is the direction of causality: whether documented on-chain borrowing demand preceded the arrival of a more conservative credit venue, rather than the venue being launched speculatively and waiting for borrowers to appear. Without verified evidence of QNT-specific debt-ceiling exhaustion or a live institutional lending facility, presenting those details as established facts would overstate the available evidence. Worth watching whether utilization on any confirmed new venue’s book fills anywhere near as fast as the original DeFi protocol’s did. #ByXIMPACT
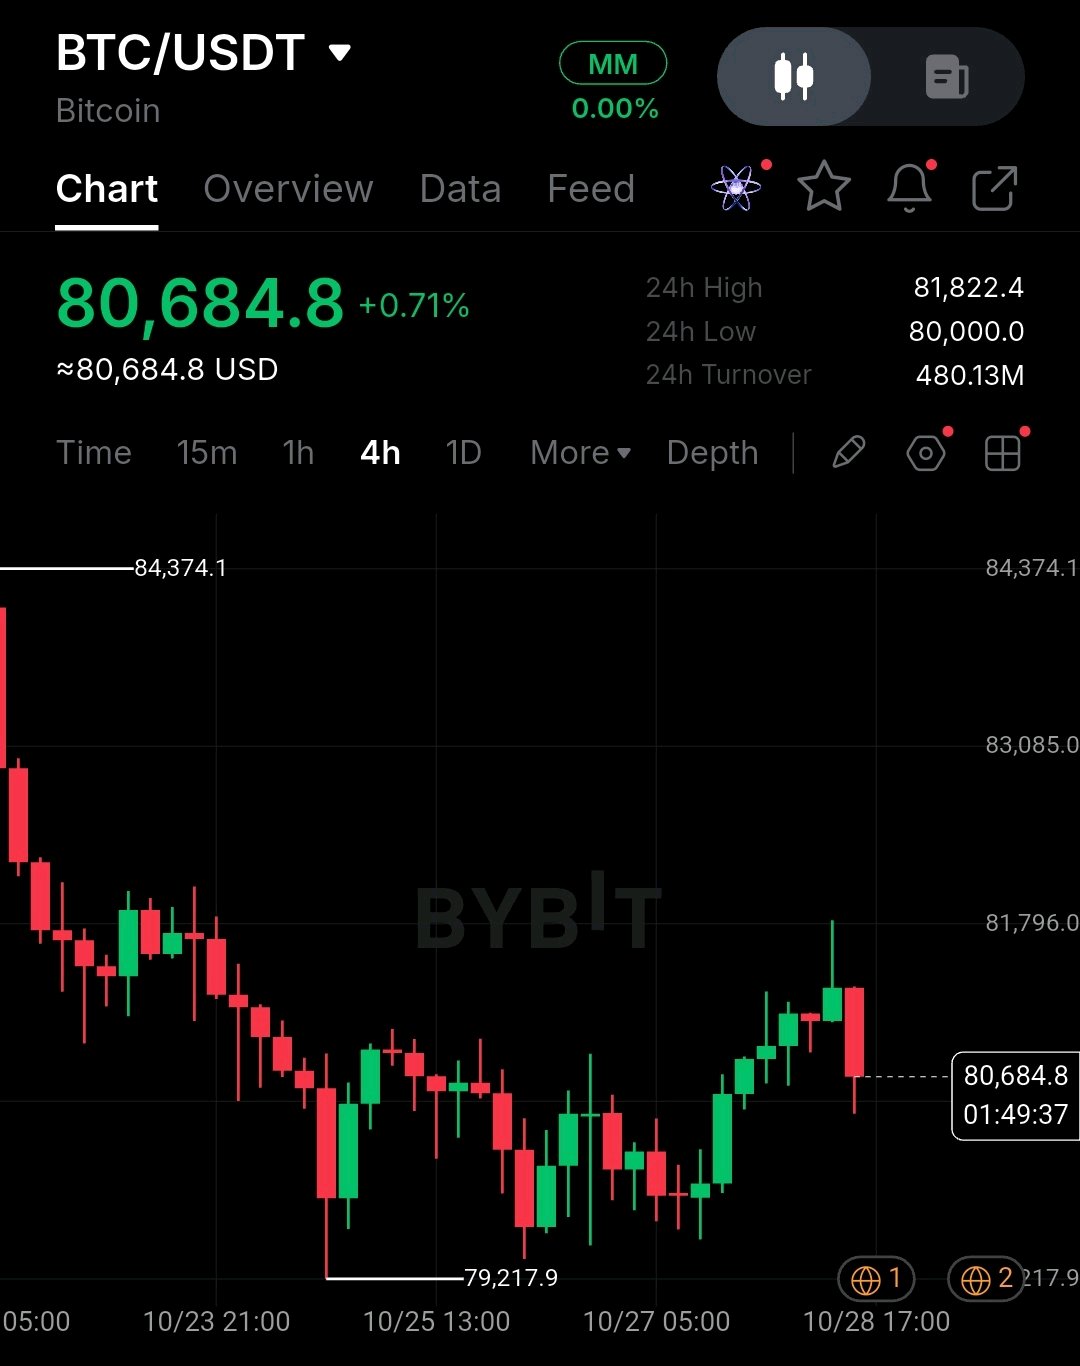
BTCUSDT at 80,684.8, +0.71% today.
Bitcoin has spent the last few sessions grinding off the 84,374.1 area, bottomed at 79,217.9, and is now trying to claw back. It poked up to 81,800 and got sold right away, and the 4H candle that's open now is red. Where we are No moving averages on this screenshot, so this is a pure price-action read. The bigger picture is still lower highs stepping down from 84,374.1. But since the 79,217.9 low, the dips have been getting shallower, and that's the first hint sellers are running out of steam. It looks like a base forming, not a reversal yet. Volume and momentum MACD and RSI aren't on the chart. What I can see is that wick near 81,800 getting rejected fast, so buyers haven't shown real conviction up there. 24h turnover is 480.13M, which is solid, but the tape feels balanced rather than directional. I'd want a close above resistance with volume expanding before trusting any trend change. Levels on my radar Above: - 81,822.4 (24h high) - 83,085.0 - 84,374.1 (the swing high that started the slide) Below: - 80,000.0 (24h low and a big round number) - 79,217.9 (swing low) How I'd approach it Long: wait for a 4H close above 81,822.4 with real volume behind it. First stop on the way up is 83,085.0, then 84,374.1. Invalidation sits under 80,000. Short: a 4H close below 80,000 puts 79,217.9 back in play, and a close under that opens the door to another leg down. Between 80,000 and 81,822 I'm happy to sit on my hands. It's a tight box, and the edge only appears once price closes outside it. What would prove me wrong A close under 79,217.9 kills the higher-low base and hands control back to the downtrend. A close above 84,374.1 flips the whole structure bullish. BTC loves to whip around round numbers like 80k, so keep size modest and trust closes over wicks. Not financial advice. DYOR. $BTCUSDT #ByXIMPACT #BybitStocks #MyByXTake

You can be a crypto trader and still care about Alphabet earnings. GOOGL sits at the intersection of megacap growth, AI capital expenditure and broad equity-market sentiment. A stronger Cloud story could support confidence in the AI investment cycle. A margin or spending disappointment could pressure growth-stock risk appetite. Neither scenario gives us a clean BTC target, and crypto-specific flows can easily dominate. My preference is to compare the Nasdaq reaction, Treasury yields and BTC spot follow-through instead of turning one corporate earnings surprise into an automatic crypto trade. #EarningsWatch